Quantcast
Channel: Newgeography.com - Economic, demographic, and political commentary about places
Viewing all 3793 articles
Browse latest View live

Developing Economies Dominate Per Capita GDP-PPP Growth

$
0
0

The world’s developing economies have dominated purchasing power economic growth over the last 35 years, according to the most recent gross domestic product (GDP-PPP) per capita data from the International Monetary Fund (IMF). This article summarizes economic growth for three periods, including from the earliest IMF data (1980 to 2015), the intermediate 2000 to 2015 period and the more recent 2010 to 2015 timeframe. The full data is available on the Demographia website, at http://www.demographia.com/db-imf2015.pdf.

GDP per capita provides a measure of comparative income for individuals in an economy, as opposed to overall GDP data, which is a measure of an economy’s total production. This is an important distinction, because an economy may have a very high overall GDP, while its residents have relatively low income. For example, India has the world’s fourth largest GDP, yet with its population approaching 1.3 billion, ranks 126th in GDP per capita (out of the 190 countries and sub-national geographies included in the database). On the other hand, China’s Macao Special Administrative Region has the third highest GDP per capita in the world, but barely manages to be within the 100 largest economies, due to its much smaller population (approximately less than 600,000).

Fastest Growing Economies

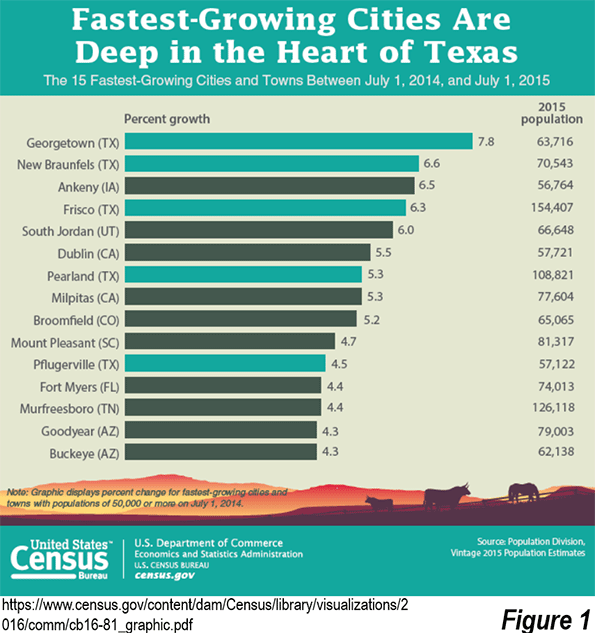
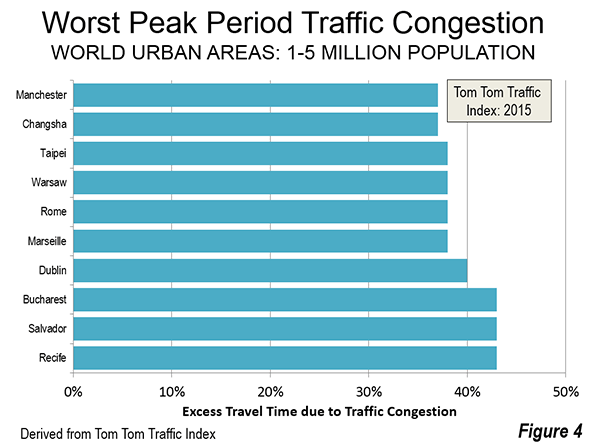
2010-2015: The most recent period exhibited remarkable geographic diversity among the fastest growing economies. Asia contributed 13 entries out of the top 20, with Africa adding three (Ethiopia, Ghana and the Democratic Republic of the Congo), Europe two (Latvia and Lithuania), Oceana one (Papua New Guinea) and North America one (Panama). The fastest growing economy was Turkmenistan, at 67 percent, closely followed by Mongolia at 63 percent and Ethiopia at 61 percent. China, which has sustained strong growth throughout all of the periods examined, ranked fourth at 54 percent. Myanmar, now emerging from decades of dictatorship,  was the fifth fastest growing economy, at 49 percent (Figure 1).

The top 20 included two of the world’s poorest economies, third ranked Ethiopia, with a GDP per capita of $1,800 and the Democratic Republic of the Congo (DRC), which ranked 19th, with a GDP per capita of $800 (both figures are after the 2010-2015 increase). The improvement in the DRC is thus very encouraging, but it is  from a severely impoverished base.

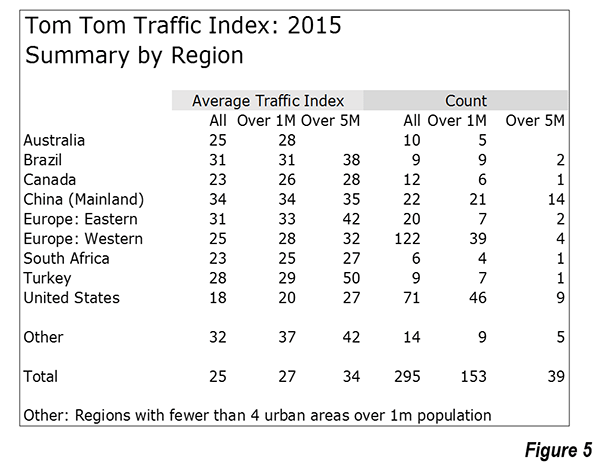
2000-2015: Perhaps surprisingly, nine of the 20 fastest growing economies over the interim period (2010-2015) are former Soviet republics. Turkmenistan was, as between 2010 and 2015, the fastest growing, at 540 percent. Turkmenistan was joined by fellow former Soviet Azerbaijan , which grew 393 percent. Other former Soviet republics in the top 20 included Georgia, Armenia, Kazakhstan, Uzbekistan, Belarus, Lithuania and Tajikistan.  However, the largest former Soviet republic of all, the Russian Federation, was not among the fastest growing but placed a respectable 45th .

China ranked third in economic growth, only slightly below Azerbaijian.at 388 percent. Timor-Leste, recovering from its intense ethnic conflict, ranked fourth. Myanmar ranked fifth.

1980-2015: Over the longer period (1980-2015), Equatorial Guinea grew the fastest, at more than 8,000 percent, driven by its rich oil resources. China ranked second, at 4,500 percent. This huge increase was from a second worst in the world GDP per capita, which was a mere  $300 in 1980. Small Bhutan ranked third, at 1,627 percent, followed by the Republic of Korea (South Korea), which grew 1,572 percent, to become one of the world’s strongest economies. Vietnam ranked fifth, growing 1,283 percent (Figure 3).

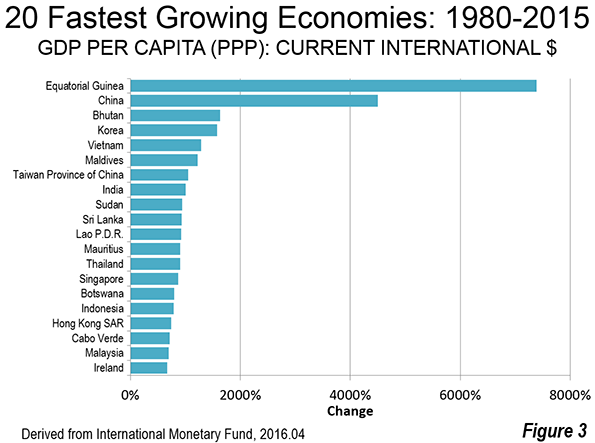
Three of the world’s richest economies, with GDP’s per capita above $50,000, were also among its fastest growing between 1980 and 2015. These included Singapore (14th), Hong Kong (17th) and Ireland (20th).

Slowest Growing Economies

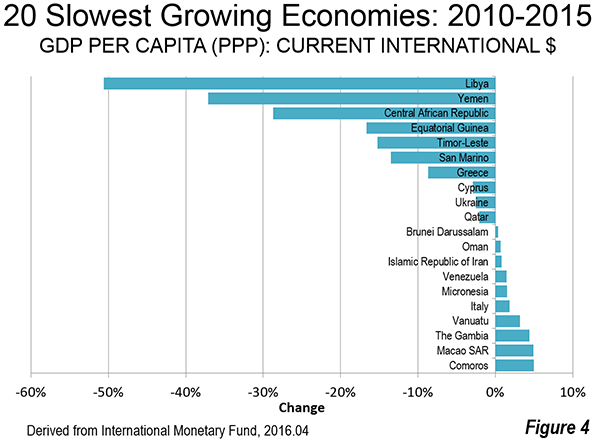
2010-2015: The slowest growing economies in the last five years have suffered serious civil disorder.  Troubled Libya experienced a more than halving of its GDP per capita between 2010 and 2015. In 2010, Libya had a GDP per capita of $29,600, more than long-time European Union (EU-15) members Greece ($29,000) and Portugal ($26,500). By 2015, Libya had dropped to $14,600, less than Brazil ($15,600) and the Dominican Republic ($15,000).

Similarly unstable Yemen experienced a loss of 37 percent, from $4,200 to $2,700.

The Civil war ravaged Central African Republic lost 29 percent in GDP per capita. This is made worse by the fact that the Central African Republic ranked 185th in GDP per capita in 2010 out of the 189 geographies for which there is data. The 2015 data shows the Central African Republic to rank dead last in GDP per capita, 190th out of 190.

Oil producing Equatorial Guinea experienced a loss of 17 percent in its GDP per capita, which is particularly significant, since Equatorial Guinea had the largest gain of any economy between 1980 and 2015.

Three current European Union members were among the slowest growing economies. Greece had the 7th largest loss (-8.8 percent), while Cypress had the 8th largest loss (2.9 percent). Italy was the 16th slowest growing economy, gaining 1.8 percent (Figure 4).

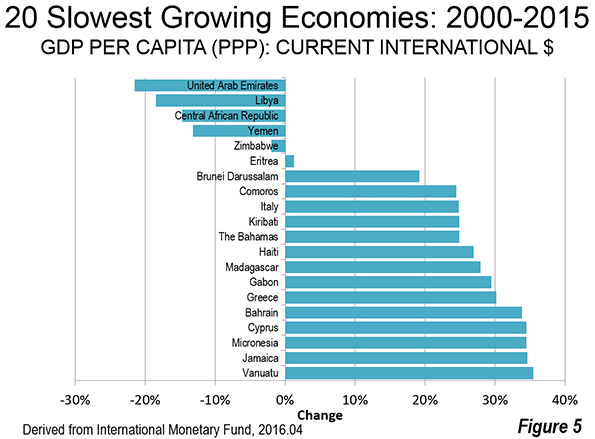
2000-2015: The largest loss in GDP per capita between 2000 and 2015 was experienced by the oil producing United Arab Emirates. The next three greatest losses were in Libya, the Central African Republic and Yemen, which also sustained the largest losses between 2010 and 2015. The same three European Union members as in 2010-2015 made the 2000-2015 slowest growth list, Italy, Greece and Cypress (Figure 5).

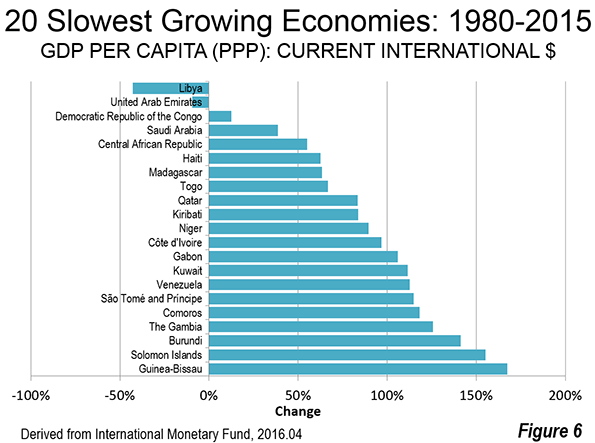
1980-2015: Libya and the United Arab Emirates were the only geographies to post GDP per capita losses over the past 35 years. Miniscule growth was experienced in the third slowest growing Democratic Republic of the Congo, though as indicated above, the DRC managed to make the top 20 in growth between 2010 and 2015.

The Future

While there is much to celebrate about economic growth over the last 35 years and even in the more recent periods, far too much of the world lives in poverty and middle-income standards of living are declining, especially in the high-income world. These factors were the subject of discussions at the 2014 Brisbane G20 conference, when world leaders adopted a communique stressing a commitment to improving standards of living and eradicating poverty.

Yet, a year and half later, International Monetary Fund Managing Director Christine Lagarde expressed a cautionary note in introducing the organization’s latest World Economic Outlook. The IMF indicated that Director Legarde warned that the recovery remains too slow, too fragile, with the risk that persistent low growth can have damaging effects on the social and political fabric of many countries. It is to be hoped that future reports will show large numbers of people exiting poverty, and a resumption in the rise of middle-income living standards. If these run in tandem, the world economy will be in the best shape in history.

Wendell Cox is principal of Demographia, an international pubilc policy and demographics firm. He is a Senior Fellow of the Center for Opportunity Urbanism (US), Senior Fellow for Housing Affordability and Municipal Policy for the Frontier Centre for Public Policy (Canada), and a member of the Board of Advisors of the Center for Demographics and Policy at Chapman University (California). He is co-author of the "Demographia International Housing Affordability Survey" and author of "Demographia World Urban Areas" and "War on the Dream: How Anti-Sprawl Policy Threatens the Quality of Life." He was appointed to three terms on the Los Angeles County Transportation Commission, where he served with the leading city and county leadership as the only non-elected member. He served as a visiting professor at the Conservatoire National des Arts et Metiers, a national university in Paris.

Photograph: Addis Abeba, capital of Ethiopia (3rd fastest growing economy 2010-2015)


Battle of the Imperial Pretenders

$
0
0

It took the Roman Republic five centuries to devolve into a centralized despotism. It may take ours roughly 240 years to get to the same place, but with decidedly less upside.

Concern over a crossing of a constitutional Rubicon – the northern Italian river whose passage by Julius Caesar and his legion in 49 B.C. occasioned the death of the Republic – has centered on Donald Trump. The Donald might not have conquered Gaul, or written a brilliant account of his exploits, but his Caesarist attributes – overweening self-regard, contempt for existing institutions and a touch of glamour – are all too obvious.

No surprise, then, that some on the left, perhaps rehearsing their roles as cheerleaders for Hillary Clinton, see Trump as a “tyrant” – a Caesar in training. Others see a reincarnation of Italy’s fascist dictator Benito Mussolini and link Trump’s success to that of the rising European populist parties, which progressives often label, sometimes accurately, as protofascist.

Many on the intellectual right also see in The Donald an imperial pretender. New York Times Republican stalwart Ross Douthat has called the likely GOP presidential standard bearer “a protofascist grotesque with zero political experience and poor impulse control.”

Read the entire piece at The Orange County Register.

Joel Kotkin is executive editor of NewGeography.com. He is the Roger Hobbs Distinguished Fellow in Urban Studies at Chapman University and executive director of the Houston-based Center for Opportunity Urbanism. His newest book, The Human City: Urbanism for the rest of us, will be published in April by Agate. He is also author of The New Class ConflictThe City: A Global History, and The Next Hundred Million: America in 2050. He lives in Orange County, CA.

Top image by DonkeyHotey (Hillary Clinton vs. Donald Trump - Caricatures) [CC BY-SA 2.0], via Wikimedia Commons

Scandinavian Women Do Well, Except at the Top

$
0
0

In which part of the world should we expect most women to reach the top? The answer has to be the Nordic countries. According to The Global Gender Gap report, for example, Iceland is the most gender equal country in the world followed by Norway, Finland and Sweden. Yet as I will discuss below, this has not translated in women making it to “the top”, as one might expect. This a paradox that I will seek to address.

Around the world, the Nordic countries are often idealized as the most gender equal places in the world. To a large degree, this admiration is warranted. But it is time to realize that the very same system is holding back women’s ability to reach the top.

To begin with, the Nordics have a unusual gender equal history. The tradition of gender equality has roots in Viking culture. For example, Scandinavian folklore is primarily focused on men who ventured on longboats to trade, explore and pillage. Yet the folklore also includes shiledmaidens, women chosen to fight as warriors. Byzantine historian John Skylitzes records that women were indeed participating in Nordic armies during the 10th century. The fact that women were allowed to bear arms, and train as warriors, suggests that gender segmentation in early Norse societies was considerably more lax – or at least more flexible – than other parts of contemporary Europe. Evidence also suggests that women in early Nordic societies could inherit land and property, that they kept control over their dowry and controlled a third of the property they shared with their spouses. In addition, they could, under some circumstances at least, participate in the public sphere on the same level as men.

Medieval law, which likely reflects earlier traditions, supports this notion. Medieval inheritance laws in Norway for example followed family relations through both male and female lines. Additionally, women could opt for a divorce. These rights might not seem impressive today, but they were rather unusual in a historical context. In many contemporary European and Asian societies, the view was that women simply belonged to their fathers or husbands, having little right to property, divorce or inclusion in the public sphere.

Nordic gender egalitarianism continued after the Viking age, particularly in Sweden. In much of the world, women were excluded from participating, at least fully, in the rise of early capitalism during the 18th and 19th centuries. In essence, free markets and property rights were institutions that initially excluded women. Although Sweden and the other Nordic countries were far from completely egalitarian, they challenged contemporary gender norms by opening up early capitalism for women’s participation.

As shown below, the World Value Survey has asked respondents around the world whether they believe that men should be prioritized over women if jobs are scares. In modern market economies, fewer agree with this notion. In Switzerland for example, 22 per cent believe that men should have more right to a job than women, compared to 16 per cent in the United Kingdom and 14 per cent in Canada and Australia. Sweden has the lowest share agreeing with this view, merely 2 per cent. Norway (6 per cent) and Finland (10 per cent) are also amongst the countries with egalitarian views.

In addition, the Nordic welfare states have encouraged women to enter the labor market early on. Still today Nordic countries are ahead of most of Europe in this regard. Child care cost and paid maternity, services provided largely by the public sector in the Nordic welfare states, can in part explain the high labor participation amongst both parents. Such systems are much more extensively funded by the public sector in the Nordics compared to other modern economies, and particularly so compared to the Anglo-Saxon nations. Although even here, the United States, still not a full welfare state, does surprisingly well.

A long history of gender equality, gender equal norms, many women actively participating in the labor market and family friendly welfare policies – surely this should be seen as the recipe for many women reaching the top of the business world? In the new book The Nordic Gender Equality Paradox I show that this is not the case. In Nordic countries surprisingly few women have made to the top echelons.   

The OECD gathers information about the proportion of employed persons which have managerial responsibilities in different developed economies. In the table below the share of women managers in different countries is shown as a percentage of the share of male managers. This calculation yields a measure of the likelihood of the average employed women to reach a managerial position compared to the average employed man. The likelihood of a women reaching a managerial position as compared to the same likelihood for a man in the United States is found to be 85 per cent. This is far higher than any other country in the study. As a comparison, the same share is 60 per cent in the United Kingdom and 52 in Sweden. Norway (48 per cent), Finland (44 per cent) and Denmark (37 per cent) score even lower.

It should be emphasized that this measure includes public sector managers, which inflates the figures for Nordic countries compared to if private sector managers had been studied. The data paints a clear picture: The United States, where welfare state programs do not subsidize women’s parental leave has more women reaching managerial positions than any of the Nordic welfare states.

Why is it that Nordic countries fail to reach their gender equal potential? Shouldn’t these countries be heads and shoulders above the US when it comes to the share of women climbing to the top? Progressive theorists would naturally assume this. But in reality there is a paradox here; the egalitarianism of the Nordics has clear limits.   At the end of 2014 for example, The Economist ran a story entitled A Nordic mystery

“Visit a typical Nordic company headquarters and you will notice something striking among the standing desks and modernist furniture: the senior managers are still mostly men, and most of the women are [program administrators]. The egalitarian flame that burns so brightly at the bottom of society splutters at the top of business.”

As I explain in The Nordic Gender Equality Paradox there is a logical answer to the apparent paradox: policy matters. Numerous studies support the conclusion that the large welfare states in the Nordics, although designed to aid in women’s progress, in fact are hindering the very same progress. Social democratic systems do provide a range of benefits for women, such as generous parental leave systems and publicly financed day care for children. The models however also have features that are detrimental to woman’s careers.

To give an illustrative example, public sector monopolies in women-dominated areas such as health and education seem to substantially reduce the opportunities for business ownership and career success amongst women. Welfare state safety nets in particular discourage women from self-employment. Overly generous parental leave systems encourage women to stay home rather than work. Substantial tax wedges make it difficult to purchase services that substitute for household work, which reduces the ability of two parents to engage fully in the labor market.

The Nordic welfare model has, perhaps unintentionally, created a model where many women work but seldom in the private sector and seldom enough hours to be able to reach the top. For example, it might seem as a puzzle why the Baltic countries – which have much more conservative and family oriented cultures – have a higher share of women amongst managers, top executives and business owners than their Nordic neighbors. As shown below, a key factor is difference in working time. In the Nordic societies the average employed man works fully 22 per cent more hours than the average working women. In the Baltic model, where families have greater choice in organizing their lives compared to the Nordic welfare states, the gap is only 9 per cent. On top of this comparison, which looks at working individuals, many Nordic women also take long parental leaves, paid to do so by the welfare state, and thus fall behind in their careers. Of course Baltic mothers are also much concerned for the upbringing of their children. However, many of them solve the equation by getting help from family, perhaps grandmother, to watch the children or buy services to alleviate household work – something easier to do in low-tax countries.

Thus, for all their gender equal progress, the Nordic countries in fact have relatively few women entrepreneurs, managers and executives. And there is really not a paradox why this situation has developed. It’s all about the policy choices made in the Nordics.

As is clear, an expansive welfare state may be good for some things, but expanding the ranks of managers for women is not one of them. The feminist heritage that dates back to the age of the Vikings needs to be combined with a more free-market and small government approach if Nordic societies are to fulfill their gender equal potential. Perhaps this is also a lesson to the rest of the world, where progressive policies are often seen as the recipe for promoting women’s careers.

Nima Sanandaji is the president of the European Centre for Policy Reform and Entrepreneurship (www.ecepr.org) and a research fellow at the Centre for Policy Studies and at the Centre for Market Reform of Education. His latest book, The Nordic Gender Equality Paradox, can be ordered here.

De-Industrialization and the Displaced Worker

$
0
0

Much has been made of working class pain in this election, but the problems go well beyond that.  I don’t like the 1% vs. 99% frame, but it captures something important about our society, namely a sort of bifurcation that has occurred between top and bottom. Roughly the top 20% are doing quite well, and increasingly live in communities surrounded by others like themselves. The bottom 80% does not seem to be faring so well on a variety of social and economic statistics.

The policies offered by the mainstream of both parties has more or less boiled down to “more of the same stuff we’ve always pitched.” Clearly, the public is looking for something different.

That’s the subject of my column now out in the May issue of Governing magazine called “De-Industrialization and the Displaced Worker.”  Here’s an excerpt:

In George O. Smith’s science fiction short story “Pandora’s Millions,” society collapses when the invention of a “matter replicator,” like the ones from Star Trek, instantly renders most of the economy, and money itself, obsolete. Being a short story, this is resolved quickly with the invention of a substance that can’t be duplicated, followed by rebuilding the economy and society around services. Real life doesn’t always recover so quickly from disruptions, as we are finding out.

Unsurprisingly, this has generated discontent. Back through to the 1980s and ’90s, this was mostly limited to displaced industrial workers. Today that has grown to a much broader spectrum, from young master’s degree holders with piles of student loan debt who are stuck working at Starbucks to corporate middle managers losing their jobs to outsourcing or foreigners working here under H1-B visas.

This has percolated through to the political system, with the rise of Donald Trump and Bernie Sanders, both questioning many of the premises of the current economic system. America is more receptive to these arguments than many ever would have believed possible. That’s because the current system has lost legitimacy in the minds of many. Not only did it fail to deliver the promised benefits to them, but then government turned around and bailed out the big banks in the financial crash.

Click through to read the whole thing.

Aaron M. Renn is a senior fellow at the Manhattan Institute, a contributing editor of City Journal, and an economic development columnist for Governing magazine. He focuses on ways to help America’s cities thrive in an ever more complex, competitive, globalized, and diverse twenty-first century. During Renn’s 15-year career in management and technology consulting, he was a partner at Accenture and held several technology strategy roles and directed multimillion-dollar global technology implementations. He has contributed to The Guardian, Forbes.com, and numerous other publications. Renn holds a B.S. from Indiana University, where he coauthored an early social-networking platform in 1991.

Image by Flickr/Mirko Tobias Schäfer – CC BY 2.0

New York's Incredible Subway

$
0
0

The New York subway is unlike any other transit system in the United States. This system extends for 230 miles (375 kilometers) with approximately 420 stations. It serves the four highly  dense boroughs of the city (Manhattan, Brooklyn, Queens and the Bronx), each of which is 20 percent or more denser than any municipality large municipality in the United States or Canada. Much of the fifth borough, Staten Island, looks very much like suburban New Jersey and has no subway service, though has a more modest system, the Staten Island Railway.

Overall, the older Metros (Note 1), New York's subway, along with London's Underground and the Paris Metro dominated the world's urban rail systems for decades. Until the recent emergence of Chinese urban areas (Beijing and Shanghai), London had the longest extent of track in the world, followed by New York.

As one of the original Metros in the world, it might be thought that the New York City Subway's best days are over. That would be a mistake. It is true that ridership reached a peak in the late 1940s and dropped by more than half between the late 1970s and the early 1990s. However, since that time ridership has more than doubled, according to American Public Transportation Association data. And it is not inconceivable that new records may be set in the years to come.

Perhaps the most incredible thing about the New York City Subway has been its utter dominance of the well-publicized national transit ridership increases of the last decade. According to annual data published by the American Public Transportation Association (APTA), ridership on the New York City Subway accounts for all of the transit increase since 2005. Between 2005 and 2015, ridership on the New York City Subway increased nearly 1 billion trips. By contrast, all of the transit services in the United States, including the New York City Subway, increased only 800 million over the same period. On services outside the New York City subway, three was a loss of nearly 200 million riders between 2005 and 2015 (Figure 1).

The New York City subway accounts carries nearly 2.5 times the annual ridership of the other nine largest metro systems in the nation combined (Figure 2). This is 10 times that of Washington’s Metro, which is losing ridership despite strong population growth , probably partly due to safety concerns (see America’s Subway: America’s Embarrassment?). Things have gotten so bad in Washington that the federal government has threatened to close the system (See: Feds Forced to Set Priorities for Washington Subway).

The New York City subway carries more than 11 times the ridership of the Chicago “L”, though like in New York, the ridership trend on the “L” has increased impressively in recent years. The New York City subway carries and more than 50 times the Los Angeles subway ridership, where MTA (and SCRTD) bus and rail ridership has declined over the past 30 years despite an aggressive rail program (See: Just How Much has Los Angeles Transit Ridership Fallen?).

With these gains, the New York City Subway's share of national transit ridership has risen from less than one of each five riders (18 percent) in 2005 to more than one in four (26 percent) in 2015. This drove the New York City metropolitan areas share of all national transit ridership from 30 percent in 2005 to over 37 percent in 2015.

Subway ridership dominates transit in the New York City metropolitan area as well, at 67 percent. Other New York City oriented transit services, including services that operate within the city exclusively and those that principally carry commuters in and out of the city account for 28 percent of the ridership. This includes the commuter rail systems (Long Island Railroad, Metro-North Railroad and New Jersey Transit) and the Metro from New Jersey (PATH) have experienced ridership increases of approximately 15 percent over last decade (Note 2).

Other transit services, those not oriented to New York City, account for five percent of the metropolitan area's transit ridership (Figure 3). By comparison, approximately 58 percent of the population lives outside the city of New York. The small transit ridership share not oriented to New York City illustrates a very strong automobile component in suburban mobility even in the most well-served transit market in the country.

Last year (2014), APTA announced that the nation's transit ridership had reached the highest in modern history, having not been higher since 1957. In fact, the ridership boom that produced the record can be attributed wholly to the New York City Subway. If New York City Subway ridership had remained at its 2005 level, overall transit ridership would have decreased from 9.8 billion in 2005 to 9.6 billion in 2015. The modern record of 10.7 billion rides would never have been approached.

Thus, transit in the United States is not only a "New York Story," but it has also been strongly dependent on the New York Subway in recent years. After decades of decline, the revival of the New York subway is a welcome development.

Note 1: “Metro” is the international generic term for grade separated rapid transit systems. In the United States, the Federal Transit Administration refers to this transit mode as "heavy rail."

Note 2: Separate data is not available in the APTA reports on the for-profit commuter bus operators serving the city of New York from New Jersey.

Wendell Cox is principal of Demographia, an international pubilc policy and demographics firm. He is a Senior Fellow of the Center for Opportunity Urbanism (US), Senior Fellow for Housing Affordability and Municipal Policy for the Frontier Centre for Public Policy (Canada), and a member of the Board of Advisors of the Center for Demographics and Policy at Chapman University (California). He is co-author of the "Demographia International Housing Affordability Survey" and author of "Demographia World Urban Areas" and "War on the Dream: How Anti-Sprawl Policy Threatens the Quality of Life." He was appointed to three terms on the Los Angeles County Transportation Commission, where he served with the leading city and county leadership as the only non-elected member. He served as a visiting professor at the Conservatoire National des Arts et Metiers, a national university in Paris.

Photo: New York City Subway diagram by CountZ at English Wikipedia, CC BY-SA 3.0

The Best Small And Medium-Size Cities For Jobs 2016

$
0
0

When we look at how the U.S. economy is performing, we usually focus on the largest metropolitan areas. But some 29% of non-farm jobs in the U.S. are in small and midsize metro areas. And since they tend to be less economically diverse and more volatile, these metro areas often are where we can more clearly see the fissures in the economy — the sectors that are growing, and which are shrinking.

In this year’s edition of our Best Cities For Jobs survey, 13 of the 20 metro areas with the fastest job growth are small (under 150,000 total nonfarm jobs) and medium-sized (between 150,000 and 450,000 total nonfarm jobs).

Many of the smaller places creating jobs at the fastest pace are located in booming regions like the Intermountain West, near college towns and in regions with attractive natural amenities. Meanwhile, times are turning tougher in West Texas and other energy-dependent areas.

The winners and losers also reflect demographic trends, notably the tsunami of downshifting boomers, that will shape our society and economy for years to come.

The Utah Superstars

As is the case with larger areas, it usually helps if a smaller region has more than one economic pillar. This is certainly true for our No. 1 city overall, St. George, Utah. The job count in this metro area has grown a remarkable 32 percent since 2010. Last year St. George’s job growth rate was 7 percent, roughly 3.5 times faster than the national rate, and one reason the area leaped 30 places in our overall rankings from last year.

Located in the scenic southwestern part of the state near the Arizona border, and a magnet for retirees and tourists, St. George has had a remarkable population boom, growing from fewer than 100,000 residents in 2000 to 155,600 people as of 2015.

This demographic surge can be seen where you would expect it, with rapid growth in construction sector jobs – up over 50 percent since 2010 — as well as leisure and hospitality, where employment expanded 37.8 percent over the same span.

Yet this is not just a sleepy retirement and tourist town. The metro area has a median age of 32, three years older than the Utah average, but well below the national average of 37.2. Despite this younger demographic, job growth has occurred in sectors that tend to employ older workers, such as manufacturing, up 40.9 percent since 2010, and professional business services, up 34.6 percent.

Not surprisingly if you want to find other local economies that reflect this kind of dynamic, the best place to look is elsewhere in the Beehive State. Our second-ranked area nationally, Provo-Orem has also achieved rapid job growth, with employment expanding 27.4 percent since 2010. Like St. George, this metro area has enjoyed strong growth in construction and hospitality, but also in higher-wage fields, including information, which has expanded employment 43.9 percent since 2010, and professional business services, up 34.3 percent.

Home to Brigham Young University, the Harvard of Mormondom, the metro area is among the youngest in the nation, largely due to large Mormon families. It’s also, according to Gallup, the most religious as well as one of the best educated: almost 40 percent of its population over 25 holds bachelor’s degrees and almost 5 percent have advanced degrees, just ahead of San Jose, Calif., and Nashville, Tenn.

Also placing highly from Utah is No. 15 Ogden-Clearfield, which rose 25 notches over last year. Employment has expanded 16.2 percent since 2010. Like St. George and Provo-Orem, this region has experienced strong expansion in its construction and hospitality sectors, but also boasts great economic diversity. Since 2010, manufacturing employment has grown 10.4 percent while professional business service jobs have expanded a healthy 31.3 percent.

The Amenity Regions

Of course, you don’t have to be a Latter Day Saint to have a successful small city. But it helps a great deal if you happen to be in a place that has standout natural and cultural amenities. This trend may be greatly enhanced by the movement of seniors, particularly affluent ones, to what may be called “amenity regions” throughout the country. Contrary to the urban mythology pressed by the mainstream media, Census data shows that seniors are not moving “back to the city” in great numbers but generally to smaller, less dense regions, if they move at all.

Being in a nice place, of course, is an asset for any city; after all, entrepreneurs and young families also like to live somewhere good times beckon. At the same time, some of these areas also benefit from a strong hospitality and second home market. Another critical advantage belongs to college towns which, by their very nature, usually offer more by way of arts, restaurants and entertainment than other places.

The highest ranked of these metro areas this year is Fayetteville-Springdale-Rogers, AR-MO, which comes in sixth on our overall list. It enjoys the benefits of being home to the University of Arkansas as well as close to the Ozark Mountains, one of the premier recreation areas in middle America. Since 2010, employment in the metro area has jumped 19.6 percent, or 40,000 jobs, with a 4.7 percent expansion last year. Like other top small cities, the areas has enjoyed strong growth in construction and hospitality jobs, up 37.2 percent since 2010, but also professional and business services, which expanded 38.2 percent over the same time period.

Some other of the fastest-growing areas metro are tourism and retirement destinations on the tech-rich West Coast. Five years ago, Napa, Calif., and Bend-Redmond, Wash., were mired toward the bottom of our ranking in 344th and 36rd place, respectively. But as the coastal tech economies have surged, so have they, rising to 13th and 14th place this year. Hospitality and construction have been the big job gainers for both, with some jobs added in professional services as well.

Losing Ground In The Oil Patch

As tech-linked areas ascend, many energy-producing towns are slipping, with oil and gas prices in the dumps and the coal industry racked by the government-guided transition to cleaner forms of power production.

West Virginia’s metropolitan areas have all suffered major declines on our list, with Wheeling dropping 54 places from last year’s survey to 396th on a 0.7 percent contraction in employment on the year. In Charleston, W.V., which has fallen to five spots from the bottom of our list, mining and natural resources employment declined 9.8 percent last year and is off 31.5 percent since 2010. Big job losses have occurred also in Wyoming, a major coal producing area, where Cheyenne dropped 82 places to 206th as mining and natural resources employment contracted 6.2 percent last year.

Many once red-hot areas in the oil patch have taken devastating hits. Former high-flyer Victoria, Texas, dropped from 24th place last year to 115th. But no place reflects the flagging fortunes of the West Texas energy economy more than Midland, which, just last year ranked first on our list; this year it’s at 139th after losing 14.7 percent of its natural resources jobs and 6.9 percent of its jobs overall. Odessa fell from third last year to 173rd this year on the back of an 8.8 percent contraction in employment, and 20.4 percent in the natural resources sector.

Several Louisiana metro areas have suffered steep job losses, including Houma-Thibodaux, down 183 places on our list to 325th after an 8 percent contraction in employment. Several smaller Oklahoma communities have taken serious hits, including Tulsa, which dropped to 222nd. Bismarck, N.D., a prime beneficiary of the Bakken oil boom, dropped 67 places from last year to 102nd as 6.8 percent of its natural resources jobs evaporated, while Bakersfield, Calif., one of the country’s largest oil producing areas dropped 70 places to 109th as natural resources employment contracted 11.5 percent.

The Rust Belt: Is The Bounce Back Over?

The picture is less uniform in the industrial sector than in energy. Some manufacturing-oriented areas are booming, such as No. 4 Gainesville, Ga., and No. 10 Columbus, Ind., home to Cummins. Nationwide manufacturing employment grew a paltry 0.3 percent last year, with some local declines that devastated the affected economies.

In the Midwest, the big losers include Midland, Mich., which dropped 75 places to 245th, Green Bay, Wisc., which fell 83 places to 286th, and Fond du Lac, Wisc., which lost 173 places to 293rd. In Pennsylvania, Scranton-Wilkes Barre-Hazelton fell 97 places to 373rd and Williamsport dropped an astounding 212 places since last year to 383rd, with manufacturing employment off 13.2 percent since 2010 and overall employment down 3.5% last year. And then there’s Johnson, Pa., in last place at 421st.

Like the energy economies, the industrially oriented metro areas are likely to stagnate for the time being as declines in global markets, the high dollar as well as lower demand from the energy sector take their toll. The International Monetary Fund predicts a modest 3.2 percent global growth rate for 2016, held down in significant part by a faltering Chinese economy. At the same time, OPEC overproduction and the addition of Iranian oil to global markets will likely keep the price below the $70-$80 per barrel range that energy producers need to start expanding energy investments again.

This means, for the time being at least, the strongest smaller cities will be those which attract people and companies from bigger places by offering better amenities, cheaper housing, better schools, growing populations and, in many cases, college campuses—all offering a better quality of life but in a smaller, usually more affordable place.

This piece first appeared at Forbes.

Joel Kotkin is executive editor of NewGeography.com. He is the Roger Hobbs Distinguished Fellow in Urban Studies at Chapman University and executive director of the Houston-based Center for Opportunity Urbanism. His newest book, The Human City: Urbanism for the rest of us, will be published in April by Agate. He is also author of The New Class ConflictThe City: A Global History, and The Next Hundred Million: America in 2050. He lives in Orange County, CA.

Michael Shires, Ph.D. is a professor at Pepperdine University School of Public Policy.

By UtahStizzle (Own work) [Public domain], via Wikimedia Commons

Murbanism (Mormon Urbanism)

$
0
0

I coined the portmanteau murbanism some years ago on a trip to Salt Lake. Mormon urbanism is shorthand for a theory I have about adaptation and resilience. The term connotes a place that has all the qualities that should result in long term failure, but will probably thrive because of the local culture. Murbanism doesn’t necessarily have to involve a single Mormon. Let me explain…
Screen Shot 2016-04-21 at 1.15.34 AM
Screen Shot 2016-04-21 at 1.43.25 AM
Screen Shot 2016-04-21 at 1.15.17 AM
Screen Shot 2016-04-21 at 1.00.34 AM
Let’s say you have two nearly identical towns. Picture typical late twentieth century auto oriented strip mall and tract home blah, blah, blah nowhere near anything. They could be physically beautiful places. They could be comfortable and affordable. They could even be prestigious and exclusive. But they’re entirely dependent on daily deliveries of refrigerated food and a steady trickle of fuel and water from some remote supply chain involving elaborate pumps and pipelines. The primary sources of revenue for these towns come in the form of pension checks, work that requires a forty five minute commute, and massive but hidden subsidies from the state and federal government.
Screen Shot 2016-04-21 at 1.42.23 AM
Screen Shot 2016-04-21 at 1.44.40 AM
Screen Shot 2016-04-21 at 1.44.15 AM
One town is populated by a motley assortment of unaffiliated residents who drifted in a few years ago from New Jersey, Iowa, California, and Illinois. They were  looking for relatively affordable houses, low taxes, and sun in winter. They’re not “joiners.” They like their privacy. The gated community and homeowners association do most of the heavy lifting in terms of public engagement. If anyone wants to be around other people they can drive to the mall.
Screen Shot 2016-04-21 at 1.46.42 AM
Screen Shot 2016-04-21 at 1.53.28 AM
The other town is predominantly Mormon and organized in a single stake. Which town is likely to hold up better over time? Which is probably better able to respond in a rational and organized fashion in a crisis? Which town can we expect to reexamine its fundamentals and thoughtfully redirect its collective energy if circumstances were to compel serious change?
Here’s another example. Which place has better keeping qualities? Israel or Dubai? Spot the difference?
Murbanism isn’t about the physical form of the town, or any of the buildings, or the town’s location. It’s about how the people who live there relate to each other and how well they can function together in good times and bad.
I’m not a Mormon. In fact I’m the opposite of a Mormon if such a thing exists. But I recognize a resilient and durable culture when I see it. I think we can all learn a great deal from the Mormon experience and adapt those lessons to our own particular circumstances.

John Sanphillippo lives in San Francisco and blogs about urbanism, adaptation, and resilience at granolashotgun.com. He's a member of the Congress for New Urbanism, films videos for faircompanies.com, and is a regular contributor to Strongtowns.org. He earns his living by buying, renovating, and renting undervalued properties in places that have good long term prospects. He is a graduate of Rutgers University.

Are Compact Cities More Affordable?

$
0
0

Housing affordability has been a tenacious and intractable urban problem for as long as stats have been kept. Several cities recently declared it a crisis. But what kind of problem is it? Opinions vary widely. An economic problem, or a social one? A land resource issue? Or, as traded wisdom would have it, the result of reliance on the wrong urban form? Proposed solutions vary accordingly. Now, new evidence rules out one potential source of unaffordable housing: clearly, it is not an urban form problem. The widely-believed theory that a city's lack of affordable housing can be fixed with increased compactness — when combined with public transit — is apparently wrong.

In a recent article we questioned a publicized correlation between a compactness index level (i.e., urban form) and housing affordability. The argument supporting compactness is that it enables the use of public transit and active mobility modes, which reduce transport expenses sufficiently to eclipse the higher cost of housing prevalent in compact districts. We challenged that assumption, and found that data from eighteen US regional metro regions showed no such effect. Even if it were at all present, it would not be sufficiently pronounced to be an effective solution. Those conclusions were based on a regional look at the problem.

While the aggregate regional data undermined the urban form theory of affordability, what do sub-regional level data show? At this finer level, could the housing-plus-transportation burden work to the advantage of households? To answer this question, we used data from 18 districts of the Metro Vancouver (BC) region. In this case, the official data exclude certain types of households — a critical limitation. But, given that such disaggregated data are rare, an effort at deciphering their meaning is warranted.

The two subject groups were Working Homeowners and Working Renters. First, we looked at whether or not the working homeowners could find accommodation that suited their income without stretching themselves thin.

Chart #1 shows the progression of housing costs in each sub-regional district, and the corresponding household median income. The in-step slopes of the two data sets suggest that working home-owning households have housing costs in tune with their earnings. This implication is further confirmed by the strong correlation (R2= 0.8598) between their income and their housing expenses.

Housing costs that are proportional with income are a positive sign, but can these homeowners actually make their mortgage payments without financial stress? The data says yes, they can. This group's average ratio of housing payments to income is 26%. It never exceeds 30%, the accepted threshold of financial strain.

Instructively, from an urban form perspective, the highest ratios occur in the central, compact district; a confirmatory finding. Equally expected are that the lowest cost-to-income ratios occur in districts furthest from the center; these districts are either suburban or exurban.

But are any of these home-owning households disadvantaged by excessive transportation costs due to their location? The data show a normal, average transportation expense of 14% of income and a range from about 8% to 20%. The ratios do increase with distance, but bear no significant correlation with income (R2= 0.0178).

When choosing the place of residence, do homeowners consider housing costs, but disregard transportation costs? If so, could this lead to an affordability problem as measured by the combined costs? Apparently not. Chart #3 graphs (blue line) this group’s cost burden for combined housing and transportation (H+T) expenses, which never exceed the recognized affordability threshold: 45% of income.

Conclusion? Metro Vancouver's 305,000 households of working homeowners with mortgages aren't experiencing financial strain due to their housing costs, no matter what their preferred housing form, location or transportation arrangements. The urban and suburban locations of the city structure fully satisfy their housing and transport needs. Neither compactness nor its absence has a negative impact on their finances.

The data paints an entirely different picture for the 224,000 working households that rent their accommodations. Their average H+T burden (Chart #3; orange line) is 51% of their median income, and it ranges from the 45% threshold of affordability to an extreme of 65%.

This picture, however, is not the result of high housing costs; rents register in the affordable range in all locations but two. The average working renter's housing cost is 26%, which mimics that of a homeowner, and the range is below the stress level of 30%, with only two outliers (out of 18 districts) at 35% and 45% of income. For renters, as is the case for homeowners, the highest housing costs occur in the more compact districts. The outliers are found in elite social cluster districts — highly desirable neighborhoods — entirely unrelated to urban form.

Given that rent costs are within the affordable range in all but two locations, we may infer that the Metro Region provides a sufficient range of housing costs for this group in its current urban/suburban structure.

These findings are reinforced by the proportionality of incomes and housing expenses for both homeowners and renters. The incomes of renter households range from 45% to 63% of homeowners by location, and their rent costs are from 45% to 65%, an almost identical range.

It would seem, then, that the excessive H+T burden renters face can be attributed partially to the transportation costs of this group. However, contrary to expectations, of the six districts that have rapid rail service (sky-train; black markers on Chart #3), not one manages to have a total burden below the affordability threshold. That even goes for the two suburban districts that offer the lowest rents.

Chart #4 clearly shows the division between the earnings of owners and renters, and the affordability threshold that separates them. The belief that a compact urban form provides a path to solving housing affordability problems appears untenable.

Overall, the data shows that for working homeowners there are no locations in the Metro Vancouver Region, whether urban, suburban or exurban, that push housing costs or the combined costs of housing and transportation above the affordability threshold. Urban form is not affecting budgets in these households.

For working renters, rents are affordable in 16 of the 18 districts, whether urban, suburban or exurban. However, when transportation costs are added to their housing costs, the new sum puts them in financial stress, even in districts served by rapid rail transit.

This sub-regional, limited analysis confirms the findings of our earlier regional look: compactness and access to transit do not produce the affordability benefits that have been claimed. The compact urban form does not equal more affordable living, particularly for the less affluent.

Fanis Grammenos heads Urban Pattern Associates (UPA), a planning consultancy. UPA researches and promotes sustainable planning practices including the implementation of the Fused Grid, a new urban network model. He is a regular columnist for the Canadian Home Builder magazine, and author of Remaking the City Street Grid: A model for urban and suburban development. Reach him at fanis.grammenos at gmail.com.

Flickr photo by Nick Kenrick: The Neighbourhood of East Van


So Much for Peak Driving (VMT)

$
0
0

So much for peak VMT. The planners and analysts who watched vehicle miles traveled (VMT) trends seemingly peak are no doubt anxious as the preliminary 2015 VMT numbers produced by the U.S. Department of Transportation showed new record total VMT well ahead of the 2007 number that many had hoped signaled peak U.S. VMT. Perhaps even more disconcerting was the sharp increase in per capita VMT, up approximately 2.6 percent for 2015. While not surpassing the prior peak per capita travel levels of the past decade of over 10,000 miles per year per person, per capita VMT nonetheless showed substantial growth during a time when the economy was far from robust. Figure 1 shows the upward sloping total and per capita VMT trends.

While individuals, perhaps someone who bought one of those 17.34 million autos sold in the U.S. 2015 (also a new record) and had a reliable vehicle to travel cross country to visit grandma, celebrate the sub $2.00 gas and the chance to travel more, others, anxious about the congestion, energy use, or emissions of more travel, may be rethinking premature obituaries for auto travel.

Source: Federal Reserve Bank of St. Louis

After exhaustive speculation, one can compile a list of causal factors for the upward spike:

  • The millennial who bought many of those new cars and the used ones they replaced must be accumulating mileage as they hunt for affordable homes in the suburbs.
  • That army of Uber drivers must be racking up the miles as their predatory rates attract bike, walk, transit, and taxi travelers to the car—say nothing of the deadhead miles between rides.
  • Amazon Prime shoppers with their quick delivery preferences are filling the roads with delivery vehicles.
  • The flood of illegal immigrants undocumented aliens, many of whom get driver licenses, must be the cause.
  • Google and the myriad of driverless vehicle developers must be tripping traffic counters as they test driverless vehicles.

Or maybe not. While current data on individual travel behavior changes is not available, even the aggregate data can shed some light on the trends. The change in VMT in rural areas increased 3.86 percent versus 3.37 percent for urban roads suggesting long distance and freight travel growth. Urban travel constitutes 69 percent of total VMT. Truck VMT data will be available later and data on VMT for commercial vehicles, public vehicles, and utility vehicles can only be guesstimated. Freight and these uses of non-household vehicles collectively constitute 24 percent of all roadway travel, hence deserve attention when interpreting trends.

The reduction in fuel price is reasonably hypothesized as a contributor to VMT growth. Historically travel elasticity to fuel cost has been estimated to be around -0.02 to -0.04 in the short term and considerably larger in the long term. The pronounced decline in fuel prices, with average 2015 prices 30 percent below the 2013 average and with current prices 47 percent below the 2013 average price, could explain part of the VMT increase. 

Another way to think about the impact of lower fuel prices is to consider that the average household has an estimated $1000-$1500 more in discretionary income annually as a result of the lower gas prices relative to 2013. Data from the National Household Travel Survey show travel goes up approximately 100 miles per capita annually per $1000 in household income for low and moderate income households (see Figure 2). Coupled with 2.5 million additional persons in the workforce and some wage growth, the VMT growth is understandable. 

Perhaps most important will be understanding how VMT will trend going forward. Many of the considerations that contributed to the slowdown in VMT growth in the early part of this century are still relevant as argued in The Case for Moderate Growth in Vehicle Miles of Travel: A Critical Juncture in U.S. Travel Behavior Trends, Center for Urban Transportation Research, University of South Florida, April 2006). The role of technology in moderating travel demand is still at work with e-commerce, distance learning, telecommuting, and improved travel logistics dampening demand. And those urban millennials may be contributing to moderated demand even if not to the extent hyped by advocates of declining VMT. But the desire to travel to pursue personal opportunity and pleasure remains potent. For a large share of the population, total travel demand is governed by resource constraints, both time and money, not a diminished desire to participate in activities – many that require travel. While few desire to commute farther and may not relish accumulating VMT for routine errands, the always present and growing interest in accumulating life experiences rather than possessions may create more VMT for personal experiences and longer distance social and recreational travel counteracting the savings from greater urbanization, communications substitution for travel, or taking advantage of alternatives to personal vehicles for daily household serving travel. 

In any case the verdict is still out. It will be interesting to watch as trends in the economy, demographics, technology, culture, values, and maybe even urban and transportation planning and investments influence future vehicle travel demand.

The opinions are those of the author—or maybe not—but are intended to provoke reflection and do not reflect the policy positions of any associated entities or clients.

This piece first appeared at Planetizen.

Dr. Polzin is the director of mobility policy research at the Center for Urban Transportation Research at the University of South Florida and is responsible for coordinating the Center's involvement in the University's educational program. Dr. Polzin carries out research in mobility analysis, public transportation, travel behavior, planning process development, and transportation decision-making. Dr. Polzin is on the editorial board of the Journal of Public Transportation and serves on several Transportation Research Board and APTA Committees. The opinions are those of the author—or maybe not—but are intended to provoke reflection and do not reflect the policy positions of any associated entities or clients.

Suburbs (Continue to) Dominate Jobs and Job Growth

$
0
0

Data released by the federal government last week provided additional evidence that the suburbs continue to dominate metropolitan area population growth and that the biggest cities are capturing less of the growth than they did at the beginning of the decade. The new 2015 municipality population estimates from the Census Bureau indicated that virtually all of the 15 fastest growing municipalities with more than 50,000 residents were suburbs, and five were in Texas (See Census Bureau poster, Figure 1). Further, in the major metropolitan areas (more than 1,000,000 population), nearly 75 percent of the population growth was in outside the historical core municipalities (the suburbs as defined by municipal jurisdiction).

But that’s only half of the story. The suburbs and exurbs also continue to dominate employment and employment growth, according to the annual County Business Patterns data. County Business Patterns is a particularly effective measure of genuine job location preferences (both employers and employees), since it largely provides data for private employment.

Analysis of the data using the City Sector Model indicates that both over the longer and shorter term, the outer reaches of US metropolitan have been more than holding their own in employment growth.

The City Sector Model

The City Sector Model classifies small areas (zip codes) of major metropolitan areas by their urban function (lifestyle). The City Sector Model includes five sectors (Figure 2). The first two are labelled as “urban core,” replicating the urban densities and travel patterns of pre-World War II US cities, although these likely fall short of densities and travel behavior changes sought by contemporary urban planning (such as Plan Bay Area). There are two suburban sectors, earlier and later. The fifth sector is the exurbs, outside the built-up urban area. The principle purpose of the City Sector Model is to categorize metropolitan neighborhoods based on their intensity of urbanization, regardless of whether they are located within or outside the boundaries of the historical core municipality (Note).

Most Jobs are Outside the Urban Core

The 2014 data indicates that more than 80 percent of employment in the nation’s major metropolitan areas is in functionally suburban or exurban areas (Figure 3). The earlier suburbs have the largest share of employment, at 44 percent. The later suburbs and exurbs combined have 37.0 percent, while the urban cores have 18.9 percent, including the 9.1 percent in the downtown areas (central business districts, or CBDs).

These numbers reveal dispersion since 2000. Then, the earlier suburbs had even more of the jobs, at 49.4 percent, 5.3 percentage points higher than in 2014. Virtually all of the lost share of jobs in the earlier suburbs was transferred to the later suburbs and exurbs, which combined grew from 31.4 percent in 2000 to 37.0 percent in 2014. The urban cores had 19.4 percent of the jobs (8.8 percent in the CBDs), slightly more than the 18.9 percent in 2014 (Figure 4).

Things have been much more stable since 2010, with a small loss in the earlier suburbs (-1.1 percentage points), a small gain in the urban core (plus 0.1 percentage points), which includes a 0.3 percentage point gain in the CBDs. The later suburbs gained 1.0 percentage points, while the exurbs held the same share as in 2010 (Figure 5).

Most Jobs Growth Since 2010 has been Outside the Urban Core

Between 2010 and 2014, more than 80 percent of the employment growth was in the suburbs and exurbs (Figure 6), approximately the same figure as their overall combined share of employment. The later suburbs have added more than their employment share since 2010 (39.7 percent compare to 24.8 percent), while the earlier suburbs and the exurbs have added a smaller percentage compared to their 2010 share of jobs (30.8 percent versus 45.2 percent and 10.6 percent versus 11.2 percent, respectively).

In the last year (2013 to 2014), the data has remained similar, with smaller changes in the same direction as before (Figure 7). The earlier suburbs experienced a small loss (0.3 percentage points), while the later suburbs gained 0.2 percentage points, the exurbs gained 0.1 percentage points and the urban cores remained constant (including no change in the CBDs).

Where the Jobs are By Urban Sector

There is substantial variation in the distribution of jobs within metropolitan areas.

Not surprisingly, the largest urban core job concentrations are in the metropolitan areas with older and larger core municipalities. Nearly 52 percent of the employment in the New York metropolitan area is in the urban core, which includes the nation’s largest central business district. Chicago, Washington, Boston and San Francisco, with the next four largest CBDs (though all small compared to New York) also rank among the 10 metropolitan areas with the greatest employment share in their urban cores (Figure 8). Only 16 of the 52 major metropolitan areas had more than 20 percent of their employment in urban cores (36 had 80 percent or more of their employment in the suburbs or exurbs).

The metropolitan areas with greater job concentration in the earlier suburbs typically experienced more of their growth in the decades immediately following World War II. Hartford has the largest share of employment in the earlier suburbs, at 81.7 percent (Figure 9). Los Angeles, perhaps the original polycentric city, ranks second, at 72.3 percent. This list also includes Rust Belt metropolitan areas that have either grown little or lost population (Detroit, Cleveland, Pittsburgh and Buffalo).

The metropolitan areas that have had the greatest recent population growth dominate in later suburban and exurban employment (Figure 10). More than 82 percent of Raleigh’s employment is in the later suburbs and exurbs. All but one of the 10 metropolitan areas with the largest job share in the later suburbs and exurbs were among the 15 fastest growing in terms of overall population between 1980 and 2010. The one exception is Grand Rapids, which ranked 27th in growth from 1980 to 2010.

Balanced Metropolitan Areas

The meme that people were moving back to the city (urban core) has been with us for decades. For just as long, there have been virtually no reality to the narrative. . The overwhelming share of the population lives and works the suburbs and exurbs. This is where both population growth continues and job growth is concentrated. One fortunate result is metropolitan areas with remarkable balances between home and employment locations, and among the shortest work trip travel times in the world.

------

Note: In some cases the functional urban core extends beyond the boundaries of the historical core municipality (such as in New York and Boston). In other cases, there is virtually no functional urban core (such as in San Jose or Phoenix). Functional urban cores accounted for 14.7 percent of the major metropolitan area population in 2012. By comparison, the jurisdictional urban cores (historical core municipalities) had 26.6 percent of the major metropolitan population, many consisting of large tracts of functional suburban development.

Wendell Cox is principal of Demographia, an international pubilc policy and demographics firm. He is a Senior Fellow of the Center for Opportunity Urbanism (US), Senior Fellow for Housing Affordability and Municipal Policy for the Frontier Centre for Public Policy (Canada), and a member of the Board of Advisors of the Center for Demographics and Policy at Chapman University (California). He is co-author of the "Demographia International Housing Affordability Survey" and author of "Demographia World Urban Areas" and "War on the Dream: How Anti-Sprawl Policy Threatens the Quality of Life." He was appointed to three terms on the Los Angeles County Transportation Commission, where he served with the leading city and county leadership as the only non-elected member. He served as a visiting professor at the Conservatoire National des Arts et Metiers, a national university in Paris.

Photograph: Suburban fringe, St. Louis (by author)

The Cost of NOT Housing: A New Report

$
0
0

This is the introduction to an new report "The Cost of NOT Housing" authored by Joel Kotkin for the National CORE Symposium on Affordability of Housing. Download the entire report (pdf) here.

It is a commonplace view that housing does not contribute to the overall fiscal and economic condition of cities. Recent trends—both nationally and here in California—suggest that this is not the case. New housing, including affordable units, provide some direct stimulation through construction jobs, but also allow people, particularly young families, to stay, work and shop locally. Lack of affordable housing ultimately drives people, particularly the entry level and young educated, out of regions where their labor would be coveted by local companies.

Some in the real estate industry, seeing ever higher prices, do not see a crisis here. Yet the current real estate “bubble” is not a durable replacement for a strong, sustainable economy. Older owners, and land speculators with a hold on scarce developable parcel, may do well under such conditions, but draining household finances for rents depresses retail sales, and makes saving for a home purchase ever more difficult.

The problems are particularly relevant to areas like the Inland Empire and the Central Valley, whose economies depend on the migration of middle and working class families seeking more affordable housing. Yet developing such houses—critical to future economic growth—has been greatly constrained by a regulatory regime that works to reduce housing growth, particularly for single family houses, in the periphery. The result has been steadily escalating rents and house prices across the state.

To meet the needs of its increasingly diverse population, and particularly the next generation, California needs to reform its regulations to more fully reflect the needs and preferences of its citizens. Once the home of the peculiarly optimistic “California Dream”, our state is in danger of becoming a place good for the wealthy and well-established but offering little to the vast majority of its citizens who wish to live affordably and comfortably in this most blessed of states.

Download the entire report (pdf) here.

Joel Kotkin is executive editor of NewGeography.com. He is the Roger Hobbs Distinguished Fellow in Urban Studies at Chapman University and executive director of the Houston-based Center for Opportunity Urbanism. His newest book, The Human City: Urbanism for the rest of us, will be published in April by Agate. He is also author of The New Class ConflictThe City: A Global History, and The Next Hundred Million: America in 2050. He lives in Orange County, CA.

Can Southland be a 'New York by the Pacific'?

$
0
0

Throughout the recession and the decidedly uneven recovery, Southern California has tended to lag behind, particularly in comparison to the Bay Area and other booming regions outside the state. Once the creator of a dispersed, multipolar urban model – “the original in the Xerox machine” as one observer suggested – this region seems to have lost confidence in itself, and its sense of direction.

In response, some people, notably Los Angeles Mayor Eric Garcetti, favor creating a future in historical reverse, marching back toward becoming a more conventional, central core and transit-dominated region – a kind of New York by the Pacific. Eastern media breathlessly envision our region transforming itself from “car-addicted, polluted and lacking in public transit” into a model of new-urbanist excellence.

Here’s a basic problem. Their L.A. of the future – the one that wins plaudits from places like GQ magazine – essentially negates the region’s traditional appeal, offering the middle and even working classes, a suburban-like lifestyle in one of the world’s great global cities.

Vive la difference

UCLA’s Michael Storper correctly notes how far the Southland has fallen behind its traditional in-state rival, the San Francisco Bay Area. Storper correctly traces much of this gap to the domination of the Los Angeles tech sector by aerospace firms and the fact that this area also had a broad base of nontech-oriented manufacturing.

Can we become a second San Francisco? Regions, like people, do not easily transform themselves into something else. For one thing, the Los Angeles area’s diverse industrial legacy tended to attract a larger share of historically poorer blacks and Hispanics than the Bay Area, whose population is 33 percent black and Hispanic. In contrast, 55 percent of the five-county Southland area’s population has either Hispanic or African American backgrounds, according to data from the 2014 American Community Survey.

Read the entire piece at The Orange County Register.

Joel Kotkin is executive editor of NewGeography.com. He is the Roger Hobbs Distinguished Fellow in Urban Studies at Chapman University and executive director of the Houston-based Center for Opportunity Urbanism. His newest book, The Human City: Urbanism for the rest of us, will be published in April by Agate. He is also author of The New Class ConflictThe City: A Global History, and The Next Hundred Million: America in 2050. He lives in Orange County, CA.

SF Vs LA: Different Strokes In Urban Development

$
0
0

Book Review: "The Rise and Fall of Urban Economies: Lessons from San Francisco and Los Angeles." Michael Storper, Thomas Kemeny, Naji P. Makarem and Taner Osman; Stanford University Press, 2015.

How and why do places differ in their pace of economic development? Why do some flourish while others lag? These are among the most profound questions in economics and related fields. Are explanations found in geography, culture, institutions, or fortune?

In "The Rise and Fall of Urban Economies: Lessons from San Francisco and Los Angeles," Michael Storper, Thomas Kemeny, Naji P. Makarem and Taner Osman consider these questions for two great cities. Storper, Kemeny, Makarem and Osman (hereafter SKMO) direct their attention to the Los Angeles and San Francisco “extended metropolitan regions” — the Census Bureau’s Consolidated Statistical Areas (CSAs) — in the post-1970 years. SKMO claim to have a plausible story about LA/SF divergence, which they do a fine job of presenting in this clearly written and well documented volume.

Both areas were established centers in high-amenity coastal California settings with similar levels of economic success in base-year 1970. But their fortunes have diverged ever since, with San Francisco taking a significant lead.

What happened?

Much of SKMO’s story springs from employment trends summarized in their table, below, which shows jobs data by major sector for their beginning and ending years for each region. Looking at employment shares, both areas had a similarly sized IT sector in 1970, but the Bay Area’s grew spectacularly while LA’s stayed about where it was. LA was specialized in aerospace and defense but, as is well known, that sector declined as the Cold War ended. Both geographic areas started almost equally in share of logistics jobs, but SF’s specialization in that sector subsided, while LA’s grew. LA’s lead in entertainment grew. Both areas lost jobs in apparel, but this hit LA harder, as the region had been more specialized in that sector.

The LA area was long recognized for its leadership in the entertainment industry, just as the San Francisco area was for its leadership in tech. Yet “Hollywood” has been emulated in many places, including India, South Korea, China, and several European countries, while Silicon Valley’s would-be emulators, though numerous, have been far less auspicious.

The post-1970s success of the SF region owes much to Silicon Valley, and SKMO note that, on average, SF’s tech sector salaries were higher than those in LA’s entertainment sector. Lots has been written about the unique culture of innovation and entrepreneurialism found in The Valley. There are real and aspiring ‘techno-hubs” practically all over the world. But the Holy Grail — to identify and bottle some kind of formula to spawn another Silicon culture — has not been discovered.

SKMO note various Silicon Valley pre-1970s events: how the electronics industry had its roots in radio hobbyists, and the 1960s convergence of hippies and techies. The authors identify eleven historical “critical turning points.” Some are private business choices (“Hollywood’s creation of a new project-based organizational structure in the 1950s and 1960s”); some are more in the realm of public policy (“Los Angeles’ Alameda Corridor Project in the 1980s and 1990s”). Others (Steve Jobs liked The Whole Earth Catalog) also make the list, but without any clear direction for today's planners.

The authors devote a chapter to what local governments in each of the two regions spent and prioritized. Bay Area government spending was greater in the 1990s, as well as in the first decade of the 2000s. While Bay Area public transit spending was much greater, SKMO admit that both areas suffer bad traffic congestion, and back away from concluding the extra Bay Area public spending had payoffs. They end up concluding that we simply do not know enough about the programs that were funded to make strong statements about how spending might have (or should have) been re-allocated among programs.

The key chapter of the book addresses what the authors call 'Beliefs and Worldviews in Economic Development': “We will see … how the Los Angeles Economic Roundtable and Chamber of Commerce generated very different narratives from those of the Bay Area Council and Joint Venture Silicon Valley... Bay Area leadership has had a more focused and time-consistent perception of its regional economy as a new knowledge economy. Greater Los Angeles leadership beliefs and worldviews have been inconsistent over time, with fleeting conceptions of the New Economy subsequently crowded out by the perception of Greater Los Angeles mainly as a gateway to international trade and logistics and specialized manufacturing.”

We have to be careful here. The sequence of events is significant: Did important policy choices pre-date the good (SF) or the bad (LA) events the authors document? The unique entrepreneurial and innovative culture bred in Silicon Valley has no discernible starting date. Did the view of Bay Area elites of a new knowledge economy lead the way, or simply acknowledge facts on the ground?

In their study of LA and SF, SKMO say little about how both areas have failed to reign in housing costs. By failing to contain the rising costs of most households’ single largest expenditure, both regions have failed. Labor markets cannot do their job when many people’s location choices are restricted. In all of their talk of the best regional development strategy, this essential one is not touched on in the study.

But, caveats aside, "The Rise and Fall of Urban Economies" is data-rich, wide-ranging and provocative. Anyone interested in the American West’s two premier cities should read this important book.

Peter Gordon is an Emeritus Professor, Price School of Public Policy at the University of Southern California. He now teaches each summer at Zhejian University in Hangzhou, China, and is currently at work on a book that explores how modern cities contribute to economic growth. He blogs at petergordonsblog.com.

Chicago Is the Duck-Billed Platypus of American Cities

$
0
0

Census results last week show Chicago as the only one of the twenty largest cities in America to lose population. The freaking out over a tiny loss isn’t really warranted. The comparison to Houston is bogus. Etc, etc. Yet Chicago’s leaders have refused to grapple with the real and severe structural and cultural challenges that face the city. That’s something they need to do if they want it to succeed over the longer term.

I wrote about this in my latest City Journal web piece, “The Duck-Billed Platypus of Cities“:

When it comes to population estimates, municipal-level data is largely irrelevant, especially when comparing cities with one another. That Houston may soon outpace Chicago in municipal population doesn’t mean that much—the city of Houston includes vast tracts of suburbia, making for an apples-to-oranges comparison. Chicago’s metro area is much larger than Houston’s and will remain the third-largest in the country for years to come. Similarly, while Chicago has the most murders in America, its murder rate is lower than other major cities like St. Louis, Baltimore, and Detroit. Comparisons with Detroit, with its hollowed-out economy, particularly infuriate Chicagoans, who reside in what remains a major economic center. And Detroit’s population loss far exceeds Chicago’s.

But just because Chicago shouldn’t be compared to Detroit doesn’t mean that it should be compared with San Francisco.

Click through to read the whole thing.

Aaron M. Renn is a senior fellow at the Manhattan Institute, a contributing editor of City Journal, and an economic development columnist for Governing magazine. He focuses on ways to help America’s cities thrive in an ever more complex, competitive, globalized, and diverse twenty-first century. During Renn’s 15-year career in management and technology consulting, he was a partner at Accenture and held several technology strategy roles and directed multimillion-dollar global technology implementations. He has contributed to The Guardian, Forbes.com, and numerous other publications. Renn holds a B.S. from Indiana University, where he coauthored an early social-networking platform in 1991.

Chicago photo by Bigstock.

A 'Diet' to Give California Drivers Indigestion

$
0
0

In the past, it was other people’s governments that would seek to make your life more difficult. But increasingly in California, the most effective war being waged is one the state has aimed at ourselves.

The Jerry Brown administration’s obsession with becoming a global model for reducing greenhouse gases is leading to an unprecedented drive to completely reshape how Californians live. Rather than focus on more pragmatic, affordable steps to reduce greenhouse gases – more efficient cars, rooftop solar systems and promoting home-based work – the goal increasingly seems like social engineering designed to force Californians to adopt the high-density, transit-oriented future preferred by Brown’s green priesthood.

The newest outrage comes from the Governor’s Office of Planning and Research in the form of a proposed “road diet.” This would essentially halt attempts to expand or improve our roads, even when improvements have been approved by voters. This strategy can only make life worse for most Californians, since nearly 85 percent of us use a car to get to work. This in a state that already has among the worst-maintained roads in the country, with two-thirds of them in poor or mediocre condition.

The OPR move reflects the increasingly self-righteous extremism animating the former Jesuit’s underlings. Ironically, the governor’s proposals to impose this road diet rest partly on expanding the California Environmental Quality Act, which Brown, in a more insightful moment, described as a “vampire” that needs a “stake through the heart.” Now, instead, the inquisitors seize on vague legislative language and push it to what the Southern California Leadership Council has dubbed “an undesirable and unmanageable extreme.”

In essence, the notion animating the “road diet” is to make congestion so terrible that people will be forced out of their cars and onto transit. It’s not planning for how to make the ways people live today more sustainable. It has, in fact, more in common with Soviet-style social engineering, which was based similarly on a particular notion of “science” and progressive values.

Read the entire piece at The Orange County Register.

Joel Kotkin is executive editor of NewGeography.com. He is the Roger Hobbs Distinguished Fellow in Urban Studies at Chapman University and executive director of the Houston-based Center for Opportunity Urbanism. His newest book, The Human City: Urbanism for the rest of us, will be published in April by Agate. He is also author of The New Class ConflictThe City: A Global History, and The Next Hundred Million: America in 2050. He lives in Orange County, CA.


Extending the Reach of Smart Cities

$
0
0

What distinguishes a ‘smart city’ from one that merely possesses smart technology? At the basic level, ‘smart’ implies a threshold level of technology uptake. Cities with fast internet, straddling buses, and driverless police cars could be considered smart. However, if technology is the only prerequisite, smart is neither revolutionary nor interesting. It is time to move towards a more enlightened understanding of what makes a city smart.

Most smart city definitions fail to articulate how disparate technologies mutually support goals beyond efficiency. If policies are holistic and integrated, technologies should be as well. Integration is not the final objective, though: it represents only the starting point for developing broader strategies to equitably distribute technology benefits and raise living standards. As such, the fundamental question for planners and policymakers is not how to optimize components of the system, but how to ensure that the overall system delivers on the promise of its potential.

In 2014, I introduced what I called a constraint theory of governance. Based on the concept of throughput optimization in the field of operations management, constraint theory posits that efforts to maximize the speed or capacity of individual production stages do little to improve the speed of systemic throughput. This is more colloquially known as the weak-link phenomenon. The concept describes a common management folly that prioritizes efficiency at one stage of production while inventories accumulate at other stages and overall progress stagnates.

So it is with governance. The improvement of a single policy stage (e.g. consultation, design, or implementation) is fully realized only when other stages are proportionately reformed. In an interlinked policy system, achieving complementarity among stages is crucial for improving throughput – as measured by the delivery speed and durability of policy initiatives. More broadly, according to the constraint theory of governance, reforms applied across rather than within functional areas are the only means to generate transformative progress in outcomes.

The constraint theory of governance applies also to smart city systems, in which output is neither a product, as in business, nor a policy, as in governance. Rather, outputs can be seen more broadly as outcomes defined by political, social, and economic progress. Technology is only one component of this complex system; it is the butter, not the bread. Operating within the broader context of a dynamic society and body politic, the power of smart city technology is dependent on strategic and functional integration of urban systems. In other words, technology is only as effective as the governance priorities and capabilities underlying it.

Seemingly disparate technological capabilities can become increasingly interdependent over time. According to the late scientist John Henry Holland, complex adaptive systems are characterized by the presence of components that learn through interaction. This is a useful metaphor for the potential of smart city systems. While much focus has been given to individual components, technological convergence requires a systems perspective. Benefitting from both network growth and scientific progress, smart city systems can shape the collective capabilities of once silo-bound technologies into a continuously evolving whole. This self-correcting mechanism is valuable in environments where policy and planning systems are encumbered by persistent bugbears like political patronage and ideological territoriality.

In smart cities, order is needed for planners to channel technological capabilities productively, while chaos provides a dynamic and flexible space for business and social innovation to 'breathe.' The sterile and the organic exist in paradoxical equilibrium. However, even politically progressive cities are sometimes unable to hold this balance, as in the recent controversy about rideshare services Uber and Lyft in Austin, Texas. Such cases are evidence that deeper thinking is needed about how to anticipate and manage the disruptive effects of smart city systems.

Appreciating the complex and paradoxical dimensions of smart cities can help improve human welfare, particularly when leaders and citizens look beyond efficiency. Rather than optimizing discrete goals, the new architecture of smart cities should be oriented towards broader social and political outcomes. Planner and academic Murtaza H. Baxamusa recently stated, “To be effective, urban planning needs to dig deeper than obscure code, pretty pictures and jumbling data. It needs to make a difference in the lives of all people.”

Smart cities have focused long enough on finding cool ways to do the same old things. Lest they be relegated to the garbage heap of worthless miracles, new generations of urban technologies can earn their keep with lower costs, faster delivery, and improved services, all indicators of efficiency. However, as I recently wrote, “All that computes is not progress.” While technology improves certain aspects of business and governance, its broader potential should not be undersold. The new 'smart' implies extension of opportunities to the disadvantaged, broadening of political participation, and enabling of social forces to shape urban space for the greater good.

Kris Hartley (www.krishartley.com) is a Visiting Research Fellow at the University of the Philippines Diliman, and a PhD candidate at the National University of Singapore, Lee Kuan Yew School of Public Policy.

Flickr photo by Nicolas Nova: Smart City Infrastructure

Trump's Industrial Belt Appeal

$
0
0

In his still improbable path to the White House, Donald Trump has an opening, right through the middle of the country. From the Appalachians to the Rockies, much of the American heartland is experiencing a steady decline in its fortunes, with growing fears about its prospects in a Democratic-dominated future. This could prove the road to victory for Trump.

The media  like to explain Trump’s appeal by focusing on the racial and nationalistic sentiments of his primarily white supporters in places like the Midwest and in small towns. Perhaps more determinative are the mounting economic challenges facing voters in that part of the country. Much of this has to do with an industrial structure facing growing challenges from a high dollar, decreasing commodity prices and a pending tsunami of environmental regulation.

Unlike the Democrats’ coastal strongholds, which depend increasingly on such professions as media, software, finance, and high-end business services, the middle swath of the country depends far more on manufacturing, resource extraction, and agriculture. All these so-called “tangible” industries are facing serious declines, which in a close election could swing some critical states such as Ohio, Colorado, Wisconsin, Indiana, Michigan, and Iowa into the Republican column. Seven of the 10 most manufacturing-dependent metro areas in America are in the Midwest battleground states. Another lies in yet another purple state, North Carolina. 

Economic Slowdown in Mid-America

When President Obama ran for re-election in 2012, the tangible economy was on a roll. Super-charged by the federal bailout, the car industry was roaring back, restoring jobs and confidence in the country’s midsection. The president was even described by The Washington Post as a “man on a mission” to save American manufacturing. And the two states then with the fastest declines in unemployment since the onset of the Great Recession—Ohio and Michigan—are in the Midwest.

At the same time, Obama benefited from the resurgence of domestic oil and gas production that   stimulated growth in steel, heavy equipment, and industrial sector employment. This fortunate confluence was fortuitous for the Democrats, who carried most of the states outside the South buoyed by this nascent industrial rebirth. Good times in coal country helped the president in parts of Virginia; the energy boom helped lock up Colorado for him.

Hillary Clinton likely will not enjoy a similar tailwind this year. Manufacturing indexes have tended downward over the past year, and the energy sector has been in full-scale retreat. This not only impacts oil patch bastions Texas, Louisiana, and Oklahoma, which are unlikely to vote Democratic anyway, but also the battlegrounds states Pennsylvania and Ohio. Agricultural economies in the midsection are also reeling.

Clinton will argue that job growth is on the rise nearly everywhere, but more than half of the increase has come in low-wage sectors such as retail and food service, which is one key reason  for persistently weak income growth.

The damage is not yet universal, but can be seen clearly in many areas. Many Rust Belt and Appalachian regions are once again hemorrhaging residents. In a recent survey of metropolitan economies for Forbes, economist Michael Shires and I traced the job growth in communities across the country. The bottom 10 among the 70 largest metropolitan areas reads like a stroll down Rust Belt Lane: Hartford, Conn., Milwaukee, Detroit, Albany, N.Y., Newport News, Va., Birmingham, Ala., Cleveland, Newark, N.J., Pittsburgh, Buffalo and -- in last place -- Rochester, once one of the beacons of industrial innovation in the country and now part of New York’s upstate disaster area.

Last year, amid some decent employment growth nationally, almost all these areas suffered sub-1 percent job declines after enjoying growth rates well above that in previous years. More grievously affected are a host of smaller communities, many of them in the Midwest and industrial Northeast, several already seeing negative job growth. At the bottom of the list are places like Johnstown, Pa., and Elmira, N.Y., where the Democrats’ “hope and change” promise has failed to reverse dismal local economies.

Enter Trump 

Throughout his divisive campaign, Donald Trump has fattened up on these voters, winning by landslides in places like upstate New Yorkcentral and western Pennsylvania, the industrial suburbs of Detroit, northern Indiana and the resource-dependent parts of Colorado. In hard-hit Erie County, N.Y., home to Buffalo, Trump won two-thirds of the primary vote.

Also appealing to similar populist sentiment, Bernie Sanders has won some of the same areas, often decisively. For his part, Trump’s only serious Rust Belt setbacks occurred in Ohio (where John Kasich ran as a virtual favorite son candidate), Iowa (where evangelicals still wield outsized influence) and Minnesota, which is arguably the most post-industrial of the central states. Recent announcements by such large companies as Ford and United Technologies  to move jobs to Mexico have reinforced Trump's appeal.

Trump’s support, as Nate Silver has shown, is not comprised only of knuckle-dragging Neanderthals. On average, they earn above-average incomes and boast education levels that also exceed the national average. Some are professionals and merchants on Main Street, who acutely ride the ups and downs of the tangible economy. These voters may also be susceptible to rants about Mexican “rapists” and certainly would not favor a massive incursion of Muslim refugees. But their primary concerns are economic, not social. If they really favored regressive social policies, Ted Cruz was their man.

The trajectory of the Democratic race—as well as that of the economy—could help Trump expand his appeal to such voters. Hillary Clinton once tended to be supportive of industrial and energy development; her State Department gave tacit approval to the Keystone XL Pipeline. Now, under pressure from Bernie Sanders’ left-wing legions, she has backed away from support for this organized-labor-backed project. The divisions between the public sector unions and those in the industrial sector could boost Trump’s turnout in states where manufacturing and energy still matter.

To make matters more difficult, Clinton may be saddled at the convention with a ban on fracking. This stance warms the hearts of bicoastal enviros, but is unpopular in large parts of the nation’s heartland. Likewise, the Obama administration’s all-out assault on fossil fuels has already cost Clinton any shot at formerly Democratic-leaning West Virginia, and is likely to hurt her across  theAppalachian belt, which includes portions of Pennsylvania, North Carolina, Virginia and Ohio. Even if oil and gas prices rise, the Obama proposals for higher taxes and regulation of energy seem destined to slow any recovery in this high-paying, largely blue-collar industry.

In addition, Trump is showing unanticipated strength in several key states dependent on coal-fired electricity. He’s currently running even with Clinton in Ohio and Pennsylvania, both of which twice went for Obama. This should be enough to keep Clinton’s advisers, who are planning to deploy massive resources to these states, awake at night.      

In this respect, Clinton faces a difficult situation. Ever more dependent on her party’s post-industrial urban core, she will be hard-pressed to moderate her stance on environmental issues.  Her predecessor and her husband were able to finesse this ground by feinting toward the moderate middle in campaign years, but such ideological contortionism is getting harder to pull off.

Megabuck donors like San Francisco’s Tom Steyer are committed to forcing Clinton to embrace   progressive green orthodoxy. This will leave many mid-America workers and businesspeople feeling abandoned and, thus, potentially more receptive to Trump’s pitch. Ultimately, suggests historian Michael Lind, Trump could presage the transformation of the GOP into a middle-class populist party, with a strong Midwestern as well as Southern base, while the Democrats rest their hopes on an unlikely coalition of the coastal gentry, the hyper-educated, minorities, and the poor.

So far, the crass New York billionaire has played brilliantly on middle-American resentments, many of them well-founded. He promises repeatedly to cut a “better deal” for them. If he can convincingly make his case, Donald Trump also might yet close the most successful real estate deal of his lifetime: occupancy of the White House.

This piece originally appeared at Real Clear Politics.

Joel Kotkin is executive editor of NewGeography.com. He is the Roger Hobbs Distinguished Fellow in Urban Studies at Chapman University and executive director of the Houston-based Center for Opportunity Urbanism. His newest book, The Human City: Urbanism for the rest of us, will be published in April by Agate. He is also author of The New Class ConflictThe City: A Global History, and The Next Hundred Million: America in 2050. He lives in Orange County, CA.

Best World Cities for Traffic: Dallas-Fort Worth, Kansas City, Indianapolis and Richmond

$
0
0

The 2015 Tom Tom Traffic Index shows that Dallas-Fort Worth has the least overall congestion among world (urban areas) with more than 5,000,000 population. The Tom Tom Traffic Index for Dallas-Fort Worth is 17, which means that, on average, it takes 17 percent longer to travel in the urban area because of traffic congestion.

The Tom Tom Traffic Index rates traffic congestion in nearly 300 world cities. This article examines overall traffic congestion levels in two categories of cities, those with more than 5,000,000 population and those with between 1,000,000 and 5,000,000 population.

Over 5,000,000 Population

Tom Tom rated traffic congestion in 38 urban areas with more than 5,000,000 population. Five of the 10 least congested cities are in the United States, including five of the top seven. China placed two cities in the top 10 (Figure 1).

With its Tom Tom Traffic Index of 17, Dallas-Fort Worth was far ahead of Philadelphia and Madrid, which tied for second at 23. This gap of six points is the largest among the 38 cities except for the seven that separate number 36 Istanbul and number 37 Bangkok.

Atlanta ranked fourth, with a Traffic Index of 24, followed by Houston at 25. Suzhou achieved China’s best traffic congestion, with a Traffic Index of 26 and was tied for sixth best with Chicago. There was a three way tie for eighth.

Because of a four way tie for 10th place, the bottom 10 in traffic congestion among the more than 5 million population included 13 cities (Figure 2). The greatest traffic congestion was in Mexico City, with a Travel Index of 59. This means that a 30 minute trip can generally be expected to take 48 minutes, 18 minutes more than without congestion. Bangkok, which is often suggested as one of the most congested cities in the world, ranked second worst with a Traffic Index of 57.

Rio de Janeiro had the fifth worst traffic congestion with a Traffic Index of 47, while Moscow's legendary traffic congestion rated a 44. Los Angeles, long the most congested city in the United States, had a Traffic Index of 41, and ranked seventh worst. Chengdu in China tied Los Angeles. The eighth and ninth most congested cities were St. Petersburg, at 40 and Tianjin at 39. London and three cities in China, Beijing, Chongqing, and Hangzhou tied for 10th worst traffic, at 38.

1,000,000 to 5,000,000

Generally traffic congestion is less severe in smaller cities, all things being equal. This is illustrated among the cities with between 1 million and 5 million population (Figure 3). Three United States cities tied for the best traffic congestion, Kansas City, Indianapolis and Richmond, Virginia, each possessed  a Traffic Index of 10. Because of a four way tie for 10th place, 13 cities are included in the top 10 and only one of these 13 cities is outside the United States.

Cleveland ranks fourth, with a Traffic Index of 13, followed by St. Louis, Milwaukee, which are tied at fifth with a traffic index of 14. The conurbation (urban areas that have grown together, in this case Katowice, Gliwice and Tychy) Katowice, Poland had a Traffic Index of 14 and   Salt Lake City and Cincinnati for the seventh best traffic congestion.

The three cities tying for 10th best traffic congestion all had a Traffic Index of 15 and were Minneapolis-St. Paul, Phoenix, Detroit and Columbus.

Four other cities ranked above much larger Dallas-Fort Worth, with a Traffic Index of 16. These included Charlotte, Jacksonville, Memphis and Raleigh. Louisville tied Dallas-Fort Worth, at 17. Dallas-Fort Worth is approximately twice the population of the largest cities in the 1 million to 5 million classification, Detroit and Minneapolis-St. Paul and more than three times the population of Katowice.

Three cities were tied for the worst traffic congestion in the 1 million to 5 million category with a Traffic Index of 43, Recife and Salvador in Brazil and Bucharest in Romania. Five of the bottom ten cities were in Europe, with Dublin, one of the smaller cities having a particularly high Traffic Index 40, nearly as bad as much larger Los Angeles (Figure 4).

Overall Rankings

Confirming the ratings above, the United States had the overall best traffic conditions (Figure 5), in all three population categories (under 1 million, 1 million to 5 million and over 5 million), though South Africa tied the United States in the over 5 million category.

Progress

Every year, it seems like more cities are added to the international traffic comparisons. This year's addition of Bangkok, with its dreadful reputation for traffic was a huge step in the right direction. Bangkok, of course has bad traffic for decades, but was edged out by Mexico City. I still wonder whether the prize does not belong to Jakarta (as it did for the “start-stop” index a few years ago), and I hope that data on India's huge cities and the cities of Japan will soon be available.

Wendell Cox is principal of Demographia, an international pubilc policy and demographics firm. He is a Senior Fellow of the Center for Opportunity Urbanism (US), Senior Fellow for Housing Affordability and Municipal Policy for the Frontier Centre for Public Policy (Canada), and a member of the Board of Advisors of the Center for Demographics and Policy at Chapman University (California). He is co-author of the "Demographia International Housing Affordability Survey" and author of "Demographia World Urban Areas" and "War on the Dream: How Anti-Sprawl Policy Threatens the Quality of Life." He was appointed to three terms on the Los Angeles County Transportation Commission, where he served with the leading city and county leadership as the only non-elected member. He served as a visiting professor at the Conservatoire National des Arts et Metiers, a national university in Paris.

Photo: Bangkok: not the worst traffic congestion (photo by author)

Finally! Great New Affordable Bay Area Housing!

$
0
0

These are highly educated well paid workers at a San Francisco tech company. They’re mostly young. Some are single. Some are newly coupled. Some are married with young children. There are exceptions, but they tend to want to live in a vibrant urban neighborhood with a short commute rather than a distant suburb.


Screen Shot 2016-05-27 at 11.08.39 PM

Screen Shot 2016-05-27 at 11.07.30 PM

Screen Shot 2016-05-27 at 11.08.07 PM

Screen Shot 2016-05-27 at 10.51.05 PM

Screen Shot 2016-05-28 at 1.45.52 AM

Screen Shot 2016-05-28 at 1.46.17 AM

Screen Shot 2016-05-28 at 12.17.05 AM

Some enjoy living in a rented apartment above a trendy wine bar right on the edge of the downtown core. They can effortlessly pop down for a drink or a bite to eat with friends. When the weather is good they can ride a bicycle to work and skip the traffic congestion for a healthy commute.

Screen Shot 2016-05-28 at 1.42.07 AM

Screen Shot 2016-05-27 at 10.51.21 PM

Screen Shot 2016-05-28 at 12.01.20 AM

Screen Shot 2016-05-28 at 12.15.42 AM

Others choose to own a loft style condo above shops. They can step outside their door and immediately find good food, good company, clothes, groceries, a hairdresser… most daily needs are close at hand.

Screen Shot 2016-05-27 at 11.47.16 PM

Screen Shot 2016-05-27 at 11.49.00 PM

Screen Shot 2016-05-27 at 11.48.28 PM

Screen Shot 2016-05-27 at 11.48.44 PM

Screen Shot 2016-05-27 at 11.51.15 PM

Still others love a little detached cottage in a courtyard with shared garden space. This arrangement provides all the benefits of a traditional home on a smaller scale.

Screen Shot 2016-05-27 at 11.47.41 PM

Screen Shot 2016-05-27 at 10.58.08 PM

Screen Shot 2016-05-27 at 10.58.38 PM

Screen Shot 2016-05-27 at 10.58.24 PM

Then there are those who gravitate toward a regular stand alone single family home – of various styles, sizes, and price points.

IMG_0794 (1024x694)

Screen Shot 2016-05-27 at 10.59.59 PM

Screen Shot 2016-05-28 at 1.44.50 AM

Screen Shot 2016-05-28 at 12.06.05 AM

Screen Shot 2016-05-27 at 10.56.40 PM

Screen Shot 2016-05-27 at 10.52.34 PM

In this new development all of these options are available on a single block just a ten minute bike ride from downtown. This is exactly what San Franciscans desperately want and someone has finally figured out how to build it at a price people can afford…

Screen Shot 2016-05-28 at 12.16.10 AM

Screen Shot 2016-05-28 at 2.17.00 AM

Screen Shot 2016-05-28 at 2.21.31 AM

Screen Shot 2016-05-28 at 2.21.04 AM

Screen Shot 2016-05-28 at 2.20.38 AM

Screen Shot 2016-05-28 at 2.20.21 AM

…in Nashville. Uber, Lyft, Eventbright, and many other tech companies that began in San Francisco have all opened branch offices in Nashville. The standard offer is simple. Relocate to Tennessee, take a 30% pay cut, and enjoy a much higher quality of life with much more cash left over at the end of each month. Go ahead. Soak up the complimentary affordable home ownership.

John Sanphillippo lives in San Francisco and blogs about urbanism, adaptation, and resilience at granolashotgun.com. He's a member of the Congress for New Urbanism, films videos for faircompanies.com, and is a regular contributor to Strongtowns.org. He earns his living by buying, renovating, and renting undervalued properties in places that have good long term prospects. He is a graduate of Rutgers University.

Luxury Urban Housing, Built on a Myth, Is About to Take a Big Hit

$
0
0

From steamy Miami to the thriving cores of cities from New York, San Francisco, Houston and Chicago, swank towers, some of them pencil thin and all richly appointed. This surge in the luxury apartment construction has often been seen as validation of the purported massive shift of population, notably of the retired wealthy, to the inner cities. Indeed with the exception of a brief period right after the Great Recession, there was slightly greater growth in core cities than the suburbs and exurbs. It was said that we were in the midst of a massive “return to the city.”

Yet in reality the movement to the inner core has been much less spectacular than that. Indeed by 2014, growth once again was faster not only in traditional suburbs but also in the exurban areas that were broadly predicted to be the most doomed. At the same time, the fastest city growth, notes economist Jed Kolko, occurred largely in the most “suburbanized” cities, like Phoenix, San Antonio, and San Diego.

One major meme for the luxury developers had to do with well-off retirees—the one domestic population with the money to afford such housing. Newspapers have been crammed with anecdotal stories about this “trend.” Yet analysis of Census trends among seniors shows that the senior percentage share in both the inner core and older suburbs dropped between 2000 and 2010 while growing substantially in the newer suburbs and exurbs. The most recent data show these patterns continue. Since 2010 the senior population in core cities has risen by 621,000 while the numbers in suburbia have surged by 2.6 million.

So who’s buying them? It’s wealthy foreign nationals, largely as investments. In many cases these units are not really residences but pieds-a-terres for the world’s wealthy; in some markets, as many as 60 percent of units are not primary residences. But such sales are susceptible to changes in foreign economies. And today, many of these buyers must contend with slowing economies at home.     

Perhaps most damaging has been the decline in many countries, such as Russia, Brazil, Argentina, Canada and some countries of the Middle East, that have been hit hard by the commodity slowdown. Most critical in many markets, particularly in California, has been the economic slow-down in China, now the largest foreign investor in U.S. real estate. In some markets, like Irvine and in Bay Area suburbs, Chinese investors have accounted for upwards of 30 percent of all buyers.

Realtors in Southern California, long a favored destination for Asian investors, report a significant slowdown in investment , particularly along the coast. In some developments, roughly half the Chinese buyers paid cash, often well over $1 million per unit. This in markets where barely 10 to 20 percent of the houses are affordable to the median income family.

Perhaps nowhere in urban America better epitomizes the relationship between foreign capital and high-end real estate than Miami. From 2004 to 2008, Miami enjoyed a massive luxury housing boom, with over 20,000 new units constructed—only to see many go them vacant for years.

The last five years have seen a resurgence once again. As  fortunes were being minted, foreign money tended to end up invested in Miami’s luxury towers.

Now this dependence on foreign investment may wreak havoc. Some sources of investment, such as  Russia, are drying up as low oil prices dissipate the wealth of that country’s free-spending oligarchs, and now must cope with sanctions over the annexation of the Crimea. In 2013, Russian buyers accounted for 23 percent of Miami luxury condo buyers; in 2014 they accounted for just 7 percent.

But in Miami, the big story has been the Latin Americans. Like the Russians, the major Latin American investors have been hard hit by declining oil and other commodity prices. In 2014, luxury developer Gil Gezer thanked Brazilians, for turning around the Miami high-end condo market; now they seem to be driving the market down.  In the fourth quarter of 2015 the number of Miami Beach condo transactions declined nearly 20 percent from a year earlier, while inventory jumped by nearly a third, according to a report from appraisal firm Miller Samuel Inc. The median sales price slipped 6.6 percent. As prices drop and sales slow, more than half a dozen projects have been cancelled.

South Florida may be the ultimate mecca for luxury developers, but it’s hardly alone in facing a high-end property crash. Over the past decade, New York has been inundated with ultra-expensive high-rise real estate. The new towers have affirmed the city’s fundamental attraction to the ultra rich. In Lower Manhattan, 31 towers with over 5,000 apartments are sprouting up, with a median price for condos of $2.43 million, a 70 per cent increase since 2013. The overall Manhattan condo market has shot up “only” 54% to $1.84 million.

As in Florida, some of the problem stems from the retreat of foreign investors. Analyst Sami Karan suggests that rather than a massive demographic evidence of a “return to the city” by the ultra-rich, the luxury surge  seems to be mostly a matter of investment strategies that can change more quickly than shifting one’s long-time domicile.

Not surprising then that some developments are being stalled across Manhattan. Property Markets Group and JDS Development Group, developers of the 111 West 57th Street, a 60-unit tower have announced that the once-imminent sales launch at the 60-unit tower would be pushed back for at least a year. In other cases, once ballyhooed  conversions of office towers to condos—notably the famous “Chippendale” Sony/ATT building located at 550 Madison Avenue—have been shelved, signaling that some well-fed rats may be deserting the luxury yacht before the fall. The city faces what new analysis by the consultancy Miller Samuel could be a glutted luxury market for the next five years.

But over the past few years, no luxury market has been more over-heated than San Francisco. As occurred in the 1990s, the city’s luxury market has ridden the current tech bubble to unprecedented heights—in the process creating what may be one of the most severe real estate bubbles in the country. In the city proper, the median value of homes has skyrocketed, from $670,000 at the beginning of 2012 to $1.12 million today, a gain of more than 67 percent, according to Zillow.com.

Now there  are signs that this boom is about to slow. This stems from two factors—the inability of consumers to afford this housing and the gradual slowdown of the tech bubble. The 87 tech IPOs over the past two years are trading 80 percent below their IPO price, and not surprisingly, venture capitalists are become more wary. Many key firms—Twitter, Hewlett Packard, Yahoo—are all laying workers off.

All this suggests that, as in Miami and New York, San Francisco property owners face stagnant or even declining prices. The market could be further weakened as  tech workers and  companies head to more affordable markets  elsewhere. 

Right now the decline in the luxury market has not yet turned into a full-on crash in multi-family housing. But there are some worrisome warning signs, such as rising apartment vacancy rates. Already some markets, such as Houston, seem to be overbuilt, particulary given weakness in the area’s critical energy sector. Other urban cores  threatened by overbuilding include such disparate cities as Indianapolis, Raleigh-Durham, Denver and Atlanta. According to the consultancy firm Costar, vacancies in downtown areas are  reaching double digits in such attractive markets as Boston, Charlotte and Philadelphia.

In some areas like San Francisco and New York, a rollback of multi-family prices could be beneficial, because high prices are driving young, educated people out to other regions. Since 2010 educated millennials have been headed increasingly to more affordable regions such as Nashville, Orlando, New Orleans, Houston, Dallas-Fort Worth, Pittsburgh, and Columbus. Even Cleveland and California’s exurban Inland Empire, which still has relatively reasonable housing prices, at least by California standards, aregrowing their millennial workforces faster than places like New York or San Francisco.

Young people may also benefit as units shift  from condo to rental.  Of course, the weakening market won’t be too good for the investors, developers and landlords, many of whom embraced the “back to the city” mantra with religious zeal and now will have to confront demographic reality.

But other trends suggest that this decline may be more painful than many suspect. We may be entering a phase where we have reached  “peak urban millennials” as they head into their 30s, get  married and move  to the suburbs.  The idea that investing in the urban core, and in luxurious density, guarantees a happy result has now lapsed into mythology. It needs to be replaced with something that more accurately effects not what developers hope (or planners decree) but what people need, and can afford.

This piece originally appeared at The Daily Beast.

Joel Kotkin is executive editor of NewGeography.com. He is the Roger Hobbs Distinguished Fellow in Urban Studies at Chapman University and executive director of the Houston-based Center for Opportunity Urbanism. His newest book, The Human City: Urbanism for the rest of us, will be published in April by Agate. He is also author of The New Class ConflictThe City: A Global History, and The Next Hundred Million: America in 2050. He lives in Orange County, CA.

Wendell Cox is principal of Demographia, an international pubilc policy and demographics firm. He is a Senior Fellow of the Center for Opportunity Urbanism (US), Senior Fellow for Housing Affordability and Municipal Policy for the Frontier Centre for Public Policy (Canada), and a member of the Board of Advisors of the Center for Demographics and Policy at Chapman University (California). He is co-author of the "Demographia International Housing Affordability Survey" and author of "Demographia World Urban Areas" and "War on the Dream: How Anti-Sprawl Policy Threatens the Quality of Life." He was appointed to three terms on the Los Angeles County Transportation Commission, where he served with the leading city and county leadership as the only non-elected member. He served as a visiting professor at the Conservatoire National des Arts et Metiers, a national university in Paris.

Photo by Marc Averette (Own work) [CC BY 3.0], via Wikimedia Commons

Viewing all 3793 articles
Browse latest View live


Latest Images