Quantcast
Channel: Newgeography.com - Economic, demographic, and political commentary about places
Viewing all 3793 articles
Browse latest View live

Designing Suburbs: Beyond New Urbanism

$
0
0

This essay is part of a new report from the Center for Opportunity Urbanism called "America's Housing Crisis." The report contains several essays about the future of housing from various perspectives. Follow this link to download the full report (pdf).

It is not primarily the fault of land developers that the American suburbs are thought to be dysfunctional and mundane. The blame belongs largely to the influence of boiler-plate zoning regulations combined with design consultants who seek the most minimum criteria allowed by city regulations.

Yet for all its problems, decade after decade 80% of new home purchases are not urban, but suburban. Some (architects, planners, and university professors) suggest we should emulate the dense growth of other nations not blessed with the vast area of raw land within our country, yet most of those countries as they prosper strive to emulate our American suburbs.


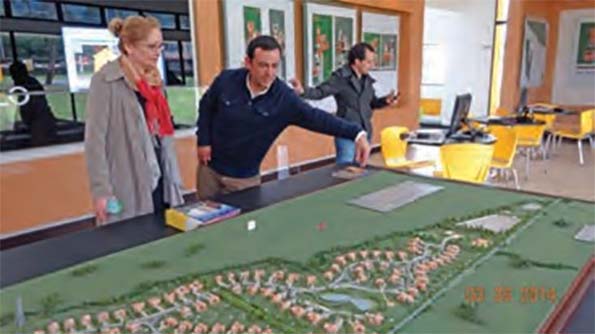
Figure 1 A model in the sales office of a new Suburban Development by AMARILO in Bogota, Colombia

The planning of our cities is about design. Yet, for the past quarter century a highly organized group consisting mostly of architects (acting as planners) have pushed a New Urbanist agenda that is as much about social engineering as it is design.

Their ’The Congress of New Urbanism’ (cnu.org) preaches of the world to come where all people of all races and incomes live in harmony along straight streets where densely compacted homes are aligned perfectly along a tight
grid. This ’New Urbanism’ is exactly how cities were designed before contemporary suburbia. In this sense they are not so much new, but as they themselves suggest “neo-traditional”.


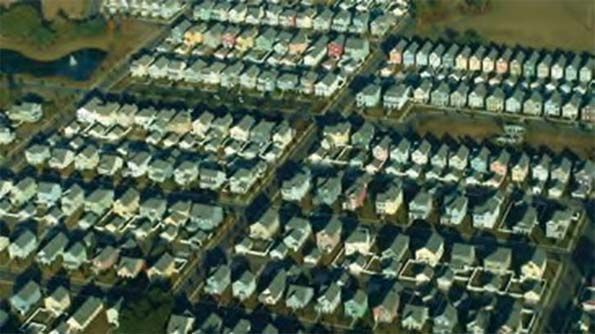
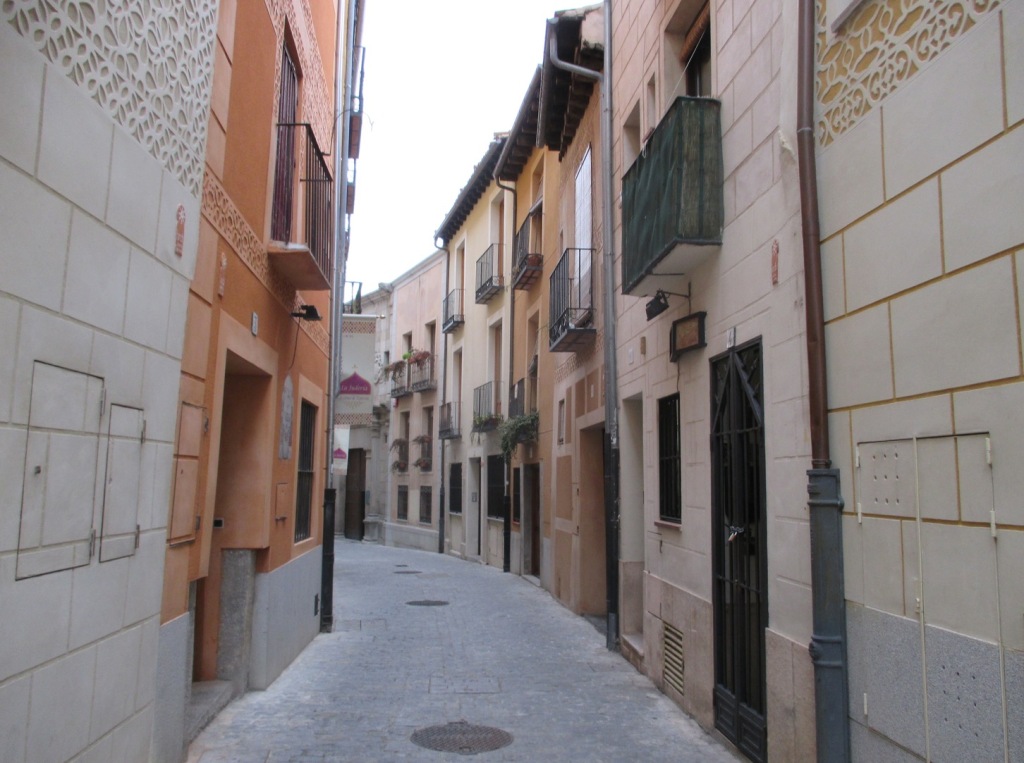
Figure 2 A new development near Charleston, South Carolina using New Urbanism Design Methods

To convince others of the evils of suburbia they present the worst suburban examples lacking proper design as emblematic of their essence. Their solution is to forever banish suburban growth by whatever means necessary—usually through regulation --- that essentially eliminates choice for the  consumer.

For most urban planning professors there appears to be just one singular solution: ever higher levels of density and a return towards the urban core. Young students study such models but, from my experience as a land planner, are grossly under-educated about what works in suburbia, where the majority of growth has been, and, short of a total political triumph of “progressive” planners or another catastrophic recession, will continue to take place.

One tragic result of this anti-suburban meme is that very little attention is played to how to improve suburban development, where design standards have stagnated since the mid-1950s. That is, until now… A new era of innovation made possible by technological advancements solves most, if not all, of the suburban growth problems, in a manner that deflates
the New Urbanist ’one solution fits all’ agenda.

DENSITY HAS NOTHING TO DO WITH DESTINY

Density is the most misunderstood and misrepresented excuse  to attack suburban growth. Density and affordability are two very different concepts.

New Urbanists argue their high density solution allows people of all incomes to live in harmony, yet finding any affordable (non-heavily subsidized) dwelling in a New Urban development is highly problematic. The CNU boasts of their gentrification which by definition means upper income.

It turns out that diversity has nothing to do with ’design’ and everything to do with people wanting to live in neighborhoods with others, like themselves. Many conventional suburbs are far more diverse in terms of class and ethnicity than new urbanist communities, or revitalized parts of  our downtowns.

Similarly, restricting how many families can be sardined into an acre of land (the definition of density)  has absolutely nothing to do with affordability—if it did the New Urban projects would be the most affordable, not the most expensive.

New Urbanists are quick to point out the sprawl of new growth, completely ignoring today’s environmental restrictions. If cities of the past were designed using today’s wetland preservation (and buffers), shoreline buffers, slope restrictions, tree preservation, open space targets, and detention ponding, they would have sprawled also. Cities built with 2015 restrictions would likely consume 1/3rd more land area than if planned using 1915 restrictions. Much of today’s sprawl is due to environmental restrictions which have counter-productive side effects—higher housing costs, less convenience, and more commute time.

Those arguing against sprawl fail to recognize that a suburban land developer’s main goal is to maximize the number of units on their site, not build the least homes. Consultants hired by the developer assume maximum profit is achieved by the greatest number of homes, thus decreasing sprawl. If a developer could increase profits by proposing a 20 story multi-family building on their suburban tract of land they would seek an approval. But this runs up against demonstrated consumer preference: suburban dwellers do not commute to be on the 18th floor of a high-rise, instead they seek the most home on the largest lot within their budget.

However, a suburban problem is that higher density too often relates  to ’cheapness’, and can result in unsustainable growth as characterless projects decrease in value over time.


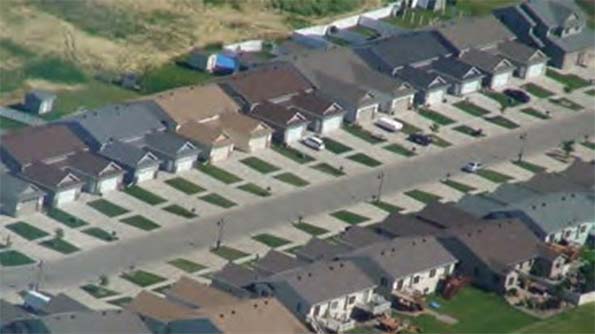
Figure3 Unfortunately suburban higher density often equates to substandard housing as this example in Fargo, North Dakota

Developers will submit site plan proposals based upon market conditions. If the market desires large lots with estate-sized homes, that is what they will pursue. If the market desires dense single family homes with no usable yard squeezed in at six per acre that’s also what they will pursue.

However, because of possible forced regulations by New Urbanist, in some instances the developer may not have a choice but to submit a proposal with excessive densities when there is no market demand.

For example, in 2014 we designed a 60 acre site in Lake Elmo, Minnesota at a mandated high density. The city was forced by court order to adhere to density mandates of the Metropolitan Council, an agency who controls both transportation and sewer service for a seven county region surrounding Minneapolis and St Paul. In order to get approvals we had to design narrower than usual single family lots including high density multi-family.

However, the developer could not secure a viable multi-family builder as the market demand favored only single family. Luckily the site was located next to a medical clinic, so a high density senior housing building was proposed and was marketable, however, the single family homes would be harder to sell with a towering building in their immediate back yard. Other developers were forced to submit hundreds of multi-family units housing without residents to buy them.

That is why the New Urbanism movement and their Smart Growth agenda is so dangerous, they lead to instances where choice in density and in some cases design standards, is no longer a developer’s option.

IDENTIFYING ACTUAL SUBURBAN PROBLEMS

In most of the country, city regulations allow various uses (Land Use) be placed within a certain defined boundary or zone (Zoning). Each ’Land Use’ will have a set of minimum setback distances between structure and lot property lines for side, front, rear yards, and minimum lot size.

The problem with suburban zoning is that it encourages placing the highest density (the most families) in the worst locations, and the lowest density (least families) in the best locations. What constitutes the worst locations? Along noisy highways, behind loading docks of strip malls, and near loud railroad tracks. Somehow this ’transition’makes sense to City Planners who advise municipalities on growth.

Prime development land would have city water and sewer as well as provide great schools. For example, a non-serviced farm has low value, but when sewer service extends to the 80 acre corn field, developers are likely to come a calling enticing the farmer with a lucrative offer. After securing the land, the very next step is to ’plan’ the project
for submittal, most likely contracted with the local civil engineering firm.

In order to secure their lucrative engineering fees, the consultant offers to design a quick layout (typically for free) using the regulations most minimal dimensions to maximize the number of homes allowed on the site for a given zoning classification.

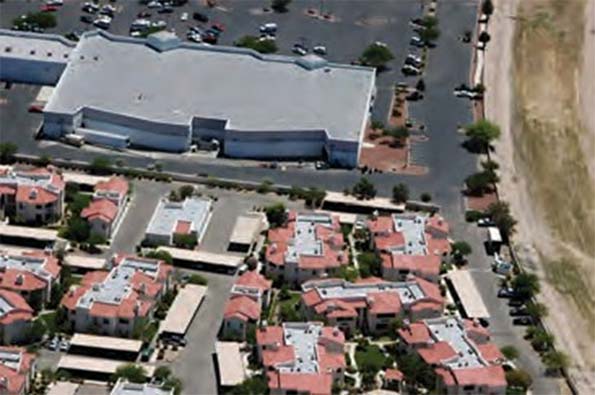
Figure 4 How ironic is it that placing  high density in the worst location (overlooking loading docks) somehow makes sense?

Quality of living, vehicular and pedestrian connectivity, curb appeal, views from within the homes, and more are rarely implemented in the above scenario. Nothing in the cities minimums-based regulations require anyone to strive above ’average’! To make this bad situation worse, the ’planner’ of that 80 acres is likely to use an automated CAD software system to produce a site plan in minutes using preset configurations guaranteeing the cookie-cutter look of suburbia, thus what is called ’land planning’ is simply reduced to basic drafting geometry lacking any design sense.

Advances in technology have improved almost every aspect of today’s living—but for land development, current software solutions have done far more harm than good.

Unanimity in ideology, and lack of innovation prevented us from addressing how to improve the places where most Americans reside.

No universities concentrate on suburban design—only dense urban design. There’s little new knowledge about how to develop for the vast majority of people. Not surprising then, that a new development being proposed in 2015 is likely to be ’planned’ worse than one designed in 1955!

Today’s generations of designers (CAD operators) lack the passion to move the land development industry forward into a new era. We desperately need a properly trained new generation of consultants and architects who focus on how to make suburbs work better, more sustainably and, not to be forgotten, make a profit for the developers.

DESIGN CANNOT PROGRESS IN A NON-COLLABORATIVE INDUSTRY

For typical suburban and urban planning, a house is envisioned as a simple rectangular footprint only. The four main professions of land development design: architecture, civil engineering, land planning, and surveying tend to fail at both communication and collaboration, even when they all work for the same company. This problem is made worse by universities that teach multiple disciplines and enforce the barriers when students graduate. You would think architectural students would participate with engineering and planning students on the same projects to learn collaboration, but that is not the case. This lack of collaboration stagnates progress in land development.

A RECIPE FOR SUSTAINABLE GROWTH

’Sustainability’; that meaningless buzzword everyone uses on their company brochures generally avoids any real definition. Solar panels and rain gardens in inefficient neighborhood site design is hardly sustainable. However, if a developer builds a more efficient neighborhood that increases living quality maintaining its value and desirability over a long life span, it’s the definition of ’sustainable’. So, given all of the problems stated above—how is it possible to achieve it?

DESIGN FOR PEOPLE FIRST

Instead of using a software package to whip out a 200 lot site plan in less than 5 minutes, the land planner must place themselves in each and every home. They must imagine themselves in that space.


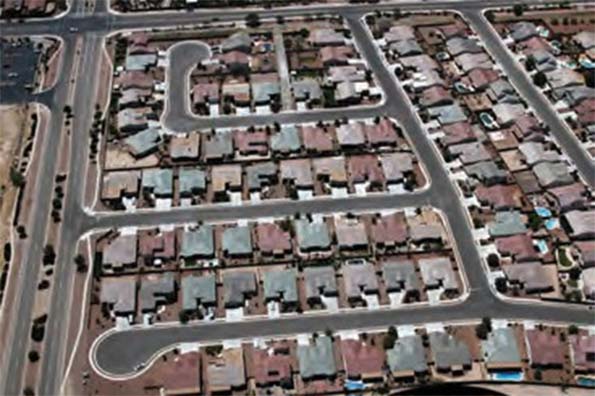
Figure5 A new suburban project near Tucson - what quality of living do these residents have - really?

The land planner must be passionate about those that will live in the neighborhoods they design and realize that their living standards, safety, and investment are strongly influenced by the planner’s efforts.

So we have to focus on very basic parts of what constitutes everyday life. What quality is the view from within the living spaces of the home? Does the street design allow a safe transit through the neighborhood maintaining traffic flow, or must the drivers contend with multiple intersections, sharp turns and pesky (trendy) roundabouts that only serve to increase both drive time and energy use? Do pedestrians cross at dangerous 4-way intersections and have only streets to walk near, or is there a dedicated pedestrian system that avoids conflicts with vehicles?

Are architectural details implemented to increase the beauty of the streetscape and to maximize the financial return for the residents? Will the neighborhood deliver a sense of pride at all income levels?

None of the above can be achieved by shoehorning in every home allowed by regulation minimums. It’s also not possible to reach those goals without a more collaborative relationship between the various consultants at initial concept design stage. No software program can automate any of the above. Professors need to teach good land planning design— not social engineering using methods of city planning from centuries ago.

THE MORE PROFITABLE SUSTAINABLE NEIGHBORHOOD

Putting people first seems like a  noble goal, but won’t all that functionality destroy the developer’s profits and make suburban growth just as risky as the New Urbanism? The key here is to realize that to achieve higher profits and greater efficiency, you don’t have to change the regulatory minimums, but actually seek to exceed them.

Consider the following: Suburban planning and New Urbanism places every home at the most minimal setback guaranteeing monotony and restricting views from within the homes. Structures are placed as close as possible to the outermost boundary of a tract for densification. Streets parallel each other in a straight or curved pattern as the design of a neighborhood begins at the perimeter and builds inwards until all land is consumed. Thus ’land planning’ is reduced to simple geometry.

Unwittingly, this scenario not only maximized how many homes fit on the site, but also maximized the length of infrastructure (street paving, sanitary and storm sewer, utilities, sidewalks, etc.). The consumption of developed land typically forces re-grading (earthwork). Earthwork costs quickly destroy profits (not to mention trees, natural waterways, and any character of the existing land).

For centuries it’s been assumed that the most minimal dimensions were the most efficient way to design. A discovery make in 1988 proved otherwise. We discovered that separating the pattern of the homes front setback line (which typically parallels the street) with a different street pattern could maintain density while significantly reducing the length of street for any given set of minimums. The discovery was unintuitive—simply provide more than the regulatory minimums and efficiency is gained—not lost!

The resulting streetscape created a park-like setting with undulating open spaces in ’coves’, thus we coined the  term for the method: Coving. This initial discovery led to scores of innovations that solve most suburban problems deflating arguments against suburbia.

We designed over 1,000 neighborhoods in at least 47 states and 18 countries contracted by over 300 land developers, those who desired to advance both suburban growth,as well as those involved in urban redevelopment.

EXAMPLES OF FUTURE SUBURBIA BEING BUILT TODAY

The following neighborhoods will help explain the benefits of the many innovations that grew out of the discovery of coving.

Example #1: The Enclave of Westpointe - New Braunfels, Texas

Below is the actual approved ’before plan’. With changes in water detention mandated by the city, there was 136 lots and 7,461 lineal feet of public street. There was 19 lots adjacent to the 7 acres of park. The typical lot was 8,000 square feet.


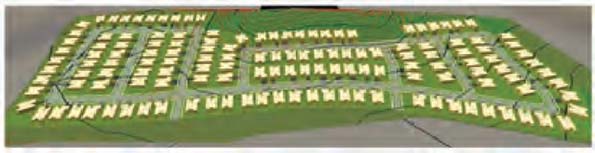
Figure 6 The original APPROVED plan for The Enclave at Westpointe

No developer or city would question the efficiency of the above design.

However, there is an enormous amount of waste in the design. Did you instantly recognize it? Neither the designer nor those at the city saw how wasteful the design is because recognizing unintentional design waste is counterintuitive and certainly not taught in planning schools.

What about travel to and from most of the homes? One of the discoveries was due to research in traffic flow. Newton’s law: A body in motion tends to stay in motion. To get that body in motion (your car) takes an enormous amount of energy to reach the 25/30 MPH typical of residential streets and each stop repeats the waste. This process of acceleration to efficient cruise and stop will consume 400
feet and take approximately 20 seconds (called a ’flow cycle’). The drawing below proves for most residents the multiple intersections they encounter destroy flow. What at first looks efficient… is not.


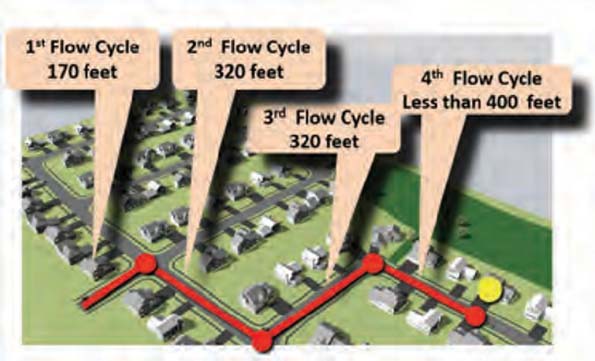
Figure7 Short runs with stops and turns destroys f low and wastes both time and energy

Still trying to see the waste? An efficient street has homes that front both sides, but on the above plan much of the street is consumed by side yard. This waste consumes available land with Right-of-Way and pavement, thus to maintain density the smallest possible lot must be designed. Now look at the reapproved redesign:


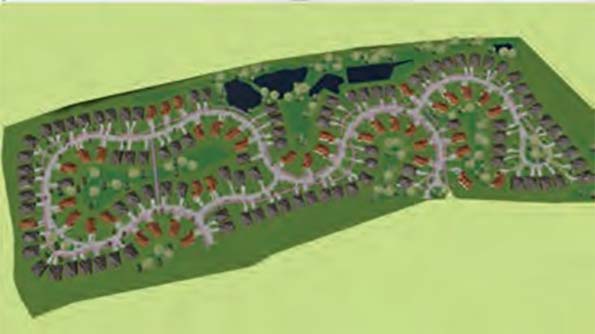
Figure8 The After Plan of The Enclave at Westpointe

The redesign has only 4,973 lineal feet of public street reducing the infrastructure by 33%, or approximately $300,000 less construction costs. The original plan had only 19 premium lots (abutting open space). The redesign has 85 lots backing into open space (all lots are more premium), resulting in $600,000 in added value. The 136 lots average 9,395 square feet (15% more than the original typical lot), and a savvy engineer would have easily reduced both storm sewer and earthwork costs. The streets ’flow’ reducing time and energy while the wide elegant meandering walks invite a stroll. The city wins with 33% less maintenance costs and a higher tax base, the developer benefits, but most importantly the people investing in living in the neighborhood and those they will eventually sell to also benefit.

Example #2: The Sutherlands - Louisiana

This site is both long and narrow, never a good combination to design a good site plan. Most land planners simply squeeze lots to the most minimal depth to maximize density:


Figure9 The original plan for submittal for The Southerlands

The above site plan has 91 lots requiring 5,200 feet of street (just short of a mile). At the time of this writing a lineal foot street infrastructure in the Lake Charles area was $600. Thus about $34,000 in infrastructure alone per lot, not including the cost of the land or site grading (earthwork). Because of the tight distances at the entrance, the previous planner decided to place the smallest lots at the entrance cheapening the image of the development at the most important spot—the front door. The above plan lacks any sense of arrival.

The discovery of coving made it possible to rework even the most difficult of sites into a better place to live as seen below in the approved new neighborhood design:


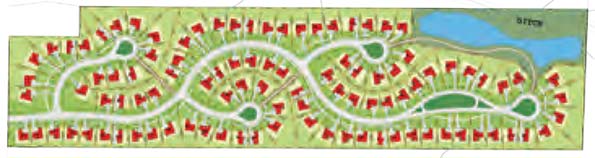
Figure 10 The resulting redesign was approved in less than 2 months!

The new redesign creates a sense of arrival which continues all the way through the back of the neighborhood. The wide walks at the end of the cul-de-sacs are designed to handle emergency vehicles providing alternate access without having to build excess streets, while also providing increased pedestrian connectivity.

The oversized cul-de-sacs contain parks in the middle and towards the end of the road is a split island that adds landscaping and park-like space. You may think that all of this would be far too expensive to build. However the length of street plummets to 3,999 feet and there was a gain of 8 lots while also eliminating the low value miniscule lots at the entrance. The length of street suggests a construction savings of $720,000 the oversized cul-de-sacs as well as the elegant street island and wide walks serving as alternate emergency access does add some costs. The increase of 8 lots goes directly to the developer’s bottom line, however, and the added tax base to the city with reduced ongoing maintenance costs is of great advantage for the municipality.


Figure 11 Beauty and space is no longer a privilege of the wealthy

The residents all live in a unique elegant estate-like setting with large yards and great views from within their homes. The park-like streetscape with the wide meandering walks and even wider trails invite a stroll.

Both examples used coving to maintain street frontage along the setback line while reducing the length of street and related infrastructure.

Coving allowed (for the first time in the history of planning neighborhoods) compliance with existing regulations by exceeding minimum expectations and reducing construction costs, all while providing more space for homes at an equal density compared to conventional land subdivision. The cost reduction for site construction allows more funds to be used in other aspects of the development such as architectural detail, insulation, windows, landscaping, and as in the case of The Sutherlands creating landscaped islands to add neighborhood character and interest.

Example #3: Sundance Village— Dickinson, North Dakota


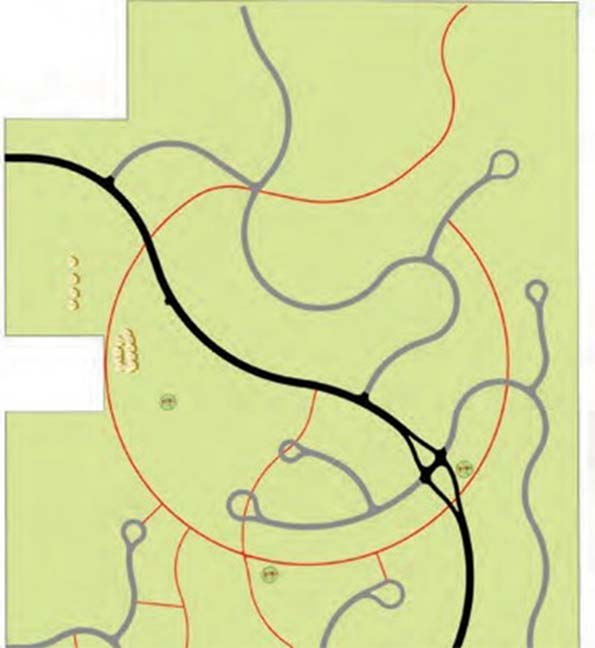
Figure 12 The 305 acre Sundance Viallge showing main circulation


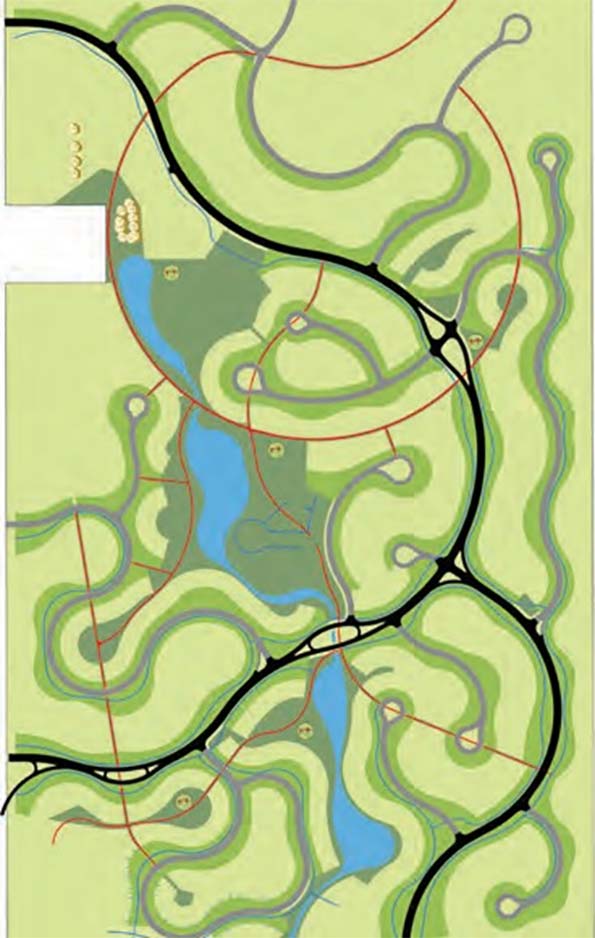
FIgure 13 Sundance Village Linear parks & cascading ponds.

This next example is of a larger community. The last two examples were small sites explaining basic premises of this new era of design on relatively flat tracts of land. The same concepts to reduce infrastructure, maintain flow, and provide pedestrian connectivity scale up and down as the available acreage changes.

Larger sites can create more function and variety as well as more opportunity. This 305 acre site will house almost 1,000 families and provide a variety of services within walking distance.

The plan above shows the main trail interconnections (red) as well as the major internal streets (black) and minor streets (grey).  The main trails cross the major streets at ’diffusers’ which provide a safer crossing while maintaining traffic flow.

Almost all residents can get home with one turn or less (terrific ’flow’).

Unlike a round-about that disrupts all traffic, a diffuser maintains flow on the higher volume street reducing time and energy, but the real advantage over the roundabout is much safer pedestrian crossing.

Most suburban cities require a percentage of the site as open space. This may be in dedicated city park or spaces exclusive to the use of the residents within the development. Each city will be different in their open space requirements. The park areas (dark green) in this particular neighborhood follow the contours of the land. The north part (upper part of the map) is on top of a hill allowing sledding (this is North Dakota!) or kite flying, and the remaining parkland follows a cascading ponding system along lower elevations. Both the trail system and drainage lead to a retail center at the southwest corner of the land (lower left). This method of design embraces the terrain and reduces storm sewer costs by embracing natural drainage flow.

To solve the problems of exclusion caused by the typical suburban transitional zoning we simply reverse the transition.


Figure 14 Reversing zoning transition makes housing inclusionary—not exclusionary. White is Single Family, Orange is Duplex.

Instead of having the highest density at neighborhood entrances, we place the lowest density and best housing at the front door. Disney’s Celebration, a New Urban design, does the same thing. As
price points lower, those residents drive through higher priced housing creating a sense of arrival without cheapening the feel of the development or image of the city it’s located within. Single Family (white) large lots are along the main streets with smaller single family or duplex (orange) lots in pockets behind the single family. The main trails lead to a church (yellow), senior housing (pink), and retail (green). A school (not shown) is across the street from the church.

Wide meandering walks add that special touch of elegance along the street and provide added sense of scale to the undulating open space adjacent to homes.


Figure 15 Sundance Village: Creating a sense of arrival is very important

Example #4: Rivers Edge— Sugar, Utah

There is a good reason why, now, we can enter a new age of more sustainable growth. Just 40 years ago a single property intersection of a lot line with a curved street would require a half hour of tedious geometric calculations, encouraging the simpler designs of the past. Today, automated software can produce a 1,000 lot development in the

same time span! Both suburban and New Urban design does not consider the living experiences within a home as tied to surrounding open spaces (if any).

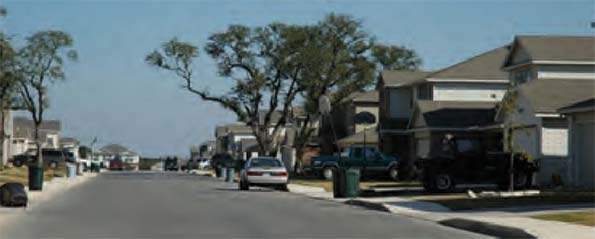
Figure 16 A San Antonio project by a National home builder—no attention to how the floor plan merges with open spaces..

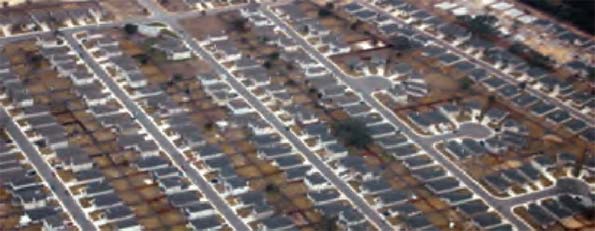
Figure 17 Same project as the above picture—but in aerial view. Where was ’passion’ in this land plan design?

Instead of using software to produce a faster cookie-cutter plan, we can harness (and develop) technology to produce better neighborhoods. Technology makes it possible to discover better design models. New models provided the basis to create new forms of software and training. Both developers and cities have the opportunity to build better neighborhoods—if they are passionate about building better communities to invest the time and effort.


Figure 18 This neighborhood in Orno, Minnesota uses the ’BayHome’ design method merging interior and exterior spaces.

This next example demonstrates the evolution of planning which merges both site design and architecture, providing a significant market edge above competing home builders. This evolution allows neighborhoods to be designed to a much higher level of detail increasing efficiency, function, value, and livability.

In 1999 Professional Builder Magazine called the BayHome method of design ’New Urbanism with a View’. It was the first time (ever) in planning, that the floor plan became a major component of the neighborhood design. This meant that communication and collaboration between all consultants (planning, architecture, engineering, and surveying) became critical at the initial design stages (also revolutionary).


Figure 19 BayHome: living space expands to adjacent open spaces and scenic views, merging planning and architecture

With just a handful of floor plan options, placing homes in a staggered relationship allows significant views both front (porch side) and side of every home. The staggering eliminates the ’alley’ look of a rear serviced home while providing space for two and three car garages.

BayHomes hide parked cars and garage doors, improving the look of the street and the neighborhoods.  However, they are alternatives to attached housing such as townhomes and duplex units because the yards are common as well as the maintenance of them. To achieve this design they are platted as townhomes, not traditional single family lots along a public street.

This example, Rivers Edge is typical of how BayHomes are utilized on typical suburban neighborhoods. Like normal single family homes, there are very little economic barriers serving low and high income families.


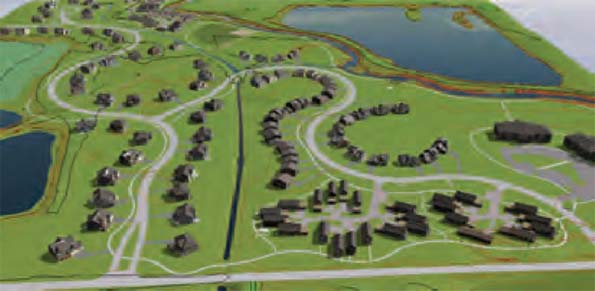
Figure 20 Rivers Edge in Sugar, Utah uses BayHomes along the arterial street (lower right) and along the river (rear of the site).

The success of BayHomes with their attention to detail allowing expanded views influenced us to wonder: Why not have this attention to detail on every home?


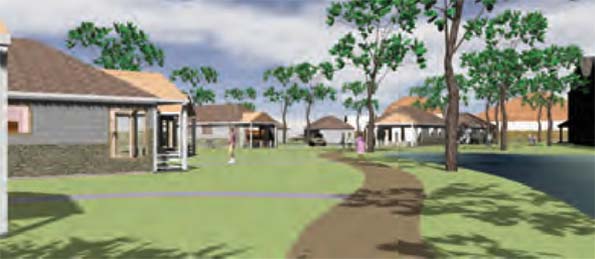
Figure 21 The Fellowship Church redevelopment in Detroit shows low income ADA BayHomes to house disabled Veterans.

Example #5: Viera—Melbourne area, Florida

Viera in Melbourne, Florida takes land development design to a much higher level.


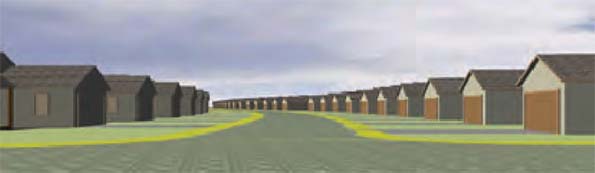
Figure 22 The original Viera architecture placed along the 35’ wide lots of the ’before’ plan would have appeared as above

Not only does Viera harness all of the above methods of design, it also incorporates the coordination of architecture to lot shape, eliminating the largest problem in high density, narrow, single family lots (suburban and New Urban): reduced curb appeal and views. By coordinating both architectural design and creating a consistent angle between interior and exterior ’coved’ lots, the home can be widened at the front or rear:


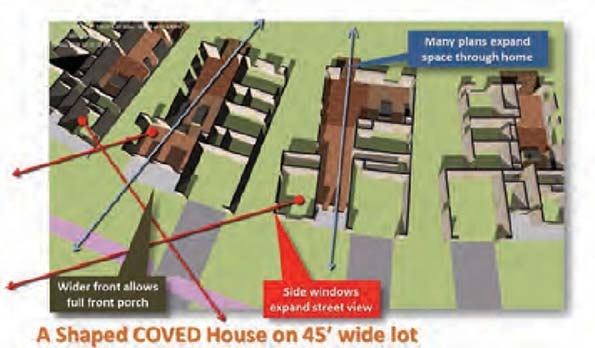
Figure 23 A narrow home no longer has limited floor plan options nor the garage dominant streetscape using ’shaping’

What makes Viera unique and revolutionary, is that both developer and builder decided to throw out all the existing rectangular floor plans and make every home have the benefit of home-to-lot shaping! The resulting neighborhood when it is built by mid-2015 will certainly challenge competing homes being built at similar densities.


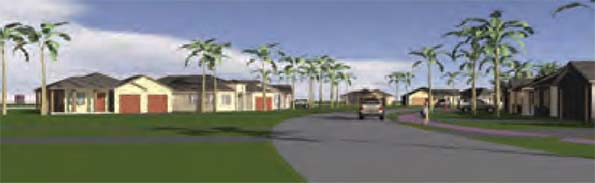
Figure 24 Viera Homes on the same 35’ wide minimum width as the before plan (similar density) as shown on Fig. 22!

Viera clearly demonstrates the advantages of advancements in home and land development design made possible when the consultants collaborate to take the extra effort and attention to detail needed to create sustainable suburban neighborhoods that will rival the New Urbanism, without waging war on suburbia per se.


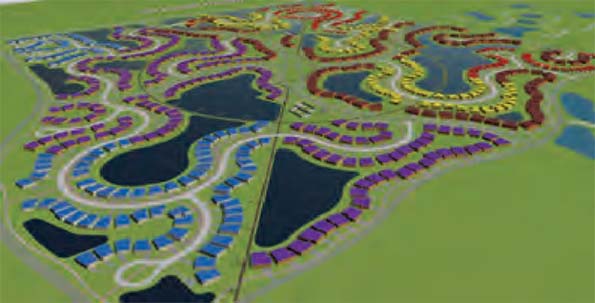
Figure 25 Viera was the first development of many since that takes form and function to the next level.

From an economic and environmental perspective, Viera demonstrated a 38% reduction of infrastructure compared to the before  plan (loosely based on New Urban design).

CONCLUSION

If land developers stopped contracting (paying) engineering consultants for mundane plat geometry to regulatory minimums and demanded better, change would be immediate. If universities taught design and collaboration instead of social engineering, we would have hope for a better future, both suburban and urban. If consultants imagined themselves living in the neighborhoods they design, we would have change. Complacency—not the idea of suburbia—is the primary cause of unsustainable growth. Suburban developers today must rediscover of the innovation that characterized the first wave of builders, who created, however imperfectly, an unprecedented wave of property ownership and privacy. Our challenge now is not to reject suburbia but to look for something that goes beyond replicating tradition, but actually improves how we live and interact with the natural world, and each other.

This essay is part of a new report from the Center for Opportunity Urbanism called "America's Housing Crisis." The report contains several essays about the future of housing from various perspectives. Follow this link to download the full report (pdf).

Rick Harrison is President of Rick Harrison Site Design Studio and Neighborhood Innovations, LLC. He is author of Prefurbia: Reinventing The Suburbs From Disdainable To Sustainable and creator of Performance Planning System. His websites are rhsdplanning.com and performanceplanningsystem.com.


The Effect Race Could Have on the Race

$
0
0

Until now, the presidential campaign largely has been dominated by issues of class, driving the improbable rise of both Donald Trump and Bernie Sanders. But as we head toward Super Tuesday – which will focus largely on Southern states – racial issues may assume greater importance.

In the next few weeks, you can pick your states and likely party primary winners largely by examining the ethnic profiles of the electorate. Where white voters predominate, the most radical candidate, Sanders, ironically, does best. In contrast, states that are more heavily minority favor the more mainstream Hillary Clinton. In some states, notably Texas and Florida, larger minority representation may slow Trump’s seemingly unstoppable momentum.

What about age? Older voters are overwhelmingly white, and in states where they constitute a large share of the electorate – a full one-third of GOP caucus-goers in Nevada – the Donald is the bomb. Hillary, too, has done best with older voters, while Sanders dominates the party’s younger electorate.

Racial gap in Democratic Party

Racial divisions will shape the Democratic results Super Tuesday. The party’s Southern flank, weak in November but important now, tends to be dominated by African Americans and, in Texas, at least, also Latinos. In some states, like South Carolina, where African Americans constitute upward of a majority, Clinton has proven all but unbeatable.

In contrast, Clinton did poorly in New Hampshire (94 percent white) and barely earned a tie in Iowa (92 percent white). Generally speaking, the whiter the state, the better things tend to appear for Sanders.

Read the entire piece at The Orange County Register.

Joel Kotkin is executive editor of NewGeography.com. He is the Roger Hobbs Distinguished Fellow in Urban Studies at Chapman University and executive director of the Houston-based Center for Opportunity Urbanism. His newest book, The Human City: Urbanism for the rest of us, will be published in April by Agate. He is also author of The New Class ConflictThe City: A Global History, and The Next Hundred Million: America in 2050. He lives in Orange County, CA.

Bernie Sanders photo by Michael Vadon (Own work) [CC BY-SA 4.0], via Wikimedia Commons

A Truly Historic Super Tuesday

$
0
0

This year’s Super Tuesday primaries will give both parties a chance to decide which of their candidates offers the best policy prescriptions to address the nation’s challenges.  Surprisingly for a campaign that is supposedly focused on America’s future, many of the ideas being proposed echo proposals from America’s past.  It’s almost as if the ghosts of not just Ronald Reagan, but Huey Long, William Jennings Bryan, and Norman Thomas have come back to haunt us, making this one of the scariest presidential campaign seasons in recent memory.

For GOP, it’s Reincarnation of Long vs.  Descendant of Bryan vs. Children of Reagan

Donald Trump is basking in the popularity of his ideas on how to improve the economic and social standing of America’s beleaguered middle and working classes. He hasn’t offered many specific proposals on how to do that but, unlike his Republican opponents, he doesn’t reject big government solutions, such as preserving Medicare and exercising the right of eminent domain, out of hand. In the 1930s, Huey Long’s populist “Share our Wealth” campaign promised to give away government money to poor people. Overseas, European dictators of that era proposed what they called “National Socialism” or “Fascism,” which made scapegoats of certain portions of their country’s population while promising economic benefits to the rest of the population. Underlying all of these movements was a promise to make their particular country—Germany, Italy, Spain, even Argentina, as captured in the musical Evita—in Donald Trump’s words, “great again.”

Huey Long was assassinated in 1935 before he could launch his national campaign against FDR’s New Deal, but no one at the time doubted the power of his ideas to generate support from an economically struggling and culturally-alienated demographic. By pitting the interests of working class, less educated voters against those in the establishment, while calling for the expulsion of those who he and many others blame or the country’s economic ills, Trump has managed to gain the enthusiastic and boisterous support of a slice of the electorate--white voters with less than a college education---that is in the final stages of its long slow journey from being the backbone of FDR’s coalition to becoming a critical part of the Republican party’s base.   

Ted Cruz on the other hand is offering a “true conservative” civic ethos that harkens back to previous Republican party platforms--starting in the 1890s with William McKinley and continuing all the way through Herbert Hoover’s disastrous 1932 campaign.  What Senator Cruz has added to this position of minimal federal economic involvement is a religiously-driven, doctrinaire approach to social issues. Cruz’s unrelenting hostility to non-believers of various types is reminiscent of the attitudes that Williams Jennings Bryan brought to his three political defeats as the Democratic candidate in 1896, 1900 and 1908 and to his Bible-based defense in the 1920s of a law forbidding the teaching of Darwin’s Theory of Evolution in Tennessee public schools.

The establishment wing’s candidates—Marco Rubio and John Kasich—are proposing the country go back only as far as the Reagan-era formula of reducing the economic role of government, while give lip service to the concerns of the aggrieved, but fading, religious right.    Rubio calling his followers “children of the Reagan revolution”   at least reflects nostalgia for the late 20th Century rather than Trump’s stumping for the neo30s or Cruz’s bridge to the religious passions of the 17th Century. Both of them, to their credit, have also tried to adopt the sunnier tone of the former President in their rhetoric in a year when fear, uncertainty and doubt permeate the media.  Governor Kasich has gone so far as to follow Reagan’s 11th commandment that thou shall not speak ill of other Republicans in a year when personal insults seem to be the ticket to stardom.

We will have a good idea after Super Tuesday which of these candidates are likely to be the party’s nominee and whose approach to the role of the federal government in today’s society will become the centerpiece of the Republican Party’s platform this year. Whether any of these somewhat old ideas will resonate with a 21st Century electorate, however, remains to be determined in November. 

In the Democrat’s Debate, it’s the Ghost of Norman Thomas vs. a Replica of President Obama

Bernie Sanders has suggested on more than one occasion that his campaign’s economic and political message is a throwback to FDR’s New Deal.  What he fails to mention is that his democratic socialist ideas were explicitly rejected by the American public in both 1932 and 1936, even in the midst of a Great Depression, when the GI Generation overwhelmingly supported FDR and not Norman Thomas, the Socialist Party’s nominee. Still, after the Great Recession and the illegal behavior of Wall Street firms and their leaders, it is not hard to understand why Sanders’ call for a “political revolution” to put the government in charge of ensuring economic equality finds such enthusiastic support from Millennials, a generation that is coming into its own political power eighty years after the last previous civic-oriented generation, the GI Generation, which restrained the economic oligarchs of its day.

By contrast, Hillary Clinton is explicitly campaigning on the need to “build upon,” and thereby ratify, the new civic ethos that President Obama has introduced into the country’s political debate. Rejecting Sanders’ premise that all of America’s problems are rooted in economics, she has taken a less sexy, but thoroughly modern pragmatic approach, reminiscent of her husband and President  Obama -- but without the soaring rhetoric and charisma.

For example, by attacking Sanders’ proposal for “Medicare for all” in favor of continuing to make progress on universal health care through the framework of the Affordable Care Act (ObamaCare), she also directly addresses Obama’s vision of a new role for the federal government. In this 21st Century approach to the relationship between the government and its citizens, the federal government uses the power of taxation granted to it in the original Constitution to compel individual behavior, e.g. buying health insurance, but individuals have the responsibility to undertake such activities, preferably with the aid of their state government.

In our country’s past, each time the debate over the relationship between citizens and their government has reached fever pitch, visionary leaders have come forward to persuade the populace that revolution was not the answer. The Founding Fathers convinced the rest of the country in the wisdom of their Constitutional formulation after about a decade of debate. Lincoln could not convince the entire country of his vision of equal rights without a war, but his ideas ultimately prevailed. FDR’s political skills enabled him to lead the country away from its economic fears to a new conception of how government could provide for “the common man.” Each in his own way, and in the context of their times, found a way to preserve the unique nature of our American democracy.

Washington, Lincoln and FDR articulated a new conception of America’s exceptional ability to reconcile its eternally conflicting desires for both individual liberty and collective action in ways that won them the enduring appreciation of a nation and the praise of presidential historians. This year’s crop of candidates ---including the likely winner Secretary Clinton --- has yet to offer such a grand vision or earn such affection. Instead, the campaign has seemed to be more like a series of clowns jumping out of a jack-in-the-box, shouting slogans from America’s past, just to frighten us. But, in a year filled with political unpredictability, perhaps one of the candidates will surprise us one more time and demonstrate the ability to persuade the country to endorse his or her vision of how to organize ourselves in the 21st century in ways that preserve our American democracy for decades to come.

Morley Winograd is co-author of the newly published Millennial Momentum: How a New Generation is Remaking America and Millennial Makeover: MySpace, YouTube, and the Future of American Politics and fellow of NDN and the New Policy Institute.

Photo by Gage Skidmore [CC BY-SA 3.0], via Wikimedia Commons

Super Tuesday Analysis: How Race, Class And Geography Fed Trump And Clinton's Victories

$
0
0

After Tuesday night’s primary results, the presidential race is now all but settled among Democrats, and the fractured Republican field seems far along on their suicide mission to hand the White House to Hillary Clinton, a woman who as many as two-thirds of all Americans dislike, according to a recent poll. We are moving toward, as two Republican strategists recently remarked on CNBC, a November matchup of Clinton and Donald Trump that most voters actually don’t want.

How did we get here? Three major factors — race, class and geography — shaped the Super Tuesday results, much as they have the overall campaign, and they reinforce the prospect of even more divisive politics in the years ahead.

The Racial Primary

Class defined the first primaries, where white voters predominated. In the South and Southwest, racial bloc voting has sealed the deal for Hillary Clinton. African-American voters may not have done well economically over the past seven years, but their loyalty to President Obama, and to the Clintons, remains rock solid. Having provided the base for a huge win in South Carolina, on Super Tuesday, black voters sealed her victories in Georgia, Virginia and Alabama, and contributed greatly to her cause in Texas, where Latino voters also gave Hillary some 65 percent of their votes. Virtually everywhere minority votes put Clinton over the top, with weaker support from whites. In Virginia, where African-Americans constitute 25 percent of the primary electorate, eight out of 10 cast their vote for the former Secretary of State.

In contrast Bernie Sanders, the consummate radical candidate, continued to do well largely in lily-white states, as he did to start off the campaign in Iowa (92 percent white) and New Hampshire (94 percent white). He made a strong showing in Massachusetts (80 percent white) with 49 percent of the vote, while winning Oklahoma (82 percent white), Minnesota (85 percent white) and his home state of Vermont (95 percent white). Sanders also won in Colorado, a state that is 80 percent white, with a growing, predominantly Democratic Latino population but that is only 3.8 percent black.

Nationally, Republicans make pains to say publicly that they need to appeal to minorities, but as of 2012, 89 percent of voters who identified with the party were non-Hispanic white, compared to 60 percent of Democrats and 70 percent of independents. Even in highly diverse places like Harris County (Houston), on Tuesday almost 70 percent of GOP early voters were white compared to barely 41 percent of Democrats. Statewide exit polls put the GOP primary electorate at 82 percent white and 10 percent Hispanic; strangely, despite widespread perceptions that Trump is anti-immigrant, he didn’t do all that much worse with this demographic than favorite son Ted Cruz, with support from 26 percent of Hispanic GOP voters, versus 32 percent for Cruz.

Overall the big winner of the white primary is Donald Trump. Like Sanders he has racked up his strongest victories in nominally liberal white states like Massachusetts, which normally might have been expected to be easy pickings for Ohio Gov. John Kasich, who came in a distant second. Trump won in the Bay State largely by sweeping the votes of poorer whites, precisely those who compete with immigrants for jobs and housing. But Trump won the support of white voters virtually everywhere by large margins. This shows that, in the Republican world at least, you can play with racial fire and not only survive, but actually thrive.

The Class Election

Among white voters, the big dividing line remains class. Throughout the election both Sanders and Trump have done best with those who make the least money. Among whites, Clinton has outperformed Sanders not only among seniors but also those making over $200,000. This may have helped her in places where there are many affluent whites, notably northern Virginia, where wealthy suburbanites combined with African-Americans to seal her impressive win in the state.

Sanders did somewhat better in states where the white working class is larger, such as Oklahoma and Tennessee. Yet Sanders really does best in his native New England and across the northern tier, in places like Minnesota, where socialist ideas have had resonance for generations among working- and middle-class voters.

But the most successful class warrior in this race remains Trump, a billionaire who is rapidly turning the GOP into the most unlikely of working-class parties. Overall working-class whites represent some 53 percent of all GOP voters. In Tennessee, according to exit polls, Trump took more than half of these voters, providing him a base that no other Republican can not match.

And it is a riled-up base. Some 53 percent of all Trump voters in Georgia exit polls said they were angry, 10 times those who said they were satisfied. Overall throughout the country over half of those coming out to vote Tuesday in the GOP primaries also expressed extreme dissatisfaction with the political status quo. These voter came out in big numbers for the Donald.

In contrast, Rubio does better among well-educated, more affluent voters, but they are easily outnumbered by the less well-off electorate, particularly in the south. In some states, particularly in the north, these voters have been leaving the GOP, making the party dependent on people who do not share the priorities or generally more liberal social views of the donor class. But there were at least enough moderate whites left in Minnesota to get Rubio his first victory, and allowed Kasich to come in a relatively close second to Trump in Vermont.

Some pundits, such as Rolling Stone’s Matt Taibbi, see this white electorate as essentially “moronic,” dooming the GOP to a much deserved extinction in the wake of the triumph of “multicultural vision.” Yet don’t count the white working-class voter out yet. As liberal analyst John Judis notes, this group may be a declining share of the electorate – down from 65 percent in 1980 to about 35 percent today — but they still have the numbers to determine the November outcome not only in the South but in Northern states such as Wisconsin, Ohio, Iowa, Minnesota and New Hampshire.

In November, geography will play a huge role, with most states either falling into the red or blue column. But in the primary season, it still helps to be a local. Ted Cruz’ victory in the Lone Star State, for example, may have less to do with the small Latino vote and more with his Texan identity; his win in Oklahoma may also have something to do with proximity, as well as the preponderance of evangelical communities.

Similarly Bernie Sanders did best in his home state of Vermont and liberal Colorado, and was at least competitive in neighborhood Massachusetts. These states are also home to many colleges and college students — his strongest base.

Yet the bottom line remains that, for all intents and purposes, we are about to see two largely unlikable, and untrusted, candidates running against each other. With Clinton depending on minorities and affluent liberals to get her through, and Trump running, almost exclusively, as the tribune of the angry, increasingly economically marginal white middle and working classes, we are seeing a divisive campaign whose final result is likely to please only a small minority of Americans.

Joel Kotkin is executive editor of NewGeography.com. He is the Roger Hobbs Distinguished Fellow in Urban Studies at Chapman University and executive director of the Houston-based Center for Opportunity Urbanism. His newest book, The Human City: Urbanism for the rest of us, will be published in April by Agate. He is also author of The New Class ConflictThe City: A Global History, and The Next Hundred Million: America in 2050. He lives in Orange County, CA.

Republican results map by Ali Zifan (Own work; Map is based on here.) [CC BY-SA 4.0], via Wikimedia Commons

Who Plans?: Jane Jacobs’ Hayekian Critique of Urban Planning

$
0
0

"Cities are fantastically dynamic places, and this is strikingly true of their successful parts, which offer a fertile ground for the plans of thousands of people."

– Jane Jacobs, The Death and Life of Great American Cities

For most of the field’s history, prominent urban planning theorists have taken for granted that cities require extensive central planning. With the question framed as “To plan or not to plan?” students and practitioners answer with an emphatic “Yes,” subsequently setting out to impose their particular ideal order on what they perceived to be, as Lewis Mumford put it, “solidified chaos.” Whether through the controlled centralization of Le Corbusier or the controlled decentralization of Ebenezer Howard and Frank Lloyd Wright, cities were to be just that: controlled. When in 1961 Jane Jacobs set out to attack the orthodox tradition of urban planning, it was this dogma that landed squarely in her crosshairs. With her characteristically deceptive simplicity, she invites us to ask, “Who plans?”

While many take Jacobs’ essential contribution to be her insights into urban design, her subversion begins at the theoretical level in the introduction to The Death and Life of Great American Cities. Despite their diverse aesthetic preferences, Corbusier and Howard share much in common. Both assume that planning entails the enshrining of a single plan and the suppression of all other individual plans. Both insist on imposing a “pretended order” on the “real order,” treating the city as a simple machine rather than a manifestation of organized complexity. Like Adam Smith’s “man of system,” each thinker was “so enamoured with the supposed beauty of his own ideal plan of government, that he [could not] suffer the smallest deviation from any part of it.”

Jane Jacobs’ critique of this orthodox tradition unfolds in three steps, closely following F.A. Hayek’s argument in The Use of Knowledge in Society. First, Jacobs emphasizes the importance of local knowledge. Where orthodox urban planners assume that the essential information in planning decisions can be gained through abstract principles and statistical aggregates, Jacobs makes the case for respecting local, man-on-the-spot knowledge. Consider the case of the East Harlem project, a centrally planned housing project sporting Corbusierian towers and giant lawns: housing officials viewed the project from an aesthetic and statistical viewpoint and loved it. Meanwhile, residents hated it; it segregated them from their communities, separated them from commercial uses, and left them with a big, useless lawn. Throughout the book Jacobs describes similar situations in which the needs and preferences of local residents clashed with central planners, with the conflict’s resolution all too often falling in favor of the “experts.”

Second, Jacobs knew that decentralized planning was the best way to make the most of local knowledge. Local residents often have the knowledge needed to make wise decisions about urban form. As Jacobs details throughout The Death and Life, the urban planner’s best course of action is typically to allow individuals to plan for themselves. As Hayek framed the problem of economic planning, the question should not be whether or not to plan, but rather who should plan? Put differently, we might distinguish between centralized and decentralized planning. Under a centralized planning regime, an individual or small group makes decisions for everyone regardless of what unique, local knowledge they may have. We see this often in cities today: Everyone must respect certain setbacks. All restaurantsmust offer unpriced parking. On the other hand, decentralized planning allows individuals to create their own plans and draw on their unique preferences and local knowledge. Where would like to live? How would like to interact with neighboring residents and businesses?

Finally, Jacobs clarified how decentralized planning helps create and maintain the spontaneous orders that make urban life work. Many of The Death and Life’s most beautiful passages concern the natural order that emerges from decentralized planning: sidewalk ballets that help keep streets safe and socialize children, diverse residential and commercial uses, and self-governing communities. These spontaneous orders are, in the words of Scottish philosopher Adam Ferguson, “the result of human action, but not the execution of any human design.” By allowing individuals to freely organize themselves in relation to one another, natural urban orders emerge without any central planning. Certainly it is not the case that all decentralized planning results in such orders. But as Jacobs points out, centralized urban planning, as it exists today, often hurts rather than helps.

For all the love Jane Jacobs has received from urban planners and policymakers since her first book was published, her greatest theoretical innovation seems to be largely disregarded. Cities across the country continue to centrally plan the minutiae of urban life, from obsessively detailed land-use regulations to impossibly ambitious comprehensive plans. Even many of those who have embraced Jacobs’ urban design insights scrapped her theoretical underpinnings, using rigid, top-down plans to create unsettling and unchanging recreations of natural neighborhoods and cities.

None of this should be taken to mean that there’s no place for central planning. Jane Jacobs, like F.A. Hayek, seems to be open to centralized urban planning in certain situations. However, the focus should remain on preserving a large sphere in which urban residents retain the right to engage in their own planning. A shift toward a more Jacobsian/Hayekian urban planning might occur in at least two ways. First, urban planners should focus on the kind of market failure uniquely important to urban life: externalities. Whether this involves creating a framework whereby neighbors may engage in a kind of Coasian bargaining or instituting broad prohibitions on certain harmful activities may depend on local conditions. It is clear that current centralized urban planning goes far beyond this.

Second, where some level of central planning is necessary, plans should empower rather than undermine choice. Consider the beauty of New York City’s grid: planned with remarkable foresight in 1811, the grid served as a blank slate for development, with accessible streets and adaptable blocks. Where grand plans of this kind are necessary, planners should emphasize flexibility in order to support the dynamism of decentralized planning. Where grand plans are not necessary, planners should stick to the trial-and-error of decentralized planning. Jacobs makes this case when she argues for embedding individual subsidized housing units into already functioning neighborhoods rather than tearing down and replacing whole neighborhoods. While an individual building may fail, its failure won’t be nearly be catastrophic as the failure of a grand housing project plan. Meanwhile, a small success can be studied, replicated, and scaled up when appropriate.

As Hayek did in the case of economics, Jacobs stood up to an urban planning orthodoxy that enjoyed the support of policymakers, academics, and all the “Very Serious People.” She celebrated the wisdom of everyday people when the relevant experts found answers only in statistical aggregates and economic calculus. Hayek and Jacobs defended the importance of local knowledge, illustrated the power of decentralized planning, and celebrated the sublime spontaneous orders that organize our lives. Yet their theoretical innovations went largely unnoticed long after their respective publications. Here, the two thinkers diverge: while Hayekian ideas have largely driven centralized economic planning into the dustbin of history, I suspect the Jacobsian urban revolution has only just begun.

This piece first appeared at Market Urbanism.

Photo: Creativity+ Timothy K Hamilton

Now They Get It: Health, Class, and Economic Restructuring

$
0
0

In the past few months, many commentators have responded to a recent study that shows increasing death rates among middle-aged white Americans. Some have suggested that the increase is the consequence of material poverty resulting from economic restructuring and the neoliberal agenda over the last several decades.

Globalization, trade liberalization, deregulation, privatization, and reductions in the welfare state have not only led to downsizing in many industries, they have also reduced wages and benefits, contributing to growing economic inequality. The nature of many jobs has also changed. Work has been intensified, hours have become increasingly irregular, and workers face anxieties about the loss of their jobs and electronic monitoring of their work. These changes leave workers feeling vulnerable and stressed, and that together with anti-union laws and poorly enforced labor laws limit their ability to fight back. As someone who taught courses in Occupational Safety and Health for many years, I am all too aware that these workplace stresses and the limits of workers’ agency are associated with increases in cardiovascular disease, physical and mental disorders, and acute injuries. In other words, while research has focused on increasing mortality rates, changes in work also contribute to increased health problems, which may, in turn, explain the increases in alcoholism and drug abuse that Anne Case and Angus Deaton see as key factors in the rising death rates.

Workplace stress and insecurity are among the “hidden injuries of class” that compound material poverty. As people adapt to changes in and the loss of work, they become more isolated, and, too often, lose their sense of community and self worth. Worse, they internalize insecurity, blaming themselves for problems at work or for not being able to find a decent job or support their families. That people blame themselves should not surprise us, given the persistent ideal of the American Dream, which promises that individual effort will pay off in upward mobility. No wonder people who have lost jobs or who are working hard but still struggling economically see their challenges as a moral failure or character flaw.

For anyone who has studied the social costs of deindustrialization, none of this is news. In the 1980s, Harvey Brenner determined that for every one percent increase in unemployment there were 650 homicides, 3300 admissions to state mental hospitals, 500 deaths by cirrhosis of the liver, 20,000 deaths by suicide. Other studies focused on displaced workers in the late twentieth century showed increases in incarceration, insomnia, headaches, smoking, child and spousal abuse and stomach disorders, not to mention suicide and drug and alcohol abuse. In many ways, the current research shows not a new trend but rather the long-term impact of economic restructuring and neoliberalism on workers’ lives.

What is new is that these patterns no longer seem to apply primarily to the working class. While Case and Deaton note that poorer and less-educated white people had even higher mortality rates, their study suggests that the pattern also applies to the middle class. This may be what most surprised commentators, for whom the report offered dramatic evidence of an important change in American culture. As Paul Krugman suggested, “We’ve seen this kind of thing in other times and places – for example, in the plunging life expectancy that afflicted Russia after the fall of Communism. But it is a shock to see it, even in an attenuated form, in America.” Krugman and others asked how this could happen. In an interview with Vox, Deaton commented that the middle-aged white people in his study had “lost the narrative of their lives.” While this certainly applies for many in the working class, as Sherry Linkon noted in November, it is also true for growing numbers of middle-class Americans who may have been even more invested in the American Dream.

Also new is the racial pattern. In the 1970s and 80s, death rates for African Americans rose, but in recent decades, they have fallen as the rates for whites have risen. Andrew Cherlin suggests that the difference could be explained by people’s perceptions of how they are doing compared with others like them. As Cherlin writes, “It’s likely that many non-college-educated whites are comparing themselves to a generation that had more opportunities than they have, whereas many blacks and Hispanics are comparing themselves to a generation that had fewer opportunities.” Put simply, if white working-class people see themselves as losing ground, they may be more likely to consider suicide or engage in self-destructive behaviors.

The impact of economic restructuring on material poverty and health has a long history. In the last 40 years, increases in poverty and the declines in the health of the working class were rationalized as “acceptable” losses associated with major economic change. But what has changed is the demographic landscape. No longer are mortality and morbidity issues associated primarily with the working-class and African Americans. Now, job loss and economic insecurity are impacting the middle class and whites.

I’m reminded of an old adage: when poverty comes in the door, love goes out the window. As middle-class whites increasingly experience the kind of economic insecurity that became normal for so many working-class people years ago, some are losing not just love but also their health and even their lives.

This essay was first published by the Working-Class Perspectives blog, which offers weekly commentaries on current issues related to working-class people and communities.

John Russo is a visiting fellow at Kalmanovitz Initiative for Labor and Working Poor at Georgetown University and at the Metropolitan Institute at Virginia Tech. He is the co-author with Sherry Linkon of Steeltown U.S.A.: Work and Memory in Youngstown (8th printing).

The Great Vancouver Exodus: Why I’m Almost Ready to Leave the City

$
0
0

It was one of those Sundays in early January when you wake up to bright, stark sunlight streaming through your blinds.

My fellow Vancouverites might know the one. It’s been grey and dreary for months. You open your curtains to a brave new world and see, with sudden, startling clarity, all of the dust that had gathered in the cracks of your life while you had been hibernating through the long winter.

Every year, on this particular day in January, I find myself wandering around the city alone in an unsettled daze—one hand on this first pulse of summer, wondering how, with all of the dust and cracks, I can keep on pushing forward.

It was freezing out, being January and a cloudless day, but I needed to get out of the house.

At that point, I had been “home” in Vancouver for a month after spending half a year in Europe.

In that month, I spent a lot of time with my head between my hands complaining to friends about how torn I was between feeling the need to put my adult life together in my hometown and wanting to get on a plane back to Europe in search of a new place to call home.

My best girlfriend then said to me, “Get away from the city. Go for a walk. Go to Stanley Park, wander into the forest and think about it. What do you really want? What makes you happy? Don’t think about what society says you should be doing. Think about what you should be doing.”

“But it’s coooooold,” I said.

“Oh princess,” she said. “Suck it up, bundle up, and thank me later.”

And so, on that particular day in January, I dug out my warmest clothes, which, either ironically or coincidentally, looked very Pacific Northwest—red plaid flannel shirt, TNA Sea-To-Sky sweater (that one every girl in Vancouver owns), dark jeans, brown combat boots, fur-lined parka, knit gloves, and white toque (that’s what we call beanies in Canada).

I walked to the SkyTrain (the Vancouver metro) and rode towards the glass towers rising out of Vancouver’s downtown core. I passed the offices of the Central Business District where all lights had been switched off for the weekend, and to the far end of the downtown Vancouver peninsula where the 1001-acre Stanley Park is located.

I meandered into the park. West Georgia Street turned into Lost Lagoon into a forest trail where the light got darker and the trees thicker with every step I took.

In the month that I had been “home,” I had come across a lot of questions, which were driving me to bouts of insomnia, frenzies of SkyTrain platform pacing, and uncharacteristically melodramatic speech.

Away from the bustle of the city and my 9 to 5 job, I was able to start working through these questions.

“Am I meant to settle down in this city, or is my home to be elsewhere in the world?”

“Is it wiser for me to lay the foundations for my future in Vancouver, or should I start digging elsewhere?”

“If I am meant to stay, do I have the courage to do so?”

“If I am meant to leave, do I have the courage to do so?

As I wandered deeper into Stanley Park, the din of traffic from the Lions Gate Bridge fading into a cacophony of crows in the trees and my breath misty puffs in the crisp January air, I found my answers.

And it broke my heart.

It’s time to leave Vancouver.

There is an interesting phenomenon that has been occurring at an increasingly rapid pace over the past number of years.

We call it the “Exodus of Millennials,” or, as I like to put it “The Great Vancouver Exodus.” 

There is an affordability crisis in this city. Vancouver is ranked the 2nd least affordable city in the world next to only Hong Kong. Considering what it costs to live in places like New York or London, our dilemma here should be quite apparent.

Housing prices have grown at an alarming rate. As of 2016, 91% of single-family homes are valued at over $1 million. Our salaries have not grown to match.

One of my best friends is a realtor. For years, she has been saying, “Get into the market as soon as you can.”

The rest of us who are less educated in real estate would talk about waiting for the real estate bubble to burst.

I entered the industry myself recently and began paying attention to trends and numbers. Vancouver’s bubble isn’t going to burst anytime soon. It’s either get in as soon as possible, or get out of town.

It’s ridiculous, really.

Let me put it this way.

For four years, I worked full-time. One of my offices was on Burrard where the rent per square foot is the second highest in Canada. One of my other offices was a block away and I had an unobstructed view of the Olympic Cauldron. I spent a lot of time ordering people around.

You’d think I was doing pretty well for myself.

In those four years, I first lived in a 300 sq. ft. apartment that cost 1/3 of my salary and was located on Drake between the noisy Granville and Burrard Bridges. I then moved to Commercial Drive and lived in an unremarkable 1-bedroom walk-up that hadn’t been updated since the 70s. Every so often, I’d come across a stray silverfish.

In that time, I tried to save for a down payment. Four years of saving later, all I could afford was a single-roomed shoe box in an up-and-coming (read: will be safe in 20 years) neighborhood.

It was then that I decided it wasn’t worth spending my hard-earned money on a shoe box that I’ll nevertheless be paying off for twenty years. So I bought myself a one-way ticket to Europe instead.

Note: the person I used to share the apartment on Commercial Drive with now lives up the street. He pays $850 a month (1/4 of his salary) for a 75 sq.ft. bedroom in a 100-year-old house shared with some ten people. The house is so old it appears impossible to keep clean, every stair is caving in the center, and the floorboards are obnoxiously squeaky. It recently sold for $1.4 million.

Over the past few years, I have found myself at increasingly more going-away parties.

“My start-up got funded in New York,” says one departee (yes, I made that word up).

“I just got promoted to head office in Toronto,” says another.

And every one of them says things like, “I’m moving to San Francisco, London, Berlin, Madrid, Paris, Beijing, Hong Kong, Singapore, whatever, because I can’t afford to be here anymore.”

For the most part, my core group of about five friends remained unaffected. However, having spoken at length to them recently, I realized that they are all seriously considering joining the Exodus.

They all started thinking about it at the same time. Their timelines for leaving fall within the same year. Their reasons for leaving are similar. My consideration of the aspects of my own Exodus line up perfectly with theirs.

In fact, in the month that I’ve been “home,” one of my closest friends has already made it to San Francisco.

My best girlfriend is in the process of saving to move somewhere tropical with her husband so they can work as diving instructors.

Even the realtor, who has been making a killing off of our real estate market, is ready to go.

“I’m going to London next year to get my Master’s,” she said. “We are so secluded here and I feel like there’s a lot more I could be doing for both myself and the world.”

I’ve seen the outrageous amounts of money realtors pull in. She has all of the makings of a realtor—smart, driven, ambitious, organized, well-spoken, well-dressed, attractive, and trustworthy—and she is good at it.

For someone like her want to give up a real estate market like Vancouver is saying something.

When it comes to business, Vancouver is a satellite city. I dare even say that Canada is a satellite country.

As a marketer who often works cross-border with the US, I have always been miffed at the huge discrepancy between marketing budgets allotted to the US vs. Canada.

“There just isn’t enough of a market in Canada,” I’m always told.

Fun fact: the entire population of Canada can fit into the State of California.

When it comes to international business, Canada usually concedes to the decisions of the US division. When it comes to national business, Vancouver usually concedes to Toronto.

If you’ve never experienced this, allow me to tell you that it is frustrating to have to follow directions from a voice over a phone located three time zones away and in a completely different part of the country.

Therefore, everyone is leaving. Those of the ambitious, career-oriented kind are all fleeing for greener (and more affordable) pastures elsewhere. This is happening so rapidly and thoroughly that the entire future of the Vancouver economy is being threatened.

Twenty-five countries later, I still think Vancouver is one of, if not the most beautiful city in the world.

But it is precariously poised to become a ghost town and I am far from ready for the afterlife.

And so, all reason is pointing me to join the Exodus.

By this point, I had wandered from the north end of Stanley Park to the south end.

I sat down on a bench by the water somewhere between Second and Third Beach facing the sunset.

I was terrified. Is it really true that I am meant to leave everything familiar because I am being priced out of the housing market in my hometown?

Yet I silently thanked my best girlfriend.

My head was clear.

I need to leave Vancouver.

My walk ended at the stone-stacked Inukshuk at the far end of English Bay. The Inukshuk is an iconic symbol of Vancouver, having been the basis for our 2010 Winter Olympics logo.

I stood there for a while, watching the last orange rays of sunset disappear behind the mountains and shivering in the winter chill.

I realized I was saying goodbye.

It’s almost time to join the Exodus.

Grace Pacifica Chen is a Vancouver-based marketing consultant, brand manager, travel blogger, and creative writer. Follow her on Twitter and Instagram @pacificachen.

California Valued for Cash, Not Candidates

$
0
0

California may be the country’s most important and influential state for technology, culture and lifestyle, but has become something of a cipher in terms of providing national political leaders. Not one California politician entered the 2016 presidential race in either party and, looking over the landscape, it’s difficult to see even a potential contender emerging over the coming decade.

We are a long way from the California dreamin’ days of Richard Nixon, Ronald Reagan and even the early Jerry Brown era. Today we approach national politics largely as spectators – and our rich residents as donors – to storms brewing in other regions.

In contrast, New Yorkers clearly have the moxie to rise. Ted Cruz even lambasted “New York values” in his to-date failed attempt to derail Donald Trump. Just watch Trump and his new consigliere, New Jersey Gov. Chris Christie, in action, they’re quintessential New York egomaniacal tough guys.

The Democrats also have a big New York imprint, with the front-runner, Hillary Clinton, a former New York U.S. senator and current resident. Her diminishing challenger, Bernie Sanders, is an aged Jewish boy from Brooklyn.

And, waiting in the wings, with his billions and his ego ready to propel him, sits former New York City Mayor Michael Bloomberg. Some East Coast observers see him as a potential running mate for Clinton, which certainly would make fundraising less important.

But it’s not just New York’s political culture that has shaped this election. The biggest non-Trump drama of the race has been the bitter conflict between two Florida politicians, the departed Jeb Bush and Marco Rubio, now the rapidly fading hope of establishmentarian Republicans. Texas, too, has expressed at least the more doctrinaire aspect of its political culture in inflicting Ted Cruz on the electorate. Even the Rust Belt has had its moment, in the quixotic, but at least fundamentally decent, campaign of John Kasich.

Read the entire piece at The Orange County Register.

Joel Kotkin is executive editor of NewGeography.com. He is the Roger Hobbs Distinguished Fellow in Urban Studies at Chapman University and executive director of the Houston-based Center for Opportunity Urbanism. His newest book, The Human City: Urbanism for the rest of us, will be published in April by Agate. He is also author of The New Class ConflictThe City: A Global History, and The Next Hundred Million: America in 2050. He lives in Orange County, CA.

Photo by Steve Jurvetson from Menlo Park, USA (Hillary Clinton Looking Forward) [CC BY 2.0], via Wikimedia Commons


America’s Most Urban States

$
0
0

To the untrained eye, looking at a map of metropolitan America can lead one to the conclusion that at least half the nation’s land area is covered by urbanization. This is illustrated by Figure 1 below, which is a Census Bureau map of metropolitan areas as defined in 2013. These areas cover approximately 1.675 million square miles, which represents 47 percent of the US land area.


Metropolitan Land: More Rural than Urban

However, someone well informed in urban geography would quickly retort that most  metropolitan areas are more rural than  are urban and, in total,  the only 3% of the nation’s land area is in urban development. This shown by data in the 2010 census, which counts as urban all settlements with at least 2,500 population (a complete list of the 3,600 urban areas is at http://demographia.com/db-uza2010.pdf).

The difference is between two very different definitions of the city. The physical city, called the urban area in the United States, the built-up urban area in the United Kingdom, the unité urbaine in France and population center in Canada is the area of continuous urbanization (or development). The metropolitan area is a much larger geography that includes areas from which a substantial portion of the working population is employed in a core area that is, in the United States it is central counties, an area typically far larger than what was formerly called the “central city” or the “core city.” Figure 2 is a map of urban areas, which indicates the best approximation of the extent of urbanization in the United States.

Within metropolitan areas, the area between the principal urban area and metropolitan area boundaries is largely rural, but may also include urban areas. For example, in Los Angeles, Santa Clarita, Palmdale and Lancaster are secondary urban areas located between the principal urban area and the metropolitan boundary.

In the Riverside-San Bernardino metropolitan area, the Needles urban area also lies between the principal urban area and the metropolitan area boundary. However, Needles is more than 200 miles away from the city halls of either Riverside or San Bernardino and it would take a commuter at least three hours to reach either place, assuming no traffic congestion. In the United States, metropolitan areas are composed of entire counties and where there are larger counties, as in Riverside-San Bernardino, the metropolitan area contains much more area than represents a reasonable commuting distance. This also makes any urban research based on metropolitan area densities nonsensical, because they are driven by rural rather than urban densities.

Urban research needs to be performed using urban densities. That can be at the metropolitan area level or even the state level.

Highest Urban Density in California

It may be surprising that California, which largely defined the suburbanized urban form that developed after World War II has the highest urban population density in the nation (Figure 3). California’s urban areas have an average density of 4300 per square mile. California has the three most densely populated large urban areas in the country: Los Angeles at approximately 7000 residents per square mile, San Francisco at approximately 6300 residents per square mile and San Jose with approximately 5800 residents per square mile. Indeed, San Jose, which does not even have a pre-World War II urban core (because it had too small a population at the time) is approximately 10% denser than the urban area with the nation’s largest pre-World War II urban core, New York (5300 residents per square mile).

Even before the radical densification policies of Senate Bill 375 were implemented, California’s high density credentials were impeccable. Among all urban areas in the nation, 21 of the densest 25 are in California, including Richgrove, an urban area of less than 3000 residents in a population density of over 10,000 per square mile. Richgrove is located in Tulare County, in the San Joaquin Valley, 10 miles east of State Highway 99, in the Delano area. Not only is Los Angeles nearly twice as dense as international densification model Portland, but San Francisco, San Jose, Sacramento, Riverside – San Bernardino and San Diego are also more dense than Portland, not to mention Fresno, Oxnard, Stockton, Los Banos, Simi Valley and Modesto and, of course Richgrove (as well as others).

New York has the second highest state urban population density at 4200 residents per square mile. Again, perhaps surprisingly, Nevada has the third highest population urban density, though well below New York at 3300 residents per square mile. Las Vegas is the fifth highest density urban area over 1,000,00 residents, at 4500 residents per square mile Only one other state, Hawaii, has an urban population density above 3000 residents per square mile (3200). Honolulu, with fewer than 1,000,000 residents, has an urban density of 4800 per square mile.

Rather than being dominated by the states with the urban areas perceived to be the densest, in the East and Midwest, seven are in the West, which has, like California, a reputation for urban sprawl. Only New Jersey, much of which is suburban New York or Philadelphia, as well as Illinois, home of the nation’s third largest urban area, Chicago, rank in the 10 densest states for urbanization.

Lowest Urban Densities in New Hampshire and the South

Eight of the 10 least dense states are in the South. Two are in the East, one of which should be no surprise, Maine, where all of the urban areas are somewhat small. (Figure 4) New Hampshire, however, may be surprising, since so much of the population is located in suburban Boston. One of the least accurate urban myths is about Boston as a dense urban area. Yes, it is dense inside Route 128 (Interstate 95), but beyond that it exhibits densities about the same as Atlanta, which is the least dense urban area in the world that has more than 2 million residents.

There were also some surprises outside the top and bottom 10. Nebraska ranked 11th in urban density, well above its Great Plains peers. Texas ranked 13th, at 2400 per square mile, nearly equaling number 12 Maryland. Connecticut, which is in the New York commuting zone ranked 38th.

Highest Urban Land Percentages in the Northeast Corridor

While California has the densest urbanization, it is by no means the most urbanized in terms of its amount of urban land area. Only 5 percent of California’s land area is urban, somewhat more than the national average, but 22 states have larger urbanization percentages. Four states are bunched up near the top, with between 37 percent and nearly 40 percent of their land area under urban development, New Jersey, Rhode Island, Massachusetts and Connecticut (Table).  Each of these states is in the Northeast Corridor,  home to nearly 50 million residents, that stretches from the suburbs south of Washington, through parts of 10 states and the District of Columbia, to the Boston suburbs of New Hampshire.

However, most states are far less urbanized. The fifth and sixth most urbanized states, Delaware and Maryland, are also in the northeast megalopolis, barely have as much urban land as the top four, at approximately 20 percent urbanized. It is another big drop to number seven Florida, at 14 percent.

Most States Have Little Urbanization

As would be expected, Alaska has the least urbanization, covering less than 0.1 percent of its land area. Wyoming is the second least urbanized, at 0.2 percent, closely followed by Montana (also 0.2 percent), North Dakota and South Dakota (both at 0.3 percent). The tenth least urbanized state, Utah, has only 1.1 percent of its land occupied by urbanization.

All of this indicates that the urbanization that houses more than 250 million residents in the United States covers only a much more modest share of its land than often thought (3.0 percent ). This is even truer outside the Northeast Corridor.


Built-Up Urban Areas in the United States
State & DC Totals: 2010
State/DistrictUrban PopulationUrban Land Area (Square Miles)Urban Density (Square Miles)Urban Density (Square KM)Urban Density RankUrban Popu-

lation Rank
Urban Popu-

lation % Rank
Urban Land/ Total LandUrban Land % Rank
Alabama     2,821,804       2,207     1,278        494         49 59.0%          42 4.3%       23
Alaska        468,893          260     1,803        696         36 66.0%          37 0.0%       50
Arizona     5,740,659       2,187     2,625     1,014         10 89.8%            9 1.9%       33
Arkansas     1,637,589       1,097     1,493        576         42 56.2%          45 2.1%       32
California   35,373,606       8,219     4,304     1,662           1 95.0%            1 5.3%       21
Colorado     4,332,761       1,528     2,836     1,095           7 86.2%          14 1.5%       37
Connecticut     3,144,942       1,826     1,722        665         38 88.0%          11 37.7%         4
Delaware        747,949          407     1,838        710         35 83.3%          17 20.8%         5
District of Columbia        601,723            61     9,857     3,806 100.0%100.0%
Florida   17,139,844       7,403     2,315        894         16 91.2%            6 13.7%         7
Georgia     7,272,151       4,797     1,516        585         41 75.1%          23 8.3%       12
Hawaii     1,250,489          393     3,181     1,228           4 91.9%            5 6.1%       20
Idaho     1,106,370          499     2,217        856         19 70.6%          30 0.6%       45
Illinois   11,353,553       3,946     2,878     1,111           5 88.5%          10 7.1%       15
Indiana     4,697,100       2,525     1,860        718         34 72.4%          29 7.0%       17
Iowa     1,950,256          953     2,046        790         25 64.0%          39 1.7%       35
Kansas     2,116,961          973     2,176        840         21 74.2%          25 1.2%       38
Kentucky     2,533,343       1,411     1,796        693         37 58.4%          43 3.6%       25
Louisiana     3,317,805       1,968     1,686        651         39 73.2%          27 4.5%       22
Maine        513,542          360     1,428        551         44 38.7%          50 1.2%       39
Maryland     5,034,331       2,005     2,511        970         12 87.2%          13 20.5%         6
Massachusetts     6,021,989       2,987     2,016        778         29 92.0%            4 38.1%         3
Michigan     7,369,957       3,623     2,034        785         27 74.6%          24 6.4%       19
Minnesota     3,886,311       1,705     2,279        880         17 73.3%          26 2.1%       31
Mississippi     1,464,224       1,106     1,324        511         47 49.3%          47 2.4%       30
Missouri     4,218,371       2,054     2,053        793         24 70.4%          31 3.0%       28
Montana        553,014          297     1,861        718         33 55.9%          46 0.2%       48
Nebraska     1,335,686          524     2,549        984         11 73.1%          28 0.7%       43
Nevada     2,543,797          767     3,315     1,280           3 94.2%            3 0.7%       42
New Hampshire        793,872          644     1,233        476         50 60.3%          40 7.2%       14
New Jersey     8,324,126       2,920     2,851     1,101           6 94.7%            2 39.4%         1
New Mexico     1,594,361          827     1,929        745         30 77.4%          21 0.7%       44
New York   17,028,105       4,092     4,161     1,607           2 87.9%          12 8.7%       11
North Carolina     6,301,756       4,609     1,367        528         46 66.1%          36 9.5%       10
North Dakota        402,872          184     2,192        846         20 59.9%          41 0.3%       47
Ohio     8,989,694       4,420     2,034        785         28 77.9%          20 10.8%         8
Oklahoma     2,485,029       1,307     1,902        734         31 66.2%          35 1.9%       34
Oregon     3,104,382       1,107     2,805     1,083           8 81.0%          18 1.2%       40
Pennsylvania     9,991,287       4,705     2,123        820         22 78.7%          19 10.5%         9
Rhode Island        955,043          401     2,384        920         14 90.7%            7 38.3%         2
South Carolina     3,067,809       2,382     1,288        497         48 66.3%          34 7.9%       13
South Dakota        461,247          226     2,038        787         26 56.7%          44 0.3%       46
Tennessee     4,213,245       2,905     1,450        560         43 66.4%          33 7.0%       16
Texas   21,298,039       8,746     2,435        940         13 84.7%          15 3.3%       27
Utah     2,503,595          915     2,737     1,057           9 90.6%            8 1.1%       41
Vermont        243,385          156     1,559        602         40 38.9%          49 1.7%       36
Virginia     6,037,094       2,665     2,265        875         18 75.5%          22 6.7%       18
Washington     5,651,869       2,375     2,380        919         15 84.0%          16 3.6%       24
West Virginia        902,810          640     1,410        544         45 48.7%          48 2.7%       29
Wisconsin     3,989,638       1,879     2,123        820         23 70.2%          32 3.5%       26
Wyoming        364,993          195     1,876        724         32 64.8%          38 0.2%       49
United States 249,253,271   106,386     2,343        905 80.7%3.0%
Data source: US Census Bureau.


Wendell Cox is principal of Demographia, an international pubilc policy and demographics firm. He is a Senior Fellow of the Center for Opportunity Urbanism (US), Senior Fellow for Housing Affordability and Municipal Policy for the Frontier Centre for Public Policy (Canada), and a member of the Board of Advisors of the Center for Demographics and Policy at Chapman University (California). He is co-author of the "Demographia International Housing Affordability Survey" and author of "Demographia World Urban Areas" and "War on the Dream: How Anti-Sprawl Policy Threatens the Quality of Life." He was appointed to three terms on the Los Angeles County Transportation Commission, where he served with the leading city and county leadership as the only non-elected member. He served as a visiting professor at the Conservatoire National des Arts et Metiers, a national university in Paris.

Photograph: Downtown Chicago from the Air (by author)

Why Jersey City is the New Brooklyn

$
0
0

For hundreds of years, New York City has been viewed by Americans and foreigners alike as the default capital of the United States. Though not the official political capital city, New York, New York has been commonly viewed, and certainly among its own residents, as the de facto center for American culture, music, sports, food, and art.

Although far more people migrate out of the New York area than come, it remains a primary destination for those who—in the words of Frank Sinatra—want to be a part of it.

However, today being “a part of it”—particularly in Manhattan and the fashionista parts of Brooklyn—is a lot more difficult than it once was. It no longer involves just a suitcase and a dream. Those looking to move out to the Big Apple increasingly difficult, largely due to huge costs for housing.

The chorus of complaints about skyrocketing real estate prices has become an ever growing occurrence in the area, as most New York City residents and newcomers alike struggle to make ends meet. For well over a decade Manhattan has been so popular, and so expensive, that the real estate boom has spread to other boroughs—in particular, the western reaches of Brooklyn, only a short subway ride from Manhattan.

Once a significant and yet often ignored part of New York City, Brooklyn has for decades held its own identity within the city, usually in variance with more self-conscious Manhattan. However, in this most recent decade, we have seen a shift in that identity. Increasing gentrification and a multitude of new residents have transformed the area and created an unfortunate spike in house prices in their wake. An area that was once populated by longtime family residents and iconic brownstones, is now seeing giant penthouses selling for upwards of $4 million. In fact, as early as 2012, we were already seeing Brooklyn being labeled as the second most expensive place to live in the US.

Brooklyn neighborhoods like Park Slope, DUMBO, Downtown and Williamsburg have seen an influx of new residents along with the resulting spikes in real estate prices. Even the recent trend of supertall residential buildings springing up throughout Manhattan has begun to infest Brooklyn, with developers planning new towers much taller than anything the borough has seen in the past. While longtime Brooklyn residents with rent-controlled and rent-stabilized properties, as well as current Brooklyn homeowners, have little to worry about, all of this is making for an increasingly prohibitive market for anyone hoping to move to the borough.

The result of all of this has been a natural shift in the popularity of Brooklyn as a viable destination for new, young residents. So, while—not too long ago—Brooklyn was being touted as the new Manhattan, we are now seeing a rise in other cities vying to claim the coveted title of becoming the “new Brooklyn.” Of course, both of these New York boroughs will still remain popular, but generally younger people, at least those without jobs at Goldman Sachs or trust funds, simply cannot afford the new and skyrocketing prices required to make them their new home.

Thus, with Manhattan and Brooklyn now both out of reach for many New York real estate shoppers, the much maligned state of New Jersey is suddenly becoming more appealing; and in particular, we are seeing the rise of the conveniently located municipality of Jersey City. Jersey City is located directly across the Hudson River from downtown Manhattan, and just like New York in the early 1990s the city is fast shedding its once dangerous reputation and emerging as an appealing option as a uniquely livable area.

At one time, most residents of the area east of the Hudson River lumped Jersey City into “everything west of the Hudson.” In other words, it was dismissed out of hand immediately. However, more people are starting to learn that Jersey City is its own unique location, itself comprised of a number of distinct neighborhoods with individual charms and flavors. And most important of all, affordability.

“Three or four years ago, when you would mention Jersey City to people who didn’t know the area, you’d get a concerned look,” Natalie Miniard, the owner of JCity Realty, told the New York Times, “now everybody wants to know more. It’s a much different conversation.”

Generally the most desirable section of Jersey City for newcomers is downtown, thanks to its proximity to the Hudson River and concentration of trendy bars and restaurants. Popular spots here include the Jersey City location of Brooklyn's Barcade, Skinner's Loft, the Iron Monkey and the Roman Nose.

And it’s convenient, too. Right in the middle of downtown Jersey City is the Grove Street PATH train station. Like every PATH station in Jersey City, Grove Street offers speedy service to several locations in Manhattan 24 hours a day, seven days a week. Unlimited monthly PATH cards are actually cheaper than monthly NYC subway Metrocards, and you can even use pay-per-ride Metrocards on the PATH. As an added bonus for residents, surrounding the Grove Street station is a pedestrian plaza which regularly hosts food fairs and street festivals.

Of course, the gentrification train chugs on, and as with the more popular neighborhoods in Brooklyn, downtown Jersey City is already becoming so popular that many new residents are seeking even more affordable sections of the city. One such neighborhood is Journal Square, which is in close proximity to the Journal Square PATH station. Local flavor abounds in the Journal Square area, and prices in the neighborhood are still lower than downtown, despite being not too far in distance. A bit further from downtown Jersey City is the neighborhood known locally as the Heights.

The Heights is a large section of Jersey City with plenty of lower priced options for real estate shoppers, thanks in part to being not quite as close to the PATH as Journal Square or downtown. However, the Heights is an area jam-packed with plenty of its own great shopping and local restaurants, especially along the main thoroughfare of Central Avenue. Most of the Heights is still within reasonable walking distance to the Journal Square PATH station, and walking from the Heights to the nearby city of Hoboken is also an option.

With a variety of lively, singular neighborhoods and close proximity to Manhattan, Jersey City already boasts several parallels with the borough of Brooklyn. Though it cannot yet compete in terms of culture and “street cred,” developers are rushing to construct tens of thousands of new, affordable residential properties, hopping on the newest fashionable real estate bandwagon while it is still hot. What this means is that it is certainly the right time to move to Jersey City. Housing prices are lower across the board than in most sections of Brooklyn—and certainly anything in Manhattan—and the options for condos, rental apartments and even entire houses are multiplying by the day. And people are starting to take notice. An increasing influx of residence—according to the most recent US census data, the total number of residents increased by six percent between 2010 and 2014— revitalizing the cultural and social scene, and many more people are expected to soon follow. With all of this in mind, it would not be a surprise if in the next few years we find fewer people moving to New York City altogether, and many more looking to the exciting reborn metropolis of Jersey City.

Cary is an Oregon native with a flair for fashion and organic gardening. She's passionate about writing and enjoys hiking, reading, and cooking. When she isn't writing about economics and real estate, or health and fashion, she is playing with her rescue pitbull, Mazie. 

Your City Is Not the Next Silicon Valley

$
0
0

“No man needs sympathy because he has to work, because he has a burden to carry,” began Theodore Roosevelt, the U.S. president from 1901 to 1910. “Far and away the best prize that life offers is the chance to work hard at work worth doing.”

No doubt, during Roosevelt’s time there was much work to do. In 1910, for example, nearly 40% of the country was still employed in agriculture. The percent of workers in industry—or manufacturing, construction, and mining—was at 30% and rising, driven by the revving of the Industrial Revolution.

So, 70% of the country’s workforce made a living through labor. They made food to eat and the steel, railroads, cars, bridges, and buildings that modernized America.

Cleveland was a prime benefactor. The manufacturing sector alone employed nearly 307,000 Clevelanders by 1967.

But things changed. Labor-intensive industries matured, which ultimately means taking less people to produce more output. The percentage of the American labor force employed in agriculture stands at 2%, down from nearly 70% in 1840. This doesn’t mean we eat less food, but that technological advances have made the food sector ultra-efficient.

Industry has been experiencing the same forces. Twenty percent of Americans are employed in manufacturing, mining, and construction. In the manufacturing sector, the national percentage is 8%, with Cleveland at 12%—down from 21% in 1990. Again, this doesn’t mean we don’t manufacture things— manufacturing output is at an all-time high nationally—it’s just that we need fewer people to produce more goods.

Okay, so where do people work? The simple answer is services, or those sectors that make up the economy outside of agriculture and industry. Think legal, marketing, business, technology, education, healthcare, and hospitality. For instance, 20% of the nation worked in services in 1840. By 1960 that number was over 50%, before reaching nearly 80% by 2010.

These numbers illustrate a shift in the U.S. economy over time, or from goods producing to service providing. To a large extent, these services are based on the production of ideas.

Writing in the Harvard Business Review, the University of Toronto’s Roger Martin dubs this change the “rise of the talent economy”. Martin notes that in the 1960s, 72% of the top 50 U.S. companies owed their wealth to “the control and exploitation of natural resources.” Today, however, only 10% of the nation’s top companies are industry-based. Instead, over 50% of America’s companies are talent-based, such as Google, Apple, and Microsoft.

“Over the past 50 years the U.S. economy has shifted decisively from financing the exploitation of natural resources to making the most of human talent,” writes Martin.

Enter Silicon Valley. As Pittsburgh was to steel and Detroit to cars, Silicon Valley has been to the talent economy, particularly technology. It was there that the top minds clustered to design new-age circuits and microprocessors in the 1950s and 60s. It was also there that the best software engineers went to birth the internet, search engine, and social media in the 1990s and 2000s.

On the backs of this talent came the wealth, not only the venture capital that has continually acted to “water” the region’s innovation, but also the rising wages of the workers. In fact, in Santa Clara, C.A., the county seat of Silicon Valley, the average salaried employee makes over $103,000 annually, approximately double that of Cuyahoga County employees and the U.S. workforce as a whole.

The successes of Silicon Valley have led many regions to devise their own strategy to be a technology hub. Simply, there existed an “old” economy, so how does a region transition into the “new” economy, primarily one embodied by the high-end services and start-up culture of Northern California?

Often, the tactics are rudimentary, like branding a part of your region as “Silicon X” so as to attract the components of a tech cluster. For instance, Philadelphia has “Philicon Valley” and New York has “Silicon Alley”, whereas New Orleans has “Silicon Bayou” and Portland has “Silicon Forest”. There’s “Silicon Swamp” in Gainesville, “Silicon Slopes” in Utah, “Silicon Harbor” in Charleston, and a variant of “Silicon Prairie” in Dallas, Chicago, Omaha, and Jackson Hole, Wyoming.

Then, once you brand a part of your region “Silicon X”, the next step is to get the story out. A recent piece in Charleston Magazine entitled “The Rise of Silicon Harbor” is illustrative on this front. The author opens the piece by explaining that in Charleston there are “three local tech companies, all within three miles of each other”. The author then quotes a media outlet that states Charleston’s “Silicon Harbor is on its way to becoming the East Coast counterpart to California’s Silicon Valley”.

This idea that your region can become the “next Silicon Valley”, well, its clickbait for online journalism—if only because folks wantto believe their hometown is the place of the future.

For example, a recent Huffington Post piece hints “You Might Be Living in the Next Silicon Valley”. “Could Detroit become the next Silicon Valley?” echoes the industry magazine CIO. Meanwhile, a NewYorker piece is titled “How Utah Became the Next Silicon Valley”, while an Oklahoma story is headlined “Vision proposal aims at Tulsa being the next Silicon Valley”.

Still, if everywhere is the next Silicon Valley, then nowhere is the next Silicon Valley. That’s the reality, and it’s important for cities to grasp it so they can plan their economic futures properly.

“When it comes to tech, nobody can simply create the next Silicon Valley,” explains Aaron Renn, a Senior Fellow at the Manhattan Institute.

“Just because a place has a number of startups doesn't mean it's destined to be a Silicon Valley,” Renn continued. “By all means celebrate a growing tech industry, but don't get carried away.”

But the bigger issue for regions looking for their economic future in Silicon Valley’s past is whether or not that’s even a sound strategy in the first place. Specifically, the tech economy is also a maturing, prone to the same job contractions, offshoring, and wage declines that hallmarked deindustrialization.

According to data compiled by the Institute for Strategy and Competitiveness, four out of the top five tech clusters in the United States lost jobs from 1998 to 2013. San Jose, CA, the metropolitan area comprising Silicon Valley, led the way in contraction, going from nearly 160,000 tech jobs in 1998 to fewer than 74,000 in 2013—a decline of 54%. Telling, automotive employment in Detroit declined by less over the same time period, at 32%.

These figures are in line with a new study out of Oxford University that found that while technology start- ups often create a lot of wealth, they are not good at creating many jobs. The study found that only 0.5% of the American workforce in 2010 were employed in industries that did not exist in 2000.

“What I think the Oxford study is saying is that you’re not getting the kind of job growth from these kind of high-tech, high-growth, high-profitability startups that you had in the past,” said economist Jim Pethokoukis in the industry magazine Re/code.

Why? A primary culprit is that tech jobs are becoming automated, just like farm and factory jobs before it. Specifically, tech companies over the last 15 years don’t need to hire as many people as they did in the 90’s because the software — loosely described as machines — is doing the work.

For Jim Russell, the economic development blogger at Pacific Standard, the aging of the tech industry— Russell uses the term “tech convergence”—has echoes in the decline of industry. Russell discusses his life growing up on the run from macroeconomics, going from Erie, PA, to Schenectady, NY, to Vermont as his father, a General Electric engineer, tried to keep ahead of the wave of contractions.

“He had an uncanny knack for moving our family just before the layoffs hit,” said Russell. “We were always racing to stay ahead of the economic restructuring.”

Russell, whose wife is in tech sales, is experiencing the same game of cat and mouse today.

“The tech industry enjoyed divergence until the end of the 1990s,” he’d note, explaining there were “fatter” times in emerging tech hubs like Boulder—where they’d lived.

“But then the bubble burst,” Russell explained, “resulting in massive layoffs. Good friends were out of work.”

Today, his family lives in Northern Virginia. That’s because it makes no economic sense for firms to house tech sales in Silicon Valley. This is partly due to the exorbitant cost of living in Northern California. But it is also due to the emergence of cloud computing, which has pushed tech everywhere— meaning tech hubs are increasingly nowhere.

This maturation of tech has Russell wondering “whether Silicon Valley is the next Detroit”.

Does this mean technology is no longer integral in regional economic growth? No. It just means the tech industry is changing. Detailing this change can both sharpen, if not make more realistic, a regional innovation strategy.

According to the Manhattan Institute’s Aaron Renn, the issues boils down to this: “Do you have proprietary industry to marry to tech?”

What Renn is getting at is the fact that tech in itself is a tool. It is by and large circuitry that allows access to information. But information is not knowledge. To give an example, information is the medical textbook, while knowledge is the application of information to become a heart surgeon. In other words, in what fields of applied knowledge can technology be tied to so as to further a given regional industry?

Most recently, tech has been tied to the entertainment or leisure industry. “Silicon Valley started with tech for the sake of tech: making computers, search engines, and software,” says Cleveland technologist Eamon Johnson. “Now it's 20-something dudes making solutions to replace what their mom did for them at home…laundry, food, rides around town, and recommendations on where to eat.”

According to Johnson, the coming evolution of innovation is to use the next generation of computing power to go beyond tech’s capacity to distract or consume.

“But techies need industry experts to give them problems so solutions can be worked on,” he says.

This exactly what is happening in Cleveland with healthcare. Cleveland observes, treats, and innovates within the field human health like few other regions worldwide. As a result, the field of medical technology, or medtech, is gaining some traction in the region.

This is evidenced by IBM’s recent acquisition of the Cleveland Clinic-spinoff Explorys, which is a “big data” health analytics firm. The company, based in Cleveland’s University Circle, is expanding its Cleveland office, perfecting its processes of how the region’s elite health “know-how” can be further mined through technology—thus creating more knowledge, and then more health innovation.

These kind of developments are important. Medtech is still a frontier industry, and it fits in well with Cleveland’s area of specialization. So there’s plenty of room for a first mover advantage if the region can gets its medtech playbook right.

Now, is medtech cool? Well that depends on your definition of “cool”. "You can work for a cool tech company with a texting app," said Explorys’ Charlie Lougheed to the Plain Dealer recently. "Or you can work for a company that improves health for millions of people."

Returning to Teddy Roosevelt: that is a lot of work, and a lot of work worth doing.

Richey Piiparinen is a Senior Research Associate who leads the Center for Population Dynamics at the Levin College of Urban Affairs at Cleveland State University. His work focuses on regional economic development and urban revitalization.

What Price Urban Density?

$
0
0

We regularly hear the argument that living in a compact city is more affordable than living in one that is more spread out. But what does the data actually show about the cost of housing in compact cities, and the cost of transport in these dense places? The relationship between those two expenses and the compactness of a city could tell us much about which kinds of places are most affordable, since those two costs together dominate household budgets.

Advocates of denser urban environments have developed an index to measure the effects of a range of aspects of city living, such as vehicle miles traveled, traffic safety, congestion, the cost of housing, the cost of transportation, and health outcomes, among many other issues. The index takes into account several metrics, such as density, street accessibility and the mix of land uses.

The index was conceived with the intent to study presumed negatives of city growth, and to make such growth “smarter.” Since the impulse to create it was advocacy-driven, it may lack objectivity. Notwithstanding this potential bias, and lacking alternative data, we used it as the default measure for our analyses, and consider our work a chance to test the validity and reliability of the index.

First, we looked at housing costs. Casual and investigative observers seem to agree that housing costs do rise with city compactness. A recent report on the effects of compactness determined that housing costs increased by 1.1% for every 10-point increase in the compactness index. Other researchers have come to similar conclusions, using only population density as an indicator.

Chart 1, which plots data from the 2015 Consumer Expenditure Survey, confirms this general agreement on the correlation between compactness and housing costs. But questions arise from the sharp differences between pairs of cities.

For example, Boston and Atlanta residents use the same percentage of their budgets — 33% — for housing. Yet Boston’s compactness index is at least 90 points higher: 37.4 for Atlanta, vs 126.9 for Boston. According to Smart Growth theory, that difference should bring housing expenditures for Bostonians to 43%, about the same level that is experienced by New Yorkers.

In another comparison, Boston and Miami differ little in compactness: 126.9 vs 112. Yet these two cities differ substantially in the percentage of household budget residents devote to housing costs - 33% vs 39%.

Clearly, in both these examples and in the chart above, compactness is but one of many factors and, perhaps, not the dominant one in the relationship between a city's housing costs and its compactness. Others need to be identified, quantified and incorporated. The trend, however, is indisputable: Greater compactness increases housing costs.

Do transportation costs follow the same trend?

According to theory, cities that are more compact offer more transport options, particularly public transit systems, some of which, like subways, outperform all other modes for time — especially work commute time — and provide travel options that are more affordable. Walking and biking may also be alternate means of mobility that help hold down household transport expenditures in compact cities. The association between density and high non-auto share of trips has already been demonstrated.

Consumer Expenditure Survey data from 2015, when plotted, confirms this assumption. Chart 2 shows a decreasing proportion of the household budget being used for transportation as a city’s compactness index increases.

However, as with housing costs, a close look at the differences between paired cities raises questions. Atlanta and Philadelphia share the same percentage of household budget expenditure on transport, 16%. Yet they differ by 70 points on the compactness index, 37.4 vs 109.05. Meanwhile, Washington and Seattle register an almost identical compactness index — 107.6 vs 104.6 — but the latter, contradicting theory, has transportation costs that are 3 percentage points lower, even though it lacks a subway. Both these cases demonstrate that the current model for measuring the impact of compactness needs fundamental refinements to improve its predictive value.

So far, the data show two countervailing trends: Housing costs rise with compactness, while transportation costs fall. This finding leaves the question of whether more compact cities are more affordable to live in, at least with respect to these two expenditures that consume about half of a household’s budget.

Using the same data from the CES for the 18 cities, we plotted the results of combining the two expenditures, as a percentage of the household budget.

Chart 3 shows an inverse, albeit weak, association of compactness with combined household expenditures of housing and transportation. It clearly does not indicate that more compact cities are more affordable for the average household. Upon a closer look the chart reveals some instructive surprises.

First, Atlanta appears among a group of five most affordable cities, even though it has by far the lowest compactness index (40.9) of all eighteen cities in the CES survey. According to traded wisdom, its transport costs, being almost entirely based on automobile travel, should overwhelm its housing expenditures.

Contradicting theory, Atlanta posts next to lowest average housing cost ($16,316/year), and also one but lowest transportation costs ($8,086/year). When considering that average income in Atlanta is on a par with that in Los Angeles ($69,821 vs $69,118), and that its compactness index is 80 points lower than LA’s, its comparative affordability challenges current thinking about compactness and its effects.

Second, four cities hover around the same point of the index (#110), yet they cover almost the entire gamut of budget percentage expenditure (49% to 54%) for combined housing-plus-transport costs. The same is true for five cities aligning around the #130 of the index.

It's apparent that current theory falls short of adequately explaining field data. A city planner would find little comfort in knowing that a fourfold range of compactness can be equated with the same level of affordability, or that the same level of compactness can be associated with a wide range of combined transportation and housing expenditures. If anything, these results suggest that, because average housing expenses are double those of transportation, a yet-to-be-determined density ceiling might be an effective means of increasing a city’s affordability.

The CES data is only a snapshot in time that may reflect transient conditions, such as gasoline prices, local inflated real estate markets, congestion levels that affect gas consumption, effectiveness and reach of public transit and so on. Variability in these factors will always affect the average transport and housing expenditures. A predictive model should be robust enough to handle such fluctuations, if it is to have practical value.

Yes, greater compactness is associated with higher housing costs and lower transportation costs. But, contrary to unsubstantiated assertions, when these are combined, the result is less — not more — overall affordability.

Fanis Grammenos heads Urban Pattern Associates (UPA), a planning consultancy. UPA researches and promotes sustainable planning practices including the implementation of the Fused Grid, a new urban network model. He is a regular columnist for the Canadian Home Builder magazine, and author of Remaking the City Street Grid: A model for urban and suburban development. Reach him at fanis.grammenos at gmail.com.

Flickr photo by Tim Bartel of a San Francisco neighborhood

Suburban Sustainablity

$
0
0

There’s a philosophical debate about what is “sustainable.” The two dominant camps tend to advocate on behalf of either the hyper efficient dense city or bucolic rural self sufficiency. Personally, I’m not a fan of either.


The more finely tuned and efficient any system is the more vulnerable it is to disruption. There’s also an inevitable concentration of authority in large systems that doesn’t appeal to me.

Screen Shot 2015-06-07 at 2.31.03 AM

The picturesque farm out in the country has a romantic allure, but the reality is mostly isolation, lack of economic opportunity, and a stifling culture.

Almost all of the built environment in North America is actually suburban which is neither fish nor fowl in terms of the urban/rural divide. And that isn’t going to change anytime soon.

Screen Shot 2016-02-16 at 9.20.34 PM

At the moment suburbs have none of the efficiencies of the urban core and none of the productive capacity of the countryside. Suburban residents are just as dependent on large centralized systems as people living downtown. Where does suburban food come from? Energy? Water? Where does suburban trash go? Sewerage? Who owns everything? (If you have a mortgage… the bank, not you.) A small family farm in the country can manage all these things right at home on a tight budget. But the average tract house is no different from a high rise apartment.

Screen Shot 2016-02-17 at 1.12.42 PM

Screen Shot 2016-01-30 at 10.24.54 PM

That private vehicle that sits in the driveway appears to be a source of personal freedom unlike the city bus or subway. But the car is invisibly tethered to gas stations, pipelines, refineries, and ultimately to the oil fields of North Dakota, Venezuela, and Nigeria by way of massive corporations and no small amount of Big Government. Wall Street also finances these cars as well, so add that to the mix of dependencies. Suburbanites believethey’re more independent than city people. They aren’t.

unnamed

Screen Shot 2016-01-30 at 4.56.01 PM

Screen Shot 2016-01-30 at 7.17.32 PM

Screen Shot 2016-01-30 at 7.10.47 PM

Screen Shot 2016-01-30 at 7.13.20 PM

Segovia 054 (800x600)

Screen Shot 2016-01-30 at 7.08.44 PM

Historically this tension between efficient urbanism and rural productivity was resolved by building compact medium density towns that were immediately surrounded by farmland. Economic opportunity, high culture, and great efficiencies were baked in to every level of the built environment. Take a fifteen minute walk from the center of town and you’ll find water, grain, grazing livestock, orchards, and all other essentials for supporting the population. A two thousand year old settlement like this one in Spain demonstrates pretty clearly that this is a sustainable model. But how does it relate to American suburbs?

Screen Shot 2016-01-30 at 5.29.30 PM

Screen Shot 2016-01-30 at 5.29.11 PM

Screen Shot 2016-01-30 at 10.03.43 PM

Screen Shot 2016-01-30 at 10.04.38 PM

Screen Shot 2016-01-30 at 10.04.57 PM

Screen Shot 2016-02-18 at 12.40.44 AM

Screen Shot 2016-02-01 at 2.27.06 AM

Screen Shot 2016-01-30 at 10.24.23 PM

The typical suburban home is surrounded by a modest patch of garden. Instead of growing a lawn (the largest single crop in North America) the land could be producing fresh food. Ornamental shrubs and specimen trees could just as easily be fruit bearing. No need to truck in refrigerated lettuce from 1,500 miles away. The supply chain is effectively reduced to a matter of feet. There’s no need for battery hens from a distant factory farm. This transforms a consumptive landscape into a productive property. No one is suggesting this is “self sufficient”. But it’s a huge step up from having a kitchen full of Lean Cuisine, Fruit Loops, and Go-Gurt from the supermarket.

Screen Shot 2016-01-30 at 10.23.22 PM

Screen Shot 2016-01-30 at 10.21.38 PM

Screen Shot 2016-01-30 at 10.23.06 PM

In addition to home gardens suburbia is full of places that can be transformed into community gardens. Every church, school, and vacant parking lot is a potential veggie patch or orchard.

Screen Shot 2016-02-18 at 12.23.05 AM

Screen Shot 2016-02-17 at 1.13.15 PM

This solar water heater is the biggest bang for the green buck. A couple of tanks, some black boxes covered in glass, a little pump… and you’ve got free hot water for decades. The cheapest and greenest energy is always the power you don’t need to use in the first place.

Screen Shot 2016-02-18 at 12.17.53 AM

Screen Shot 2016-02-17 at 1.13.26 PM

A modest number of photovoltaic panels can often provide nearly all the electricity for a suburban home, particularly if the house was first fitted with high efficiency lights and appliances. Combine this with loads of insulation, solar hot water, and a food garden and a suburban home begins to resemble a small family homestead in the country.

Screen Shot 2016-01-30 at 10.58.30 PM

Screen Shot 2016-01-30 at 10.56.36 PM

Screen Shot 2016-01-30 at 2.14.11 PM

Screen Shot 2016-01-30 at 2.14.28 PM

Screen Shot 2016-01-30 at 2.14.46 PM

Screen Shot 2016-01-31 at 2.44.44 AM

Screen Shot 2015-09-09 at 11.58.24 PM

The weakest aspect of suburbia has always been the impoverishment of the public realm. Suburbs are first and foremost about private space. In order to become more vibrant parts of the suburbs need to be activated with shared community spaces. These strip mall parking lot cafes may not resemble Paris, but they do the job in a straightforward cost effective manner. The food is good. The company is pleasant. Commerce and culture can start to take baby steps. If many more such places are allowed to gradually evolve and connect they might eventually turn in to something more refined and dynamic.

Screen Shot 2016-02-01 at 2.52.37 AM

Screen Shot 2016-02-01 at 2.53.06 AM

There will always be people who prefer to drive no matter what. And the suburbs do provide serious challenges when it comes to alternative forms of mobility. Public transit rarely works well in dispersed sprawling environments. Honestly, I don’t think it’s worth even trying to serve most suburban neighborhoods with transit. But knitting together the viable parts of suburbia with bike infrastructure is so incredibly cheap that it’s worth doing in places where people value the option. Most folks may still drive, but they may not need to do it nearly as often if walking and biking are at least reasonable options.

Screen Shot 2016-02-17 at 1.10.51 PM

While I’m at it, I’d like to describe what isn’t sustainable. Massive solar arrays on suburban rooftops appear to be a step in the right direction. But look closer. This homeowner could have installed far fewer panels and spent the remaining money on added insulation and energy efficiency instead. But being frugal and productive was never really the goal here.

Screen Shot 2016-02-17 at 1.12.17 PM

Screen Shot 2016-02-17 at 1.11.46 PM

Next to the sterile lawn are all sorts of toys that run on liquid fuels. I’m not saying people shouldn’t have playthings. I’m saying these items are expensive and disposable and were almost certainly bought on credit. The extended cab pick up truck has never seen a sheet of plywood, an eight foot length of pipe, or a bale of hay. It’s sport. Not utility. The speed boat isn’t exactly built for fishing. This is standard suburban debt and consumption. It’s fragile and unlikely to hold up well over the long haul.

John Sanphillippo lives in San Francisco and blogs about urbanism, adaptation, and resilience at granolashotgun.com. He's a member of the Congress for New Urbanism, films videos for faircompanies.com, and is a regular contributor to Strongtowns.org. He earns his living by buying, renovating, and renting undervalued properties in places that have good long term prospects. He is a graduate of Rutgers University.

What Happens When Walmart Dumps You

$
0
0

The first knock on Walmart was that it gutted the mom-and-pop businesses of small-town America. So what happens to those towns when Walmart decides to leave?

What is the future of American retail? The keys might be found not only in the highly contested affluent urban areas but also in the countryside, which is often looked down upon and ignored in discussion of retail trends.

Yet these small towns, as well as middle- and working-class suburbs, have produced many of the dominant trends in American retail, from discount chains to super-stores. So, too, could these communities create a new trend, as some of the former innovators, such as Walmart, have begun to close stores, leaving some towns and villages bereft of convenient, affordable retail.

This year the world’s largest retail chain announced it was closing 154 stores, most of them “express” centers and other smaller stores that serve primarily small-town and urban markets, such as Oakland, California. The effect has been worst in poorer towns, notably in the Southeast and Appalachia, where there is little alternative retail in place.

Walmart’s move, driven by flagging sales and profits, represents a shift away from the very working-class and small-town customers who drove its rise. It also reflects a growing disinterest among retailers in serving the nation’s beleaguered middle and working classes. One in six Walmart customers, notes one University of Michigan study, received food stamps in 2013, with an estimated average household income of $40,000 or less.

In contrast, online shoppers, now a primary focus for Walmart, tend to be more affluent, with 55 percent of e-commerce shoppers living in households with incomes greater than $75,000. As Walmart and many other traditional “brick and mortar” stores have struggled with declining sales, online merchants have enjoyed an average growth of more than 11 percent annually since 2011. In this game, Walmart is clearly playing catch up.

The other big Walmart bet seems to be superstores, which compete directly with ascendant retailers such as Costco. Yet these moves are crushing for smaller towns, who are generally too small to accommodate large centers. Say what you will about Walmart—historically low wages, mediocre selection, less than attractive stores—the Arkansas-based juggernaut brought affordable products from around the world to thousands of small communities and suburbs. Before then, smaller communities often were forced to either travel great distances to more urban locations or shop at small, often overpriced local stores.

Back to the Futurem—and the Past?

Now once again small towns are threatened with becoming desiccated islands cut off from the high-precision magnificence of American retail. In some cases, they might even become “food deserts,” cut off even from reasonably priced grocery items. This includes not only small towns but some hard-luck suburbs near major cities.

No surprise then that some communities now resent Walmart for having essentially invaded Main Street, laid it to waste, and then abandoning it. Some places where Walmart have come in, such as Whitewright, Texas, a town of 1,600 in the northern reaches of the state, saw the retailer come in just last year, drive out of business some long-standing local stores, notably the longtime local grocery, and now, as part of its strategic change, leaving the town with little in the way of retail options.

Tales of “the Walmart effect” on small towns, of course, are legion. In exchange for access to more affordable goods, communities sacrificed much that was unique—the local haberdasher, the mom-and-pop mini-department stores, the one-of-a-kind hamburger joint. In the 40 years after the first Walmart opened in Rogers, Arkansas, in 1962, the number of specialty retailers declined by 55 percent nationwide. In the same time period, the number of retail chain store locations , including Walmart, nearly doubled. Research conducted at Iowa State University in the ’90s found that, after a Walmart opened in a town, sales at specialty stores—sporting goods, jewelry, and gift shops—dropped by 17 percent within 10 years.

Yet, fortunately, this may not prove to be the disaster that many predict. The new realities of retail, notably the inexorable shift toward online retail, suggests that rural communities and small towns are not as cut off as one might have expected. The ability to access Amazon in a small, remote Central Valley town in California is not much different from accessing Amazon in Los Angeles. For anyone even marginally computer literate, the retail world is more accessible than ever, but this time through a finger click than a stroll down the aisle.

The Proliferation of Channels

None of this suggests that the retreat of big boxes from smaller towns and some urban areas will be painless. Yet those who see this trend as the harbinger of the end of malls or Main Streets may be in for a surprise. Rather than die off, bricks-and-mortar shopping will change, adding new elements and moving from ever greater uniformity to more variety and differentiation, which are critical to independent business’s survival. Much of this change will take place in small towns, but also in suburban areas, which have long been the happy hunting ground of big boxes.

Why not in the big cities? One of the chief ironies of our times is that chains and their attendant sameness now define much of our most sophisticated urban core—Starbucks on every corner, global brands and restaurants serving the same trendy cuisine. The recovery of large cities, suggests New York researcher Sharon Zukin, has also made them more alike by “bringing in the same development ideas—and the same conspicuous textual allusions and iconic corporate logos inevitably affixed to downtown architectural trophies—to cities across the globe.” Efforts to make the city “safer and less strange to outsiders’ eyes”—tourists, expatriates, media producers, and affluent consumers—are making one global city barely indistinguishable from another.

At the same time suburbs and even smaller towns are becoming more diverse, and one of the chief causes of this diversity is the spread of millennials, with their own specific needs, into the peripheral areas surrounding core cities. This movement, once dismissed as inconceivable by some urbanists, is becoming more evident as census data show. And with more millennials entering their family-forming years, suggests economist Jed Kolko, this trend to suburbs and possibly smaller towns will only accelerate.

The other great game-changer has been the rapid movement of ethnic minorities, particularly immigrants and their descendants, to suburbia. Roughly 60 percent of Hispanics and Asians already live in suburbs; more than 40 percent of non-citizen immigrants now move directly to suburbs. Between 2000 and 2012, the Asian population in suburban areas of the nation’s 52 biggest metro areas grew 66.2 percent, while in the core cities the Asian population expanded by 34.9 percent. Of the top 20 cities with an Asian population of more than 50,000, all but two are suburbs.

As ethnics and millennials gather in suburbs and even small towns, we are starting to see the emergence of new retail forms in suburban areas. Orange County, California, for example, has long been seen as an area dominated by chains, and the largely suburban county is indeed sprinkled with scores of shopping centers, some of them massive, ranging from more working-class shopping centers in such cities as Orange or Santa Ana to more elite retail centers such as South Coast Plaza and Newport’s Fashion Island.

Yet at the same time, the area is seeing the growth of new, unique retail districts that appeal to millennials, ethnics, and their descendants. Anaheim, for example, heretofore known for Disneyesque blandness, now features a thriving Packing District, a converted fruit-packaging structure now filled with numerous vendors, most of them local products such as confectionary, ethnic food and locally brewed beer. Several other projects, many in former office parks, have opened in places like Costa Mesa, drawing large numbers of suburbanites to unique agglomerations of smaller stores.

Ethnic change is also transforming the retail environment in both suburbs and smaller towns. Throughout Southern California, Chinese, Korean, Vietnamese, and Mexican markets now proliferate. New developments in places like Irvine—now roughly 40 percent Asian—are filled with ethnic restaurants, shops, and boutiques. Similar trends can be seen in the emerging immigrant hubs, notably in Dallas-Fort Worth and Houston, but also in parts of New Jersey, Westchester, Northern Virginia, suburban Chicago, and in Seattle suburbs like Bellevue and Federal Way. Even the main street in Grand Island, Nebraska, home to meatpacking plants, is lined with, of all things, Honduran, Salvadoran, Mexican, and Haitian restaurants.

At the same time, numerous suburban communities, particularly those with old downtowns dating from their agricultural pasts, have revived their own Main Streets. These areas may have a Walmart or Target nearby, or even adjacent, but now they also sport shopping, restaurant, and other cultural options, as well as an opportunity for promenading, once an important small-town activity. The list of communities doing this extends from places in Southern California—such as the old towns of Orange, Fullerton, and Laguna Beach—to older eastern towns like Montclair, New Jersey; Rockville Centre on Long Island; Naperville outside Chicago; as well as Carmel, Indiana. We may not be returning to Bedford Falls before the onslaughts of banker Henry Potter in It’s a Wonderful Life (1946), but smaller towns and suburban shopping area may prove far better able to adjust to the digital age than many suspect.

Retail’s Increasingly Diverse Future

Despite the erosion from online sales, the country’s retail structure is not about to go away. Even though overall department stores are doing poorly, as are some malls, many are also doing well, particularly in ethnic areas and more affluent suburbs. The importance of brick-and-mortar retail is still compelling enough that even Amazon may soon build its own physical bookstores; several other online sites have already done so.

Of course, not all communities or Main Streets will thrive as the Walmarts and other large chains begin to cut back. There will indeed be many communities that continue to depopulate as younger people move away, and there is little hope that large retailers will come back to such places as markets dwindle and as more shoppers order online.

Yet not all small towns, much less suburbs, face such a difficult future. Many smaller communities, particularly in attractive parts of the country, are beginning to see a wave of migration from aging boomers, who arrive with both significant cash and also often well-developed consumer tastes. Far more seniors, for example, retire to rural or semi-rural communities (PDF) than to urban districts. In certain areas—for example, Rocky Mountains towns, parts of inland California, and the hill country of Texas—may find their retail base growing, even if this means very different kinds of stores and services.

Some small towns—and suburbs even more so—will be transformed by immigrants and millennials, who may want to set up their own unique shops along the very Main Streets once targeted by firms like Walmart. In wealthier communities, this may mean more boutiques and high-end restaurants. But among less affluent areas, other institutions, such as cooperatives—300 already nationwide and another 250 on the way, as well as farmers markets—could provide some of the products that many once found at Walmart.

These changes may prove far more positive in the long run than many anticipate. A future with a slightly lower Walmart or other big-box footprint poses not just a challenge to communities once seen as unable to resist mass retailing but also a once in a lifetime opportunity. As the retail world become more digitally focused, and less big-box-dominated, there is a golden opportunity to restore the geographic and local diversity that has seemed doomed for nearly a half-century, but now may enjoy a new burst of life.

This piece originally appeared in The Daily Beast.

Joel Kotkin is executive editor of NewGeography.com. He is the Roger Hobbs Distinguished Fellow in Urban Studies at Chapman University and executive director of the Houston-based Center for Opportunity Urbanism. His newest book, The Human City: Urbanism for the rest of us, will be published in April by Agate. He is also author of The New Class ConflictThe City: A Global History, and The Next Hundred Million: America in 2050. He lives in Orange County, CA.

Wal-Mart photo by Mike Kalasnik from Fort Mill, USA [CC BY-SA 2.0], via Wikimedia Commons

Japan Census 2015: Decline Less than Projected

$
0
0

Headlines were recently made recently as Japan finally experienced a long predicted official decline in population. This is widely expected to be the beginning of a long decline in population, which the National Institute of Population and Social Security Research has projected will drop Japan’s population from its present 127 million to 43 million by 2100 (Chart). This loss equals or exceeds the population of all but 15 of the world’s nearly 200 nations, including Germany, the United Kingdom and France.

Population projections are, of course, not an exact science. They can be accurate, or they can “miss by a mile.” The preliminary 2015 census figures indicate that the population loss since 2010 has been considerably less than predicted. Japan lost 950,000 residents since between 2010 and 2015,The previous 5-year census period had shown a gain of 280,000. Losing nearly a million population is a big deal. But losing 1.5 million would have been an even bigger deal, as had been projected by Japan’s National Institute of Population and Social Security Research. Over the past five years, Japan’s population loss was more than one-third less than expected (35 percent).

The big question is “why?” The most obvious answer is a combination of factors, such as   more births than projected or a falling death rate. The Japanese enjoy long lives. In 2013, there were more people aged 100 or above than in the United States, despite, Japan’s 60 percent lower population. More than one in eight of the world’s centenarians live in Japan, while only one in sixty of the world’s people is Japanese.

No analysis has been identified, nor is the detailed age data for such an analysis readily available. This is to be expected this soon after publication of the first census results. However, recent media reports indicate a continuing annual decline in births. The difference could also be the result of problems in the projection methodology.

Actual and Projected Population by Area

As had been the case in the last census period (2005-2010) Tokyo was the big winner. Tokyo prefecture (note), which contains the 23 ku (cities) that constituted the city of Tokyo until its mid-1940s dissolution as well as suburbs, was expected to gain 190,000 residents, but added 355,000. Overall, the four-prefecture area of Tokyo-Yokohama, which includes Tokyo, Kanagawa, Saitama and Chiba prefectures added more than 500,000 residents, compared to the expected 275,000. The gain in Tokyo-Yokohama was 1.4 percent, nearly double the 0.8 percent expected.

The other two megacities (over 10 million population) did not do so well. Osaka-Kobe-Kyoto (Osaka, Hyogo, Kyoto and Nara prefectures), which is larger than the Los Angeles-Riverside combined statistical area, lost 140,000 residents, nearly as many as the 164,000 projected. Osaka-Kobe-Kyoto was expected to lose 0.9 percent of its population, and nearly equaled that, at minus 0.8 percent.

Nagoya, including the prefectures of Aichi, Mie and Gifu, lost 13,000 residents, two-thirds the 19,000 projected. Nagoya lost 0.1 percent of its population, slightly better than the minus 0.2 percent projected.

The middle-sized metropolitan areas did better. The prefecture of Fukuoka, which includes the nation’s fourth largest metropolitan area, Fukuoka-Kitakyushu was expected to lose 0.5 percent of its population, Instead it managed a 0.5 percent gain. Hiroshima was expected to lose 1.2 percent of its population and lost only one-half that much (minus 0.6 percent).

The city of Sapporo, in Hokkaido prefecture, was a big winner more than doubling its projected 1.0 percent increase (Note 2). Sapporo had a population gain of 2.1 percent. Most of the Sapporo metropolitan area is in the city of Sapporo, and unlike many core municipalities, there is still room for greenfield development.

Sendai, in Miyagi prefecture was particularly hard hit by the great earthquake and tsunami of 2011. That makes Sendai’s population performance all the more impressive. Sendai was projected to suffer a population loss of 1.8 percent. Yet, its population loss was two thirds less, at 0.6 percent.

The balance of the nation even did better than expected. Outside the metropolitan areas listed above (and the city of Sapporo), Japan was expected to lose 2.7 percent of its population. The loss was somewhat more modest, at 2.4 percent.

Government Concern

Despite the better news out of the census, the government is taking the longer term population loss very seriously. Its Committee for the Future indicates that the prospect could be: “…impose a great burden on people that offsets economic growth, threatening to decrease the actual per-capita consumption level, or the metric for the actual quality and level of people’s lives.”

Even Tokyo, which has escaped the effects of population decline will be at risk, according to the Committee: The Tokyo Metropolitan area, while unable to avoid the effects of hyper-aging, will lose the vitality of a global city…”

The changing demographics are already evident in a near majority single person household population in the core Tokyo prefecture. In 2010, 46 percent of Tokyo prefecture households are single person, compared to just 32 percent at the national level, and 36 percent in Osaka prefecture, which has the second highest percentage, according to National Institute of Population and Social Security Research data. Moreover, Tokyo prefecture’s average household size, at 2.03 in 2010, was the lowest, by far in the nation, and well below the national average of 2.42. Like many core areas in the largest metropolitan areas around the world, Tokyo prefecture, less than the normal proportion of children is to be found.

The government has established a goal of increasing the fertility rate from the present 1.4 (children per woman of child-bearing age) to 1.80 by 2030 and 2.07 by 2040. This would mean a population of 102 million in 2060, compared to the 87 million that current trends suggest. This would also eventually stabilize at around 90 million, more than double the presently projected figure of 43 million.

Proposed government strategies have involved an array from expanding the use of paternity leave, making it easier for women to retain their jobs after childbirth, supporting better job security for younger people and extending to “support for matchmaking efforts by municipalities and local chambers of commerce.”

More recently, the government has even hinted at encouraging immigration, which is a radical proposal for a nation that has generally not been welcoming of a large influx of foreigners: “In February 2014, the Cabinet Office revealed that Japan will likely only be able to maintain a population of more than 100 million if it accepts 200,000 immigrants annually from 2015 and the total fertility rate recovers to 2.07 by 2030.”

There is much riding on Japan’s effort to halt or at least slow the decline of its  population. Other  nations, especially across East Asia and Europe, face similar difficulties, so Japan’s success or failure (and the latter seems more likely) could materially impact policies elsewhere in the decades to come.

Note 1: Tokyo prefecture is officially called the Tokyo metropolis, which has led many, including some researchers to imagine it to be the metropolitan area. It is simply a jurisdiction within a metropolitan area more than three times as large.

Note 2: The city of Sapporo is used, because Hokkaido prefecture is far too large to be a metropolitan area (labor market).

Wendell Cox is principal of Demographia, an international pubilc policy and demographics firm. He is a Senior Fellow of the Center for Opportunity Urbanism (US), Senior Fellow for Housing Affordability and Municipal Policy for the Frontier Centre for Public Policy (Canada), and a member of the Board of Advisors of the Center for Demographics and Policy at Chapman University (California). He is co-author of the "Demographia International Housing Affordability Survey" and author of "Demographia World Urban Areas" and "War on the Dream: How Anti-Sprawl Policy Threatens the Quality of Life." He was appointed to three terms on the Los Angeles County Transportation Commission, where he served with the leading city and county leadership as the only non-elected member. He served as a visiting professor at the Conservatoire National des Arts et Metiers, a national university in Paris.

Photo: Sapporo (by author)


The Foreclosure Crisis: At the Movies

$
0
0

If you haven’t seen The Big Short, the movie version of Michael Lewis’s fascinating book about the explosion of the housing bubble, you should see it for the entertainment value alone. The film tells an important story with humor, relative accuracy and strong acting.  It is so good that it has been nominated for an Academy Award for best picture. But the film largely ignores the experiences of the homeowners who signed notes and mortgages that backed the securities and derivatives that the film describes.  A decade later, millions of working-class homeowners are still suffering from results of the greed and recklessness so well documented by the movie.

Another recent film about the housing crisis, 99 Homes, released last spring to far less acclaim, details the pain and humiliation many suffered as their lives unraveled trying to make the payments on the predatory mortgage loans that backed those bonds. Payments on loans that never made sense became even more unsustainable when the Wall Street bubble caused housing values to crash, leaving many people with “under water” mortgages in which they owe more on their homes than they were now worth In my law practice, I try to help under water borrowers as they painstakingly work to piece their financial lives back together, stabilize their housing situation, and create a better future for their families.

The next time you walk your dog around the block in Las Vegas, Cleveland, Chicago, Daytona Beach, Toledo, or Jacksonville, keep in mind that it’s likely that the owner of every fourth house you pass probably owes more than the house is worth. Realty Trac reports that, as of the third quarter of 2015, 6,917,673 American homeowners owners are under water. In the Cleveland area, where I live and practice law, 27.2% of homes are worth less than the balance of the mortgage, the third highest rate in the U.S.  Nationally, among homes in the foreclosure process, over 50% of distressed and delinquent properties are significantly under water. With wages stagnant (the Economic Policy Institute pegs wage rate increase at 1.8% since 2000) and no home equity, many homeowners who are not already in default are just one furnace repair or roof replacement away from foreclosure.

Ironically, federal government policymakers have contributed to the lingering problem of under water mortgages. The Federal Housing Finance Agency (which was created by Congress to regulate Fannie Mae and Freddie Mac after taxpayers bailed them out) still prohibits those two quasi-governmental agencies, which hold many of these mortgages, from reducing principal when they modify delinquent loans. Principal reductions are also prohibited on loans insured by the Federal Housing Agency (FHA), a division of the Department of Housing and Urban Development, or those insured by the Veterans Administration or the United States Department of Agriculture. If homeowners can’t renegotiate these loans as the value of their houses decreases, they are even more likely to end out under water.

The Federal Government’s latest solution is to allow Fannie Mae, Freddie Mac, and FHA to sell pools of seriously defaulted loans to hedge funds at a discount. While the new policy would allow the hedge funds to reduce the principal on loans that they acquire, the servicers working for these investors have shown little enthusiasm for these potentially lucrative but logistically challenging loan modifications.  Instead, they have insisted on liquidating the properties that secure the mortgages.

Working-class homeowners seeking to modify their home loans have been further impaired by the shift of loan servicing rights from the major banks who agreed to clean up their business practices in the 2012 National Mortgage Settlement to smaller hedge fund backed loan servicers like Ocwen, Nationstar, Selene Finance, Fay Servicing, BSI, and others. These mortgage loan servicers operate on smaller margins with an often under-trained offshore workforce who fail miserably at properly re-underwriting distressed loans.

New regulations to the Real Estate Settlement Procedures Act ( RESPA and the Truth in Lending Act (TILA) promulgated by the Consumer Finance Protection Bureau set standards for mortgage loan servicing and create a private right of action for homeowners, and these policies may force servicers to become more responsive.  So far, though, there’s little evidence that servicers will change their practices. Rather, the industry seems to treat the prospect of paying money to persistent homeowners and their lawyers just a cost of doing business.

For those who have been forced from their homes by foreclosure over the past decade, the prospect of being pursued for a deficiency judgment remains. Reuters reported in 2014 that Fannie Mae was among the most aggressive investors in suing former homeowners for the difference between the balance on their loans and the price obtained by selling the property at auction.

The bottom line for working-class homeowners is that the real life consequences of the Wall Street fraud and avarice exposed in the Big Short and poignantly portrayed in 99 Homes will be with us for years to come.

Marc Dann is Managing Partner of the Dann Law Firm. He specializes in representing clients who have been harmed by banks, debt buyers, debt collectors, and other financial predators,  including a case that he recently argued before the Ohio Supreme Court. He has fought for the rights of thousands of consumers and brought class action lawsuits in both private practice and as Ohio’s Attorney General.

Mass Transit Expansion Goes Off The Rails In Many U.S. Cities

$
0
0

Journalists in older cities like New York, Boston or San Francisco may see the role of rail transit as critical to a functioning modern city. In reality, rail transit has been a financial and policy failure outside of a handful of cities.

In 23 metropolitan areas that have built new rail systems since 1970, transit’s share of commuting — including all forms, such as buses and ferries — has actually slipped a bit, from an average of 5.0 percent before the rail systems opened to 4.6 percent in 2013. The ranks of those driving alone continue to grow, having increased 14.4 million daily one-way trips since 2000, nearly double transit’s overall daily total of 7.6 million, according to Census Bureau data.

Virtually all the actual increase in rail commuting has occurred in the “legacy cities”: New York, Boston, San Francisco, Washington, Chicago and Philadelphia. These are older cities built around well-defined cores that were developed mostly before the automobile. Together the core cities of these metro areas, excluding the suburbs, accounted for 55% of all transit work trips in the nation in 2014, according to the latest American Community Survey data. Overall, transit’s work trip market share in these six metropolitan areas rose from 17 percent to 20 percent between 2000 and 2014. In the entire balance of the country, where most of the new rail systems have been built, transit’s market share is only 2.2 percent, up a scant 0.2 percentage points since 2000, according to Census Bureau data.

Manhattan alone, in fact, accounts for more than 40 percent of all rail commuters in the nation. New York is the only U.S. city where more than 20 percent of workers labor in the central business district (downtown). In most cities, the percentage is less than half of that, and in many others, even smaller. In Los Angeles, less than 3 percent of employment is downtown. In Dallas only 2 percent of metropolitan employment is downtown. In Houston, where numerous large companies maintain headquarters, it’s still only 6.4 percent.

For transit to work effectively, employment needs to be concentrated. This explains why between 2013 and 2014, New York accounted for a remarkable 88 percent of the total increase in train commuting. But what works for Brooklynites headed to Union Square does not generally work so well for people living in our increasingly dispersed metropolitan areas. Indeed in most cities — Dallas-Fort Worth, Houston, San Diego, and even the new urbanist mecca of Portland, according to 2015 American Community Survey data, where new transit lines have been put in, it has failed to increase the share of commuters who take public transportation, and in some cases the actual ridership has dropped.

It has even failed where cities are booming and their downtowns flourishing. Houston’s light rail system opened in 2004, but has done little to change the car-dominated commuting pattern of America’s energy capital. Between 2003 and 2014, Harris County’s population grew 23 percent, but transit ridership decreased 12%, according to American Public Transportation Association data. This means that the average Houstonian took 30 percent fewer trips on the combined bus and light rail system in 2014 than on the bus-only system in 2003.

The Next Great Transit City

Nowhere is the transit mania more profound than in Los Angeles, a city progressive blogger Matt Yglesias describes as “the next great transit city.”

There seems to be a conscious strategy of making auto commuting in Los Angeles and the rest of California so unpleasant as to force people into transit. Mayor Eric Garcetti has made bold predictions that commuting times will drop in half, largely by people moving from cars to trains. Of course this is folly, since transit commuting generally takes considerably longer than commuting by car. The Governor’s Office of Planning and Research has called for putting all California on “a road diet,” meaning that traffic will simply continue to worsen. This in a state which has among the worst roads in the country – 68 percent of which are in poor or mediocre condition.

Can rail solve or mitigate congestion? L.A. has already spent over $15 billion on rail yet this has proven less than effective in either boosting transit ridership or lessening congestion.

Since 1980 before the rail expansion the percentage of Los Angeles County commuters who take transit has actually dropped from 7.0 to 6.9 percent while the transit share of the combined statistical area has dropped from 5.1 to 4.7 percent. Even the total numbers of riders is heading down. Recently the transit booster Los Angeles Times published statistics that showed that there were now 10 percent fewer boardings on the Los Angeles MTA system than in 2006, and that the decline was accelerating.

One reason for the poor performance is that much of the train ridership turns out to have been former bus travelers in the first place, which limits actual gains there. Taxpayers, however, should be screaming about this switchero; the subsidy for new L.A. new bus riders, who tend to be the poorest of the poor, cost taxpayers $1.40 while the cost for a new rail rider was $25.82 over the period of 1994 to 2007. If you believe in transit as public good, clearly building more trains makes less sense than expanding bus operations.

But it’s not just a cost issue. Los Angeles is a vast and dispersed metropolis in which only one in five residents even lives within the city limits, and even much of the city — notably the San Fernando Valley — is essentially suburban in form. Transit travel takes much more time to get to work than the car, even on the region’s miserable roads and overcrowded freeways. With downtown only a minor employment center, people increasingly travel there for cultural events, sports or even a restaurant, not for work.

Other factors also seem to be contributing to the decline. One is the trend toward working at home; in 2014, the number of Angelinos working at home surpassed the number taking transit. Although this saves more energy, and produces less carbon than transit ridership, there is virtually no government support for this innovative approach to traffic reduction from the climate-obsessed state government.

Finally, there are now other options such as Uber and Lyft, which provide reasonably priced door to service, always available, often on short notice. Down the road, the path for transit looks even bleaker with the development of self-driving cars, which will make even long suburban commutes easier. Looked at objectively, the drive for a traditional transit dominated Los Angeles is on a collision course with reality.

 Taking Stock and Changing our Approach

In the alternative world that dominates our transit planners and retro-urbanists, nothing succeeds like failure. Some urban experts still predict that the Sun Belt cities are ripe for a huge infusion of rail transit, despite all evidence to the contrary.

Given what we know about the share of commuters using transit in most cities, pumping money into this form of transportation seems doubly wrong while other needs such as roads, schools, sewers and parks are neglected. Rather than try to fit all cities, and all parts of metropolitan areas, into a 19thcentury technology, maybe we should look to encourage 21st century innovation.

Clearly some of this is already with us, notably in the rise of services like Uber and Lyft which, for many, seems a far more effective way of getting around with your own car. Ride-sharing and services like Zipcar also provide new alternatives. And other innovations could be developed, with expanding shuttle and dial-a-ride services. In many big cities dedicated commuter buses, connecting the dispersed employment centers, would make great sense in cities such as Houston, which has many large employment centers, notes my Center for Opportunity Urbanism fellow, Tory Gattis.

But it’s changing work patterns that may provide the most promising opportunities to reduce traffic and reduce greenhouse gases. In the U.S., working at home, not transit, was the principal commuting alternative to the automobile in 39 of the 53 major metropolitan areas with populations over 1 million as of 2014, according to Census Bureau data. The share of work access accounted for by home workers rose by more than a third between 2000 and 2014, from 3.3 percent to 4.5 percent

Many of the most striking work at home share gains are taking place in the country’s leading technology regions, including Austin, Raleigh, the San Francisco Bay Area, Denver, Portland and San Diego. Millennials in particular, notes a recent Ernst and Young study, embrace telecommuting and flexible schedules more than previous generations did, in large part due to concerns about finding balance between work and family life.

All this suggests we need to revamp our ideas of transit, particularly in the newer, fast-growing cities. Trains may elicit a nostalgic smile about the good old days, but most Americans, and the vast majority of our cities, need to live not in the past but in an increasingly dispersed, and choice-filled reality. Time to embrace that future.

Joel Kotkin is executive editor of NewGeography.com. He is the Roger Hobbs Distinguished Fellow in Urban Studies at Chapman University and executive director of the Houston-based Center for Opportunity Urbanism. His newest book, The Human City: Urbanism for the rest of us, will be published in April by Agate. He is also author of The New Class ConflictThe City: A Global History, and The Next Hundred Million: America in 2050. He lives in Orange County, CA.

Photo: Atlanta MARTA train by RTABus (Own work) [CC-BY-SA-3.0], via Wikimedia Commons

Rethinking America’s Cities’ Success Strategy

$
0
0

This piece is reprinted from a Kauffman Foundation series focusing on the role of cities in a new entrepreneurial growth agenda. Read the entire cities series here.

Most cities are economically weak actors with limited ability to affect the critical forces driving their economies. Furthermore, changes in the structure of the economy often have changed the composition of urban leadership in ways that break the link between personal and community success and create an additional bias in favor of subsidized real estate development as a civic strategy. Less dependent on the local market, this local leadership increasingly identifies with a global community and its concerns in ways that have lowered the civic priority placed on inclusive economic development and entrepreneurship. To change these trends, local leadership should focus on inclusive local economic success first and make policies that reflect that priority and address areas where local government can make an impact. Creating an entrepreneur- and business-friendly local regulatory environment is a key piece of this effort, and the delivery of high-quality basic public services is vital.

Cities as economically weak actors

One of the most important preliminary steps to designing and implementing policies that promote entrepreneurial growth is understanding the economic and competitive context within which such policies are made. The STEEP (Social, Technological, Economic, Environmental, and Political) forces model is one method of inventorying and categorizing a business’s or community’s external context. The table below summarizes some of the key STEEP forces that create both challenges and opportunities for communities today.


This list includes quite an array of profound and powerful forces that are difficult to understand and even more challenging to address. They are also primarily large macro forces that cities are not in a position to influence in a significant way, leaving most cities in a weak market position. Generally, local governments are weak actors and are more often market takers than market makers; they typically have limited scope for fundamentally transformative actions. Local policymakers must undertake efforts that respond to the economic context where there is a possibility of making an impact with the tools available.

Ramsin Canon, a progressive political commentator in Chicago, describes this challenge and Chicago’s lack of pricing power in an article about his city, titled, “Entrepreneur-in-Chief: The New Model City:”1

Why not raise property or luxury taxes, or institute a city income tax, to make up the deficit? Why not divert money from the TIF districts? …. Chicago is no longer a political community, it is an economic entity that is in competition with other cities in the region, in the state, across the world. In that mental framework, tax is cost, or price. You raise prices, you drive away your clients. In the case of the neoliberal city, the client is the developer, the investor, the employer. The federal government and the state are not going to give the city any real money; they are not investing in infrastructure, or education, or social welfare in any real way, the way they did up through the late 1970s and 1980s. The name of the game is “growth” through enticement of capital.— Ramsin Canon

While one may not agree with Canon’s politics, his economic analysis insightfully illustrates how even many large cities today have become structurally weak players in the economic market.

Most of the STEEP forces above have been discussed extensively elsewhere, but there are two under-appreciated and related items that deserve more consideration because of the impact they’ve had on local leadership: (1) the change in composition of local leadership resulting from the nationalization of the industrial base, and (2) the elite identification with global rather than local concerns.

Changes in local leadership resulting from the nationalization of industry

While talk of globalization is ubiquitous, less appreciated is the intermediate nationalization of many industries. Up until the 1980s, most cities’ commercial activities were conducted by local entities across a wide range of industries. In banking, for example, local banks dominated each city because state laws heavily restricted expansion. These banks were all independently owned, restricted to their home markets by branch banking rules, and limited in their activities by the Glass-Steagall Act. Similarly, most electric and gas utilities were local concerns due to restrictions from the Public Utilities Holding Company Act. And local and regional retailers, particularly department stores, were prominent and, often, dominant.

This industrial structure produced a class of leaders whose business and personal successes were tied closely to the economic success of the local community. The only way to make more loans or sell more electricity, for example, was to grow the local market. There was, therefore, a high degree of alignment between business leadership and community interest.

Beginning in the 1980s and especially the 1990s, however, deregulation and a wave of industrial rollups created a very different landscape ruled in many places by national players. The four largest banks in the country now hold about 45 percent of total national banking assets.2 There also has been significant utility consolidation. And, in retail and other industries, we have seen consolidation into a de facto “two towers” model, in which there are two large, national, primary players (e.g., Wal-Mart and Target, Home Depot and Lowe’s, Walgreens and CVS, and AT&T and Verizon).

As a result, there is no longer local ownership over these key businesses in most markets, and the executives running local markets are effectively branch managers. Even where local firms survived, they did so largely by becoming larger national or global entities themselves. There is now, therefore, less overlap between the interests of business leadership and community economic growth; the nationalization of industry weakened the linkage between personal success and community success for local civic leadership.

This broken link is exacerbated by the imbalance it created in the mindset of local business leadership. In the past, the business leadership was made up of a significant number of executives of operational-type businesses, such as banks and utilities, whose successes were tied closely to the success of the local market. Today, however, the businesses that continue to operate at the local level are primarily transactional businesses, including law firms (which are currently in early-stage consolidation), construction firms, architects, developers, and the “business” of politics. There are significant differences between operational and transactional businesses and their relationships to the community. While banks make money on the spread between what they pay for funding and what they charge for loans, lawyers, by contrast, get paid by the hour for work on specific matters. Bankers are making money while they are playing golf in the afternoon. Lawyers are only making money on the golf course if they are closing deals. Transactional business leaders’ interests are less closely aligned with the success of their communities.

Lawyers and other local transactional business leaders always have been very influential, but there are no longer as many powerful bankers and other operating industry executives to balance their perspective. This imbalance has led to a transactional growth mindset among local leaders, which leads to a theory of change for the local economies that favors real estate development. The change from an operational to a transactional mindset, in other words, has introduced an additional bias in favor of publicly subsidized real estate projects as a strategy for growth. These projects satisfy the needs of a large segment of the transactional leadership class of the community, as well as the politicians who love cranes and ribbon cuttings. More broadly, real estate development is now seen as economic development.

To be sure, major downtown development-type real estate projects, such as stadiums, malls, and convention centers, long have been popular for cities and may even be seen as populist projects. Mayors are under pressure to be seen as taking action to create jobs and growth, and, as this type of land development is within local control, it always will retain some popularity. Increasingly, however, these projects appear to be more pure play cronyism, with enormous subsidies bringing dubious public benefit. Cincinnati’s NFL stadium deal, for example, was described by The Wall Street Journal in a news (not editorial) item as “one of the worst professional sports deals ever struck by a local government.”3

Identification of local elites with global, rather than local, interests

In addition to weakening the link between the success of business leaders and that of their broader communities, the consolidation and globalization we’ve seen in many industries has resulted in a new affinity between the local elite and those who hold similar positions throughout the world. As business leaders and other elites are no longer as invested in their communities and have fewer economic ties to them, they identify primarily with their global class and have more loyalty to their global brethren in other places than to those who live in the same local region.

Saskia Sassen, a pioneer in research on what are now called “global cities,” identified this trend in her description of the bifurcation of these regions. The global city, in this view, is a kind of city within a city. Richard Longworth at the Chicago Council on Global Affairs noted a similar trend: “Globalization is disconnecting a city from its hinterland.”4 The global city of the Chicago Loop and North Side, for example, exists in an almost parallel universe to those left behind in the South and West Sides.

The term “elite” may seem inherently pejorative, but all systems have a group of leaders and agenda setters. At the local level, the elite includes prominent business, political, civic, academic, religious, and philanthropic leadership, as well as members of the media and cultural communities. The most educated strata of the community, or, more broadly, the upper middle class, also may be included. This group has best adapted to new economic realities and represents roughly the top 10 percent to15 percent of most communities, though higher in the largest urban centers.

While this elite group is now more disconnected from the rest of a community, attracting and retaining this stratum is now often seen as critical to a region’s success. Richard Florida’s “creative class” theory maintains the importance of this group to local economic growth. Similarly, CEOs for Cities, an urbanist organization, released a report called “The Young and the Restless,” which suggests that the youth portion of this group is fickle, demanding, and highly mobile. A failure to cater to their desires, the report indicates, might harm a city’s economic future severely.5 This phenomenon is the human capital side of Canon’s description of the city as an economic entity.

In this worldview, servicing the needs of the community’s elite and attracting more people like them is paramount to a particularly desired form of economic success. This strategy is not necessarily rooted in elitism or snobbery. Rather, communities facing enormous pressure from the STEEP forces above are looking to replicate models of success and finding their models in places like New York and San Francisco. While gentrification has been criticized, one can point to plenty of places where it has happened successfully. Meanwhile, there is little track record of success turning around non-elite portions of post-industrial cities. No wonder, then, that cities look to strategies that appear to offer the prospect of success, with the added benefit of some glamour, instead of going against the grain and trying to tackle problems that are much harder and lack obvious solutions.

The consequence of this worldview, however, is that local leadership prefers to implement policies that show that their city belongs in the global club, rather than focusing on primarily local concerns. The priorities of the global community are set in the world’s major cities, including London, New York, San Francisco, Paris, and Hong Kong, among many others. These communities are very different from workaday American cities. It’s difficult to see how the same policies would suit such diverse places as Los Angeles, Buffalo, Oklahoma City, and Portland equally. While there is a clear need to spend more money on transit in New York City, for example, spending large sums to attempt to retrofit smaller and entirely auto-oriented cities to transit makes little sense.

Furthermore, these major cities have, to some extent, market-making power, at least to a far greater degree than smaller localities do. A place like New York, for example, can implement the tactics that Canon says even Chicago cannot. It is no surprise that New York has far higher taxes than Chicago does, since New York has more marketplace leverage.

Following a global, rather than a local, piper works well in many cases. For example, most local tech startups around the country are following the same script that appears to be effective, including open collaboration, co-working, meetups and events, angel investors, local venture capital funds, and local marketing groups. Similarly, aspirational locals opening top-quality coffee shops and microbreweries legitimately enhance their communities.

This strategy can cause problems, however, as smaller cities may see quite different results when they try to prove their global bona fides by implementing the policies and priorities of global cities, especially those related to economic regulation and those that do not align with local needs. For example, America’s coastal cities are adopting very high minimum wages, and local progressives in cities with far less leverage than San Francisco often want to implement the same policy. Furthermore, it should be noted that global cities themselves are not without challenges, including growing inequality, which is an enormous problem in these places. In Chicago, we saw the juxtaposition of the opening of a gorgeous Riverwalk downtown on a Memorial Day weekend in which fifty-six people were shot and twelve of them killed.6

Perhaps the greatest disconnect between the elites’ concerns and the localities’ needs is in the area of climate change. The quintessential global problem, climate change is particularly ill-suited to be addressed at the local level. No city alone could make a material impact on climate change, even if it eliminated all of its carbon emissions. Nonetheless, climate change is a core concern of the global class, and the fact that this issue drives policy and regulatory mandates in many cities is a powerful illustration of city elites’ global identification. These policies don’t align well with many smaller cities’ weak market power, and, more importantly, these smaller cities are poorly positioned to thrive under these policies.

Even the global cities, in fact, have very particular economic structures and participate in specific global networks. Although globalization has produced a type of surface homogeneity among cities, Sassen points out that each city is truly unique. Similarly, Berkeley economist Enrico Moretti has identified a “great divergence” between cities.7 America’s cities are said to all look basically the same, but there are many different typologies, and each place has its own particular characteristics.

Ultimately, the identification of community elites with global communities rather than local communities leads policymakers to imitate other localities’ efforts instead of thinking about the unique policy priorities for a particular city that are based on its own indigenous history, economy, culture, demographics, and geography. Civic policy at the local level is dominated by “school solutions” that promote the same characteristics everywhere, often as a way of signaling that a city belongs in the “club.” While companies try very hard to convince their audiences that they are different and better than other companies in their industries,8 most cities try to look exactly the same as other cities that are considered cool, including offering bike lanes, coffee shops, microbreweries, a creative class, a food scene, and a startup culture. Even most cluster analysis seems to produce primarily a collection of the same five basic focus areas in every region (high tech, life sciences, green industry, advanced manufacturing, and logistics). Instead, local thinking should play a critical role in policy setting. Copying some good attributes can be helpful, but it’s hard to be successful with a collection of borrowed ideas. Cities need locally tailored policies and unique, indigenous thinking based on the cities’ singular histories, economies, cultures, demographics, and geographies.

How to think about local entrepreneurship and economic growth

In light of all these factors, it is unsurprising that economic results have been meager in the aggregate, but good in select high-end sectors. To improve results throughout the country, I propose that local governments should apply the guidelines listed below to their economic development policies.

  1. Local civic priorities should favor building a successful and inclusive local economy, including entrepreneurship, over global concerns and real estate development.
  2. Policies should be made considering the totality of the environmental context (STEEP).
  3. Policies should be oriented toward areas in which local governments can have the most impact, given the contextual constraints that have been identified.
  4. Policies should be designed to fit each city’s unique situation.

Because cities are all distinct, there is no one-size-fits-all solution. Some focus areas, however, do appear to be broadly applicable. For example, local communities can’t do much to affect global trade policy, but they largely can control local regulations and zoning. Reducing red tape is frequently discussed, but seldom accomplished to any significant degree. Rather than solely focusing on cutting regulations, local governments should make sure the operations of the regulatory structure are clear, predictable, transparent in their operations (not politicized), and timely. The most important factor of production in almost any business is management time and attention; owners and managers want to be able to get through compliance quickly so that they can focus on—or even simply start—their businesses.

Local governments also are directly responsible for delivering an array of basic and critical services, including parks, libraries, policing, and streets, among many others. Getting these basics right throughout a city or region, rather than simply having a few select world-class districts, is important to inclusive success. These core services provide the basic platform on which businesses operate and are the actual business of local government. They must be performed well.

There may be other appropriate actions, depending on each city’s particular local needs and opportunities. The key is to determine what policies and actions to undertake with a high priority on inclusive economic success for the local community based on where the best opportunities are for local actors to make a difference.

The most important shift that needs to occur in cities is one of mindset. The civic elite and upper middle class of our cities need to see their communities as the places where they live, not see themselves primarily as part of a community of their peers in other cities and around the world. They must ask themselves the oldest questions: Who is my brother? Who is my neighbor? And, local leadership needs to see all of the people of their community, not just the upscale portion of them, as those to whom they owe first allegiance.

Aaron M. Renn is a senior fellow at the Manhattan Institute, a contributing editor of City Journal, and an economic development columnist for Governing magazine. He focuses on ways to help America’s cities thrive in an ever more complex, competitive, globalized, and diverse twenty-first century. During Renn’s 15-year career in management and technology consulting, he was a partner at Accenture and held several technology strategy roles and directed multimillion-dollar global technology implementations. He has contributed to The Guardian, Forbes.com, and numerous other publications. Renn holds a B.S. from Indiana University, where he coauthored an early social-networking platform in 1991.

Endnotes

  1. Canon, Ramsin. “Entrepreneur-in-Chief: The New Model City.” Gapers Block. January 4, 2013.
  2. Federal Deposit Insurance Corporation. 2012. FDIC Community Banking Study.
  3. Albergotti, Reed, and Cameron McWhirter. “A Stadium’s Costly Legacy Throws Taxpayers for a Loss.” The Wall Street Journal, July 12, 2011.
  4. Longworth, Richard. Caught in the Middle: America’s Heartland in the Age of Globalism.
  5. Coletta, Carol, and Joseph Cortright. “Wanted: The Young and Restless.” The Washington Post, February 13, 2006.
  6. http://www.chicagotribune.com.htmlhttp://chicago.curbed.com.php.
  7. Moretti, Enrico. The New Geography of Jobs.
  8. Apple, for example, once had an ad campaign called “Think Different.”

Photo by caruba

Farewell, Grand Old Party

$
0
0

The increased likelihood of Donald Trump as the GOP presidential nominee, as evidenced by his win in Florida and other states last week, spells the end of the Republican Party as we have known it. Successful political parties unite interests under a broadly shared policy agenda. The Clinton Democrats may seem ethically challenged, condescending and bordering on dictatorial, but they share basic positions on many core issues and a unifying belief in federal power as the favored instrument for change.

In contrast, the Republican Party consists of interest groups that so broadly dislike each other that they share little common ground.

GOP libertarians want more social freedoms; social conservatives want less. Neocons hunger for war, while most other Republicans, both libertarian and constitutionalist conservatives, reject Bushian interventionism. The rising populist wave now inundating the party and driving the Trump juggernaut both detests, and is detested by, the party’s media, corporate and intellectual establishment.

Some “movement” conservatives are returning the favor, essentially blaming the white working class for their own failures. Among some on the right, it appears, capitalism and the law of the jungle are always noble, and those who fail to make the grade clearly are not. No surprise, then, that the new generation of voters seems more ready for socialism than for laissez faire.

Against weak and squabbling opposition, Trump has employed his crude persona, and equally crude politics, to dominate the primaries to date. But in the process he has broken not only the party structure, but also its spirit. Indeed, some of the party’s most promising emerging leaders, such as Nebraska U.S. Sen. Ben Sasse, have made it clear they cannot support a candidate who seems to have little respect for the Constitution, or any other cherished principle.

Read the entire piece at The Orange County Register.

Joel Kotkin is executive editor of NewGeography.com. He is the Roger Hobbs Distinguished Fellow in Urban Studies at Chapman University and executive director of the Houston-based Center for Opportunity Urbanism. His newest book, The Human City: Urbanism for the rest of us, will be published in April by Agate. He is also author of The New Class ConflictThe City: A 

Photo by Gage Skidmore [CC BY-SA 3.0], via Wikimedia Commons

Rise of the Mixed-Use Monoliths

$
0
0

Density rules new development. From Florida to Texas to points west, city boosters herald a mixture of apartments and shops as an improvement on local 'density'. Dense development can be well designed, and can contribute to the form of a city, but the new density’s formulaic style is a crossbreed of strip shopping centers joined with 1980s apartment complexes. Instead of a newly walkable urban environment, we are spawning more traffic than ever, in uninspired, pricey, new trophy projects that adorn our busy highways and replace quirky, individualistic neighborhoods with soulless, mock historic monoliths.

The official name for the form of these developments is “urban mixed use,” but they are a far cry from city-center urbanity. Each new development is a variation on beige stucco and predictable planning. A mixed-use development is not a bad thing in and of itself; for every 200-unit mixed use development in the works, 200 acres of Florida’s wilderness is kept for future generations. Their repetitive nature, however, is depressing. Nowhere is this more evident than along the ten-mile Central Florida strip called US 17-92, where five of these developments are in various stages of life.

US highways 17 and 92 combine south of Orlando to create a six-lane artery running north through several towns before splitting up once again, 17 going northwest and 92 going northeast. One response to the highway is the eccentric, prosperous community of Maitland, with 17-92 as its main street.

Premodern Maitland still exists, from the unpainted vernacular architecture of the Holly Anna orange grove store all the way up to the last vestiges of Parker’s Lumber, a railside lumberyard that dates from the 1920s. Both signal an era when Maitland actually produced something. The town's rather elegant, light brick church tower and the angled, delicate columns of Maitland Plaza, an office complex, indicate Maitland’s midcentury phase, that once-hopeful era when architecture smiled at tailfins and speed.

Maitland, however, bought big into the new density storyline. At 17-92 and Lake Avenue the first in its collection was Victorian flavored, with a foil-lined particleboard tower thrust high over the empty storefronts lining the narrow sidewalk. Chunky columns rest between the storefronts, and thin-skinned apartments perch above whizzing cars.

That development sits across from the venerable Lake Maitland Terrace, a 1960s era resort-style campus sensibly buffered from the roar of traffic by green trees and a lawn. Lake Maitland Terrace has a waiting list, and is memorably well detailed in precast concrete, built to last. But living over a busy commercial strip is in vogue today, so we can’t seem to produce any more Lake Maitland Terraces. Instead, we have the empty mixed-use hulk across the street, harbinger of more to come.

And more have arrived, indeed. Maitland’s newer mixed-use experiments are beige neoclassical foam and stucco, looking vaguely like excrescences of Mediterranean and Victorian-town villages. The newest development-in-process promises “gathering… entertainment… living… swimming…” under the baleful stare of city hall’s recent stucco-and-foam tower looming in the background.

Enthusiasm for these places has worn off among long-time Central Floridians, and reality has set in. Each one resembles the last more and more, as developers fine-tune the machine that pumps out mixed-use developments with alarming regularity. The public is already suspicious of them, pointing to more congested traffic, rising prices, and the banishment of individual businesses in favor of the chain stores. Gone are entrepreneurs building businesses, replaced by minimum-wage clerks and a store manager working for the somewhere-out-of- state home office.

The design formula appears to mix a little bit of stacked stone (for authenticity’s sake), beige stucco smeared liberally over large, puffy columns, and a shopping-center canopy facing a parking lot. A narrow concrete sidewalk turns depressingly nasty when it gets to the apartment complex, where the outdoor entry corridor inevitably takes over – a no-man’s land of trash cans, aluminum mailboxes, and iron bar security gates. Apartment floor plans still have a couple variations on the one and two bedroom schemes, with living rooms that don’t quite fit the furniture found in Ikea.

Maitland, in particular, has succumbed to a mock-historical design aesthetic of boxy architecture, carriage lanterns, and scrolled gewgaws. This city, when left to its own design aesthetic, commissions monuments along US 17-92 that nicely reference its own original architecture, a 1930s art colony built in a fantasy Mayan style. Originality, however, is out with the builders of the new density.

Further north lies Altamonte Springs. Here, the developers went for an early Soviet Union period style, Floridified, with giant, pyramid-hatted apartments. These overlook Crane’s Roost, a pretty lake that is now over-engineered with parking along its banks. Planned with good intentions, the architecture falls apart upon closer inspection, its chief design innovation being a dark red three-story stucco wall along the sidewalk, perfect for absorbing the hot Florida sun. It almost makes me nostalgic for my 1980-vintage apartment complex with its slanted redwood siding and river-rock balcony.

What unites all of these developments is their earnest puffery. Each is styled with gaudy mascara and rouge to look like something it is not. This is the DNA inherited from their ancestor, the shopping center. They all have large fat columns, thickened corners, and Neanderthal eyebrows to give them a sense of heaviness. But if you watch them under construction, you will see lots of metal or wood studs: they are hollow inside.

Grafted onto this mask is an apartment block, but not one like the brownstones of old. These have no connection whatsoever to the street – no stoop or entry door on the sidewalk. Brownstones had architectural scale and character made famous by Ada Louise Huxtable; for example, she could date one by the lintels over the windows. No such luck here. The only decoration that adorns the exterior façade is a stucco control joint pattern.

It’s as if every movie has to have blockbuster special effects, and can’t just tell a good story with actors anymore. By contrast, these developments replace a midcentury minimalism of architecture with a now- lost delicacy. Lake Maitland Terrace wasn't special before the rise of mixed-use properties along the highway, but it was about itself, and nothing else: it didn’t pretend to be a Victorian main street or a Mediterranean hill town. With no special effects budget, it simply offered good views and workable, decent floor plans.

I don't believe that the hollowness marking the current taste in commercial development reflects the taste of everyone who actually uses it. Many of these places are vacant, a wave of retail space crashing upon us just in time for the online shopping trend. Welcome to the new America.

What can we, as local users, do to combat this? Humanize them, renovate them, and add our own local color as they get older. Steer them closer to our own specific pathways. A certain sidewalk here might get a sun shade or a trellis added to shade it, converting it from an oven to a lovely pocket park.

The spaces that we love in our town grew that way over time. We cannot let these hollow, mixed-use monoliths defeat or dispirit us. They are here to stay, and more are coming, so our job is now to take ownership of these buildings and start individualizing them. The sooner we can inflict the spirit of place upon them, they will cease being monstrosities, and become members of our own community of buildings.

Richard Reep is an architect with VOA Associates, Inc. who has designed award-winning urban mixed-use and hospitality projects. His work has been featured domestically and internationally for the last thirty years. An Adjunct Professor for the Environmental and Growth Studies Department at Rollins College, he teaches urban design and sustainable development; he is also president of the Orlando Foundation for Architecture. Reep resides in Winter Park, Florida with his family.

Photo of Maitland by the author

Viewing all 3793 articles
Browse latest View live


Latest Images