Quantcast
Channel: Newgeography.com - Economic, demographic, and political commentary about places
Viewing all 3789 articles
Browse latest View live

Where American Families Are Moving

$
0
0

Much is made, and rightfully so, about the future trends of America’s demographics, notably the rise of racial minorities and singles as a growing part of our population. Yet far less attention is paid to a factor that will also shape future decades: where families are most likely to settle.

However hip and cool San Francisco, Manhattan, Boston or coastal California may seem, they are not where families are moving.

In a new study by the Chapman Center for Demographics and Policy, we found that the best cities for middle-class families tend to be located outside the largest metropolitan areas. This was based on such factors as housing affordability, migration, income growth, commute times, and middle-income jobs. Many of our best-rated cities tend to mid-sized. The three most highly rated were Des Moines, Iowa, Madison, Wis., and Albany, N.Y., all with populations of less than 1 million. Among our top 10 metropolitan areas for families, five are larger than this, but only two—the Washington, D.C. area and Minneapolis-St. Paul—are among the nation's 20 largest metropolitan areas.

Download the full report (pdf) here.

Our bottom 10 includes the media’s favorite two cities, New York and Los Angeles, also the largest metropolitan areas in the nation. Three other large metropolitan areas rank in the bottom 10: Miami, Riverside-San Bernardino, Calif., and Las Vegas. The hipster cities, in other words, are not so amenable to the new generation of young families.   

Why Families Head to the Suburbs

In the 1960s, renowned urbanist Jane Jacobs asserted that “suburbs must be a difficult place to raise children.” But they remain popular nonetheless. According to U.S. Census Bureau statistics, in 2011, children between ages 5 and 14 constituted about 7 percent in urban core Central Business Districts (CBDs) across the country, less than half the level in newer suburbs and exurbs. In Manhattan, singles comprise half of all households, based on the American Community Survey. The highest percentage of women over 40 without children, notes geographer Ali Modarres, can be found in expensive and dense Washington, D.C.

One clear example of the new child-free city is San Francisco, which is now home to 80,000 more dogs than children. In 1970, children made up 22 percent of the population of San Francisco. Four decades later, they comprised just 13.4 percent of the town’s 800,000 residents. Nearly half of parents of young children there, according to 2011 survey conducted by the city, planned to leave in the next three years, largely due to high housing costs. This pattern is accelerating: Since 2011, less-dense ZIP codes have been growing far faster than the more dense ones.

The desire for affordable, single-family homes is driving this trend. Over 80 percent of married couples live in such housing, compared to barely 50 percent of households of unrelated individuals and single. The choice to move to the suburbs also reflects the preference for a safer setting. FBI crime statistics show the violent crime rate in the core cities of major metropolitan areas is nearly 3½ times higher than in the suburbs. Given the murder rate in many major cities, this gap can be expected to grow.

Another key motivation in choosing the suburbs, especially for families with children, is frustration with the quality of urban public education. Suburban schools still consistently out-perform those of inner cities in terms of achievement, graduation and college admission.

In the coming years the progressive penchant for enforced densification—contrary to the preferences of most Americans—could cause some serious intra-party rifts, even in areas that today are reliably Democratic “blue.” The biggest opposition to building more single family housing has often been in liberal bastions such as Marin County, Calif., Boulder, Colo., and Westchester County, N.Y., the official residence of Hillary and Bill Clinton after they left the White House. As one Bay Area blogger observed, “suburb-hating is anti-child”—because it seeks to undermine neighborhoods with children.

Exclusionary and Opportunity Regions

America has always had its fancy neighborhoods, often associated also with racial or ethnic exclusion. But increasingly large parts of the country, and this is true in certain cities and suburbs, are evolving into what Dartmouth University’s William Fischel has called “exclusionary regions”—too expensive for middle-class families to access.

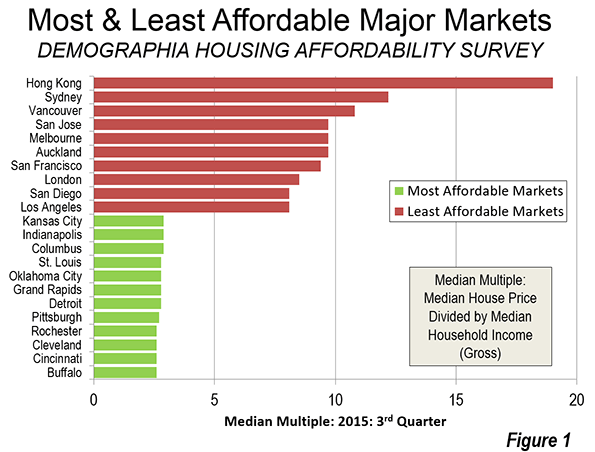
Fischel traces much of this development to regulatory policies that restrict housing supply. In 1970, for example, housing affordability in coastal California metropolitan areas was similar to the rest of the country, as measured by the median multiple (the median house price divided by the median household income). Today, due in part to a generation of strict growth controls, home prices in places like San Francisco and Los Angeles are now three or more times higher than in some other metropolitan areas.

The impact is being felt disproportionately by younger adults, who, unlike earlier generations, do not benefit from housing inflation, and who face other barriers to home-buying ranging from student debt to weak income growth. Coupled with an overall weak economy, the net worth of people under age 35 has plummeted almost 70 percent from 2004 levels, making affordable housing an even more pressing issue.

This cash-short generation is moving to more affordable places. Since 2010, the fastest growth in the ranks of college-educated millennials has been to lower-cost regions such as the four large Texas cities (Dallas-Fort Worth, Houston, San Antonio and Austin), Nashville, Tenn., and Orlando, Fla., as well as such Rust Belt cities as Pittsburgh and Cleveland. These cities offer what the “exclusionary” regions once did: an affordable inner-city option for the young and childless as well as suburbs they can move to as they start families. Other families are settling in small, relatively inexpensive metropolitan areas: Fayetteville, Ark., Cape Coral and Melbourne, Fla., Columbia, S.C., Colorado Springs, Colo., and Boise, Idaho.

High rents, which now constitute the largest share of income in modern U.S. history, could be determining these change in youthful migration. Since 1990, renters' income has been stagnant, but inflation-adjusted rents have soared 14.7 percent. Housing, long the largest expenditure item, now takes an even larger share of family costs, while expenditures on food, apparel and transportation have dropped or stayed about the same. In 2015, increases in housing costs essentially swallowed gains made elsewhere, notably savings on the cost of energy.

This situation is most severe in the highest-priced markets. In New York, Los Angeles, Miami and San Francisco, for example, renters spend 40 percent of their income on rent, well above the national average of under 30 percent. In each of these markets there have been strong increases (income adjusted) relative to historic averages. In New York, rents increased between 2010 and 2015 by 50 percent, while incomes for renters between ages 25 and 44 grew by just 8 percent.

Where the Future Is Being Built

This wide disparity between “opportunity” and “exclusionary” areas is being locked in place by the persistent lack of new housing in most high-priced regions. Since 2010, among the 10 areas that experienced the biggest increases in housing supply, only one was in a deep-blue urban area: Seattle. The cities producing the most new units—Austin, Raleigh, N.C., Houston, Dallas-Fort Worth, Nashville, Charlotte, N.C., Orlando, Oklahoma City, and Jacksonville, Fla.—have managed to keep their housing costs, and rents, to levels acceptable to middle- and working-class families.

In contrast New York, San Francisco, Los Angeles and Boston are authorizing far fewer new units per capita than these rising cities. Houston and Dallas-Ft. Worth, with a population roughly one-third of Los Angeles-Orange Country, have produced close to two times as many new units. Overall, California’s rate of new housing permits is one-third that of the Lone Star State.

This divide will become more pronounced as progressives work to undermine lower-density lifestyles, often in the name of combatting climate change. In California, new single-family homes are gradually being made the exclusive province of the super-affluent, while multi-family units often face opposition from neighbors and even environmentalists. Older residents, with lower property taxes and ideal weather, may stick around, but young people likely will be forced to migrate, particularly as they enter their 30s or get tired of living in their parents’ spare rooms.

No surprise, then, that expensive and highly regulated markets have seen declines in their numbers of children since 2000. In contrast, affordable cities continue to gain families with children in the 5 to 14 age range. Dallas-Ft. Worth, for example, gained 230,000 youngsters between 2000-2013. In Houston, the number was 190,000 and in Atlanta it was more 167,000 over that span. During the same period, Los Angeles’ child population dropped by 303,000, or 15 percent. In New York it fell by 238,000 kids.

Increasingly, employers are factoring affordable local housing stock as an equation into their decisions about where they locate—or relocate. A recent SMU study found that high housing prices to be the biggest reason why Toyota left Los Angeles for the Dallas-Fort Worth area.

The Emerging Family/Childless Divide 

Although American localities are being pitted against one another not just by politics but by their ability to attract young families, the emerging map of where families live is not necessarily custom-made for conservatives.

Key Democratic groups, including African-Americans, are also moving to the suburbs, particularly in less expensive cities, largely in the southeast and Texas. The suburbs are also increasingly the chosen destination of immigrants and their offspring, another blue-leaning cohort. Roughly 60 percent of Hispanics and Asians already live in suburbs. Between 2000 and 2012, the Asian population in suburban areas of the nation’s 52 biggest metro areas grew 66.2 percent, while in the core cities it expanded by 34.9 percent. Of the top 20 cities with an Asian population of more than 50,000, all but two are suburbs.

Republicans also will be challenged to appeal to the rising number of suburban millennials, who also lean Democratic. But there’s some good news for Republicans in that the political future is not going to be shaped primarily in the Obama hotbeds along the coasts, but places, such as the South and the suburbs, where conservatives at are more competitive.

To compete for diversifying suburban, Sunbelt and smaller city electorates, conservatives need to better show why families of all ethnicities should support them. They must make the case that Republican policies are better for voters economically and can provide the most efficient and effective services, particularly for their children.

As for Democratic Party leaders, they would do well to push back the narrative of their urban core elites, who tend to characterize suburbs and Sunbelt cities as soulless enemies of culture and killers of the planet. It is time to recognize that most American families, whatever their ethnicity, desire a decent home in a nice neighborhood, whether in a suburb or a city, where children can be raised. In addition, and this is of increasing importance, they want a place where seniors can grow old amid familiar places and faces. These homeowners will likely yield disproportionate influence over elections since they are more likely to vote -- and be active in local affairs -- than the general population.

Ultimately, these families will determine the political future of the country. After all, there is no “replacement” generation for singles and childless couples. In the long run, wooing families will determine who wins the political wars not only this year but in the decades ahead.

Download the full report (pdf) here.

Joel Kotkin is executive editor of NewGeography.com and Roger Hobbs Distinguished Fellow in Urban Studies at Chapman University, and a member of the editorial board of the Orange County Register. He is also executive director of the Houston-based Center for Opportunity Urbanism. His newest book, The New Class Conflict is now available at Amazon and Telos Press. He is also author of The City: A Global History and The Next Hundred Million: America in 2050. He lives in Orange County, CA.


Land Regulation Making Us Poorer: Emerging Left-Right Consensus

$
0
0

There is an emerging consensus about the destructiveness of excessive land use regulation, both with respect to its impact on housing affordability but also its overall impacts on economies. This is most evident in a recent New Zealand commentary.

New Zealand

Both the center-Left and center-Right have come together in agreement on the depth of New Zealand's housing affordability and its principal cause, overly restrictive urban planning regulations. Labour Party housing spokesperson (shadow minister) Phil Twyford and Oliver Hartwich, executive director of the New Zealand Initiative, wrote in a co-authored New Zealand Herald commentary:“Our own research leaves no doubt that planning rules are a root cause of the housing crisis, particularly in Auckland…” (See: “Planning Rules the Cause of Housing Crisis.”).

The Labour Party is the largest opposition party in Parliament, and has traded governing with the currently ruling National Party more than eight decades. The New Zealand Initiative is "an association of business leaders that is also a research institute."

Planning and the New Zealand Housing Crisis

New Zealand’s housing crisis has been building for more than two decades. New house construction has fallen dramatically. According to Twyford and Hartwich, house construction has declined nearly 40 percent from 1973. At the same time the demand for housing has increased. The authors note that New Zealand’s population has increased 50 percent since that time. The housing shortage is further exacerbated by the falling average size of households, which means more new dwellings are required than  indicated by the increase in population

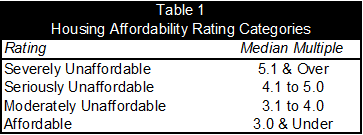
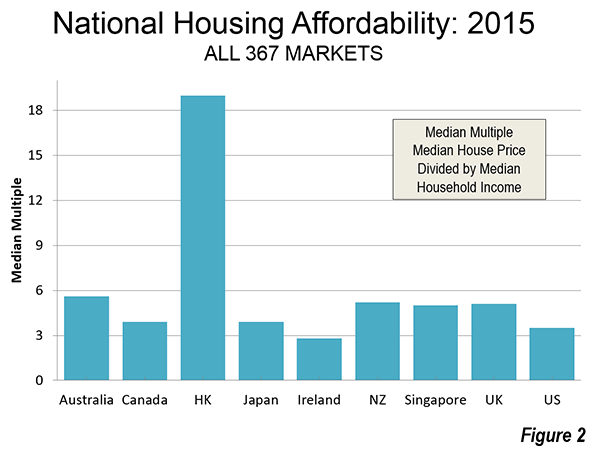
Across the Pacific nation, far more restrictive land use regulations have been adopted, including urban containment boundaries (urban growth boundaries), which have been associated with higher house prices relative to incomes. Before the imposition of strict land use regulation, houses typically cost three times or less that of household incomes. Since then, house prices have double or tripled relative to household incomes. Twyford and Hartich note that houses now cost a “severely unaffordable” 9 times household incomes in Auckland: They say that “A big part of the problem in Auckland is escalating land costs. Linked to this, too few houses are being built. The houses that are being built are too expensive.”

Twyford and Hartwich indicated an even broader general agreement, endorsing comments by the ruling National Party government’s as indicated by Deputy Prime Minister Bill English: “It costs too much and takes too long to build a house in New Zealand. Land has been made artificially scarce by regulation that locks up land for development. This regulation has made land supply on responsive to demand” (also see: "Planning has Become the Externality")

Broad Consequences

Twyford and Hartwich starkly described the consequences of New Zealand's urban planning regime.

“Rising house prices are making us poorer as a nation. They force people to spend an ever larger proportion of their incomes on housing, and it ties up vast amounts of the nation's wealth in housing instead of investing it in businesses that create jobs and exports.”

Twyford and Hartwich also agreed that there is more than enough blame to go around for the mess that has arisen in New Zealand (a criticism that would be appropriate across Australia, the United Kingdom, some markets in the Unites States and the largest markets in Canada):

"Because this is a national housing crisis that has grown over decades and under governments of different hues, playing political blame games is pointless. You cannot solve problems in retrospect. We need to face the facts and work together for real reform."

The authors identified three issues for reform: “First, urban growth boundaries driving up section costs. Second, anti-density restrictions stopping affordable housing. Third, the expensive and inefficient way we fund infrastructure.” They also indicated a familiarity with the economics of development fees (also called impact fees”), often missed by planners in Australia, Canada, the United States and elsewhere. “Even though developers nominally pay for all these costs,” “they note, these costs “are immediately passed on to the new home-buyer.”

Twyford and Hartwich propose what they refer to as "modest" reforms:

“• Instead of using urban growth boundaries, empower communities to protect places that are of special character and value to them.

• Free up density and height controls and rely more on high urban design standards including requirements for open and green space, to allow more affordable housing in the city. Let the market discover where and how people want to live.

• Take developers out of the business of financing new infrastructure. Instead, spread the cost over the assets' lifetime, either by issuing local government bonds or establishing Community Development Districts” (These could be similar to the Municipal Utility Districts of Texas).

Importantly, in their second proposal, Twyford and Hartwich exhibit the appropriateness of consumer choice in housing. As in other goods and services, consumers should be free to make their own housing choices, rather than being limited to those permitted by urban planning  decrees. Yet, urban planning, in recent years, has attempted to reduce house sizes and force higher densities, attempting to drive many households into smaller houses and into condominiums who prefer larger detached houses. 

The concluded that:

"It is an issue of national importance and concerns all of us - all councils and political parties, developers and the wider business community - and of course the people of this country who would benefit the most from restored housing affordability.

The time for reform is now."

The Twyford-Hartwich commentary follows other significant developments in New Zealand.

Indicating the depth of concern about the impact of planning policies on housing prices, the city of Auckland's Chief Economist has proposed setting a target to nearly halve house prices relative to incomes over the next 15 years (to a price-to-income ratio of 5.0, compared to its now reported near 10). This represents an important turnaround in thinking in the city.

Moreover, economic research produced recently for the  Productivity Commission of New Zealand indicated that the housing market distortion has become so bad that “After controlling for a range of other influences, the gradient in land prices (per hectare) from Auckland’s CBD to the rural land adjacent to the city undergoes a step change at the point of the MUL [metropolitan urban limit or urban containment boundary].” The differential was identified at approximately 10 times and the Commission noted that the land value gap has “increasingly binding as housing demand pressures have intensified” (Note 1).

The Emerging International Consensus

Consistent with the Productivity Commission recommendation, London School of Economics professors Paul Cheshire, Max Nathan and Henry Overman, in their recent book, Urban Economics and Urban Policy: Challenging Conventional Policy Wisdom, that (see: “People Rather than Places, Ends Rather than Means”):

“…observed price discontinuities – the difference in market prices across boundaries categories – should become a ‘material consideration’ leading to a presumption in favour of any proposed development unless (a very important ‘unless’) it could be shown that the observed monetary value of the discontinuity reflected wider environmental, amenity or social values of the land in its current use.”

Shortly after the Twyford-Hartwich article, George Mason University professor Ilya Somin wrote of an “emerging cross-ideological consensus” in his Washington Post column. Somin mentions economists perceived as representative of right of center and left of center positions, such as Harvard’s Edward Glaeser and Nobel Laureate and New York Times columnist Paul Krugman, as well as Jason Furman, Chair of the White House Council of Economic Advisors. He quotes Krugman: “this is an issue on which you don’t have to be a conservative to believe that we have too much regulation.”

If there is any issue that the Left and Right should be able to unite around, it is policies that keep cities affordable (a prerequisite to livability) not only for both the threatened middle-class and for lower income citizens. More than 40 years ago, legendary urbanist Sir Peter Hall's raised these as principal points in his critique of urban containment policy. Twyford, Krugman, Cheshire and Harwich are right. This is not an ideological issue but one about the human future in our cities.

Wendell Cox is Chair, Housing Affordability and Municipal Policy for the Frontier Centre for Public Policy (Canada), is a Senior Fellow of the Center for Opportunity Urbanism (US), a member of the Board of Advisors of the Center for Demographics and Policy at Chapman University (California) and principal of Demographia, an international public policy and demographics firm. He is co-author of the "Demographia International Housing Affordability Survey" and author of "Demographia World Urban Areas" and "War on the Dream: How Anti-Sprawl Policy Threatens the Quality of Life." He was appointed to three terms on the Los Angeles County Transportation Commission, where he served with the leading city and county leadership as the only non-elected member. He served as a visiting professor at the Conservatoire National des Arts et Metiers, a national university in Paris.

----

Photograph: Phil Twyford, Labour Party housing spokesperson (shadow minister)

What If Singapore and Las Vegas Had a Love Child?

$
0
0

Compared to what? That’s the question I kept asking myself as I explored Dubai for the second time. Like many people I have serious concerns about the glistening new city-state. But in the end I’ve decided that it’s all really a matter of degree, not kind. I came to this conclusion unexpectedly and begrudgingly. I wanted to hate the place much more than I ultimately did. For all its behind-the-scenes repression and social injustice Dubai is thriving primarily because so many other places are failing so spectacularly. It’s a carnival mirror held up to the rest of the world reflecting the things we don’t like to acknowledge in our own backyards.

Screen Shot 2015-12-10 at 3.20.48 PM

IMG_6817 (1024x646)

IMG_6245 (1024x683)

IMG_6355 (1024x683)

Screen Shot 2015-12-10 at 4.42.53 PM

Screen Shot 2015-12-10 at 4.43.28 PM

Screen Shot 2015-12-10 at 4.27.16 PM

Screen Shot 2015-12-10 at 5.55.32 PM

How is an indoor ski resort in the Persian Gulf all that different from ice hockey stadiums in Houston, Miami, or Los Angeles? How is the Edmonton Mall in the frozen plains of Alberta really different from the Dubai Mall out in the desert? How is a city of over two million people kept alive in a forbidding landscape with no water or farm land? Ever been to Henderson, Nevada or Scottsdale, Arizona? Isn’t it cruel and immoral to use underpaid and exploited immigrant workers who are systematically threatened with deportation? Really? Really? Do I need to go there?

Screen Shot 2015-12-10 at 5.02.14 PM

Screen Shot 2015-12-10 at 5.47.14 PM

Screen Shot 2015-12-11 at 1.07.31 AM

Dubai is the love child of Singapore and Las Vegas. I choose these two “parents” very carefully. The founder of modern Singapore, Lee Kuan Yew, was fond of saying that what impoverished countries lacked most is good governance. Singapore was transformed from a tiny hardscrabble island nation with no hinterland or natural resources to a world class economy in a matter of forty or fifty years. Skilled management was responsible for most of that success. Singapore’s puritanical one party rule can be criticized on many levels, but providing a safe prosperous life for its people is not on that list. And its inhabitants are free to leave if they feel oppressed – which some do.

Screen Shot 2015-12-10 at 4.46.46 PM

Screen Shot 2015-12-10 at 5.00.33 PM

Screen Shot 2015-12-10 at 5.02.44 PM

Screen Shot 2015-12-10 at 5.03.10 PM

Screen Shot 2015-12-10 at 4.48.26 PM

Las Vegas cultivated an economy based on strategically pulling in money from outside the region. Tourism, tax havens, property investment, and retirement villas turned a one horse town in a desert wasteland into a massive growth machine. Is Vegas built to last? Probably not. But it has demonstrated some basic principles that, for the time being, are highly effective.

IMG_5863 (1024x683)

IMG_5852 (1024x683)

Dubai has far less oil than its neighbors. The emires (Arabic kings) understood that once their modest supplies were pumped dry there would be nothing to fall back on. Their nation would sink into poverty and chaos. You don’t have to look very far in the region to see what happened to other nations whose leaders weren’t so thoughtful or wise. Nearby Yemen is the poster child for depletion, population overshoot, and collapse into bloodshed. 

Screen Shot 2015-12-10 at 11.56.47 PM

Screen Shot 2015-12-11 at 3.11.43 AM

Screen Shot 2015-12-11 at 3.10.25 AM

Dubai provides stability and order in a world where that’s often hard to find,so long as you can afford it. Pakistan, Sudan, and many other places are simply incapable of getting their sh*# together. In a troubled world middle and upper class people are looking for a safe haven to stash their money and their families. Dubai skims the cream off the turbulent bits of the planet. It’s a pure pay-per-view environment and the ultimate gated community. I honestly can’t blame people for choosing to relocate to Dubai when the alternative back home in Syria or Zimbabwe is what it is. This is especially true when so many other destinations aren’t so welcoming.

Screen Shot 2015-12-10 at 4.23.20 PM

Screen Shot 2015-12-10 at 10.44.35 PM

Screen Shot 2015-12-10 at 10.46.06 PM

Screen Shot 2015-12-10 at 10.47.08 PM

Screen Shot 2015-12-11 at 3.08.52 AM

Screen Shot 2015-12-10 at 5.58.59 PM

Screen Shot 2015-12-10 at 6.00.07 PM

Screen Shot 2015-12-10 at 6.08.29 PM

Screen Shot 2015-12-10 at 6.04.38 PM

At the same time armies of desperate workers from failed states are invited in to do the dirty heavy lifting on the cheap. Bangladesh, Pakistan, Ukraine, Burma, Nigeria, Bosnia… Depending on their skill set there’s a special niche for each type. Illiterate Malaysian men have one kind of use in construction. Pretty young women from the Philippines and Bulgaria are put to use as cleaners and nannies (among other things.) These workers are “guests” who are cycled through every couple of years thereby eliminating the need for pensions, schools, proper housing, health care, and other long term social obligations. This is the purest expression of neoconservative Reagan/Thatcherism. For better. And worse. But these workers wouldn’t be in Dubai at all if their home countries provided them with proper education and employment. 

Screen Shot 2015-12-10 at 11.56.24 PM

Screen Shot 2015-12-10 at 5.53.28 PM

Screen Shot 2015-12-10 at 5.52.21 PM

Screen Shot 2015-12-10 at 5.52.05 PM

Screen Shot 2015-12-10 at 5.51.04 PM

I can’t say I love Dubai or that I would ever want live there myself. But I understand it more now that I’ve poked around in person a couple times. I simply can’t criticize it in isolation without acknowledging how much Dubai is merely taking global trends to their logical extensions. From that perspective it’s a great mirror to examine conditions everywhere rather than indulge in obsessing about Dubai’s particular shortcomings. If you don’t like the place and what it stands for you might want to re-examine your own country first. They may be more similar than you think.

John Sanphillippo lives in San Francisco and blogs about urbanism, adaptation, and resilience at granolashotgun.com. He's a member of the Congress for New Urbanism, films videos for faircompanies.com, and is a regular contributor to Strongtowns.org. He earns his living by buying, renovating, and renting undervalued properties in places that have good long term prospects. He is a graduate of Rutgers University.

What's the Best Way Up for Minorities?

$
0
0

In presidential election years, it is natural to see our political leaders also as the brokers of our economic salvation. Some, such as columnist Harold Meyerson, long have embraced politics as a primary lever of upward mobility for minorities. He has positively contrasted the rise of Latino politicians in California, and particularly Los Angeles, with the relative dearth of top Latino office-holders in heavily Hispanic Texas. In Los Angeles, he notes, political activism represents the “biggest game in town” while, in Houston, he laments, politics takes second place to business interests and economic growth.

In examining the economic and social mobility of ethnic groups across the country, however, the politics-first strategy has shown limited effectiveness. Latinos, for example, have dramatically increased their elected representatives nationally since the 1990s, particularly in California. But both Latinos and African Americans continue to move to, and appear to do better in, the more free-market, politically conservative states, largely in the South.

Two Paths to Success

Throughout American history, immigrants and minorities have had two primary pathways to success. One, by using the political system, seeks to redirect resources to a particular group and also to protect it from majoritarian discrimination, something particularly necessary in the case of the formerly enslaved African Americans.

The other approach, generally less well-covered, has defined social uplift through such things as education, hard work and familial values. This path was embraced by early African American leaders such as Booker T. Washington and Marcus Garvey. Today, the most successful ethnic groups – Koreans, Middle Easterners, Jews, Greeks and Russians – demonstrate the validity of this method through high levels of both entrepreneurial and educational achievement.

Read the entire piece at The Orange County Register.

Joel Kotkin is executive editor of NewGeography.com and Roger Hobbs Distinguished Fellow in Urban Studies at Chapman University, and a member of the editorial board of the Orange County Register. He is also executive director of the Houston-based Center for Opportunity Urbanism. His newest book, The New Class Conflict is now available at Amazon and Telos Press. He is also author of The City: A Global History and The Next Hundred Million: America in 2050. He lives in Orange County, CA.

Photo "asian american" by flicker user centinel.

Trump, Sanders, and the Precariat

$
0
0

While the white working class is shrinking in the US, it remains the largest voting block in the country. That may be why leaders of both parties are concerned that white working-class voters, especially in the Midwest and South, are supporting populist candidates like Donald Trump and Bernie Sanders. They don’t understand that many of these voters blame Wall Street, corporate leaders, and politicians – the East Coast establishment –for destroying their jobs and communities over the past few decades.

Recent polls suggest that almost 60% of Americans, both Democrats and Republicans, “don’t identify with what America has become.” According to Cliff Young and Chris Jackson, these “nativist” Americans are older, whiter, and less educated than the rest of the population – more working-class, in other words. For some middle-class professionals, this “nativism,” exemplified in support for Donald Trump’s racial comments, simply reinforces the assumption that the white working class is inherently racist and foolish. They conveniently ignore the way racism is resurfacing among the middle class as they, too, feel resentment over their economic displacement. As Barbara Ehrenreich warns, “Whole professions have fallen on hard times, from college teaching to journalism and the law. One of the worst mistakes this relative elite could make is to try to pump up its own pride by hating on those — of any color or ethnicity — who are falling even faster.”

The focus on racism and xenophobia ignores an essential reality: precarity is bringing working-class and middle-class voters together politically. As Guy Standing has argued, the emerging precariat is a political class in the making. We see this in the “Fight for $15.” The struggle to increase the minimum wage seeks economic improvement for both the non-college and college educated.

This growing political block not only shares economic resentment but also the underlying racism that has been baked into American culture. No doubt, many college-educated whites looking for work have blamed multiculturalism and affirmative action for their current economic position, and they are just as likely as working-class people to respond to Trump’s racist rhetoric.

As Dan Bolz has suggested, “Trump’s appeal . . . underscores the resistance to the changes the country’s transition have brought forward.” Paul Krugman has suggested that “moderate Republicans and Third Way Democrats” who had tried to explain inequality in terms of skill-biased technological change are now lamenting the rise of Democratic populism. At the same time, progressive Democrats have complained that Sanders has ignored racial inequality while pandering to those facing economic inequality.

Leading Republican pundits like David Brooks and George Will have tried to dismiss Trump, a sure sign of conservative establishment fear. This has led to a squabble with Will calling Trump a “bloviating ignoramus” and Trump responding that Will is the “dumbest and most overrated political columnist of all time.” Some would say that Trump’s attack on political correctness and emphasis on “hot button” issues offer just type of mud fight the white working-class base wants. But more thoughtful moderate Republican pundits understand that such battles will not secure that base. For example, writers like Ross Douthat and Michael Gerson have been ignored and marginalized by the Republican establishment. A decade ago, Douthat and Rahein Salem tried to solidify working-class support by developing sound policy proposals that would appeal to what they called“Sam’s Club” Republicans. The Republican establishment trashed their ideas, and these writers have been reduced to rehashing the social values debate of an earlier era. E.J. Dionne has said Republicans are having trouble taking on Trump not only because “they have delivered next to nothing to their loyal white, working-class supporters.”

The Democratic Party establishment has its own set of fears — about Bernie Sanders. With significant contributions from Elizabeth Warren, Sanders has tried to move the party to embrace policies that are consistent with its New Deal roots. In a speech at Georgetown University, Sanders stressed the disappearance of the middle class, noting that productivity gains and income have been going to 1% of Americans. According to Sanders, a handful of oligarchs now control economic and political life in the U.S. He reminded the audience of the fight over New Deal reforms and types of security it brought to working Americans. Sanders’s takeaway was that “True freedom does not occur without economic security.”

Hillary Clinton has much less appeal for many working-class and minority Democratic voters. While she has sidestepped her past support for her husband’s policies on crime, drugs, welfare, and trade, these voters have not forgotten his legacy. In commenting on these issues, Clinton tends to pander to voters, as when she says that she opposes the Trans Pacific Partnership (TPP “at this time.” No wonder polls consistently show that the American public doesn’t trust her (though polls suggest they do trust Hillary more than the current crop of Republican candidates on some issues).

The Democratic establishment doesn’t worry about Clinton’s occasional forays in populism, which they see as political maneuvering. As Politico has reported, “None of them think she really means her populism.” But Sanders’s populist talk makes them cringe, because he connects with working-class resentment. His speeches appeal to the deep sense of injustice, unfairness, and inequality that many in the new precariat, especially millennials and African Americans, feel toward the East Coast establishment that took away their jobs, houses, and community and now even threatens their Social Security.

Clinton’s wealthy donor base recognizes Sanders’s appeal as a threat to their interests. Democratic Party leaders and their Wall Street backers hope that the Sanders fever will pass quickly and their adherents will then fall in line and embrace Clinton as the only viable option.

If Clinton and her advisors can’t connect with the new populism, voters may well heed the implication from Republicans that nothing will change no matter who is elected. They’re wrong, of course. With a fragile and deeply unequal economy and an aging Supreme Court, the stakes are too high.   But if Democrats are to win this year, they must understand that the populism that drives support for Trump is also central to Sanders’s appeal. Winning the 2016 election will require the kind of grassroots support that helped elect President Obama twice, but to build that support Democrats will have to address the disaffection and resentment of the new precariat.

This piece first appeared at Working Class Perspectives.

John Russo is a visiting fellow at Kalmanovitz Initiative for Labor and Working Poor at Georgetown University and at the Metropolitan Institute at Virginia Tech. He is the co-author with Sherry Linkon of Steeltown U.S.A.: Work and Memory in Youngstown (8th printing).

Photo by Gage Skidmore [CC BY-SA 3.0], via Wikimedia Commons

Migration is Back

$
0
0

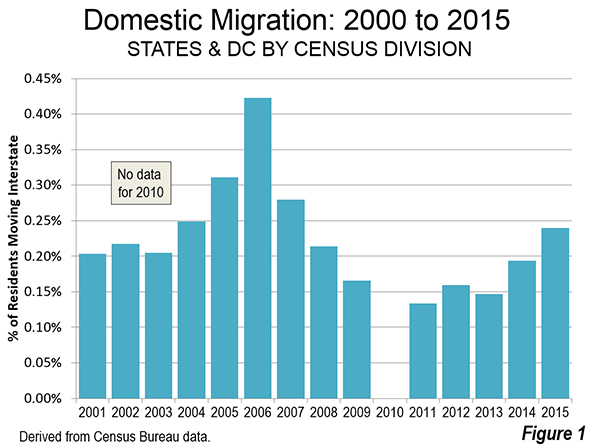
The 2015 state population estimates, recently released by the Census Bureau, indicate that interstate annual migration has begun to surge again. Between July 1, 2014 to June 30, 2015, up to 0.24% of US residents have migrated, returning to levels not experienced since the early 2000s. Interstate migration was just below the 2004 level of 0.25%, but trailed the much higher 2005 and 2006 levels (0.31% and 0.42%). By 2011, after the devastation of the housing bust and the Great Financial Crisis, interstate migration fell to 0.13% (Figure 1). In 2015, 763,000 US residents made interstate moves, the fifth highest figure since 2000. This was well below the peak of 1,251,000 in 2007 and well above the trough of 412,000 in 2011.

Regional and Divisional Trends

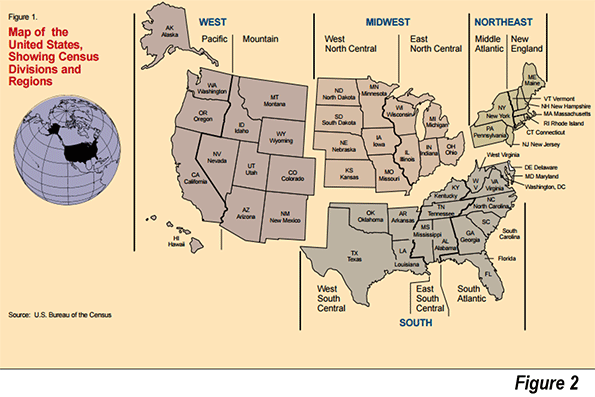
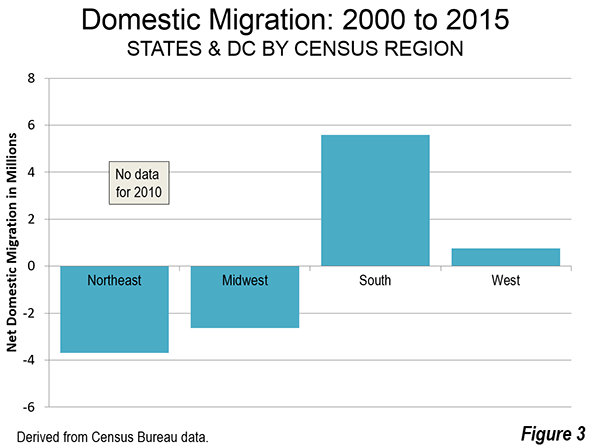
As opposed to those who claimed the Recession changed migration patterns, it turns out that domestic migrants are moving to just about the same places they did before. They continue to move principally to the South and, to a secondary degree, to the West (2000-2009 and 2010-2015, no data for 2010). The South has gained 5.6 million domestic migrants, followed by 0.8 million in the West. The Northeast has lost 3.7 million domestic migrants, while the Midwest has lost 2.7 million (Figures 2 & 3).

However, these regional trends mask important differences that have occurred at the division level within the regions (Figure 4). By far the most net domestic migration has been to the South Atlantic division, which stretches along the Atlantic coast from Delaware to Florida and includes West Virginia (Figure 4). The South Atlantic has added 3.8 million net domestic migrants since 2000. This is approximately double the 1.9 million gain of the Mountain division, which includes Western states that do not have a Pacific coast. The West South Central division, which includes Texas, added 1.4 million net domestic migrants, while the East South Central division, stretching from Alabama and Mississippi to Kentucky added 400,000 net domestic migrants. There were net domestic migration losses in the other divisions, including the Middle-Atlantic (New York, Pennsylvania and New Jersey), the East North Central (Ohio to Wisconsin), the Pacific (including California) and the West North Central (the Great Plains).

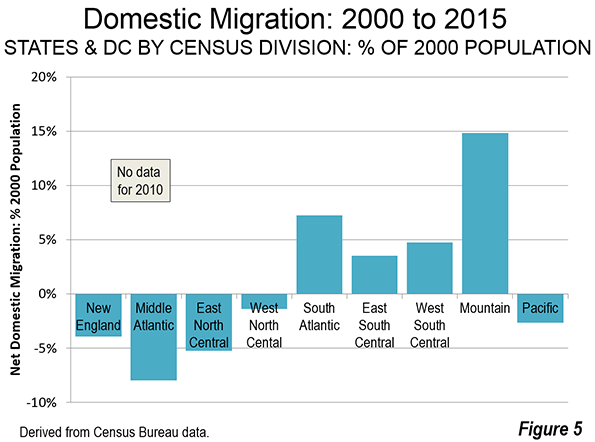
With its smaller population, the largest percentage gain in population from net domestic migration occurred in the Mountain division at nearly 15%. There were lesser gains in the three divisions of the South. The largest net domestic migration percentage losses were in the Middle-Atlantic, New England and East North Central divisions. The net domestic migration percentage losses were less in the Pacific division and least in the West North Central division (Figure 5).

In 2014, Northeast and the Midwest had only one state that added domestic migrants: North Dakota. Of course, with the present difficulties in the oil industry, it would not be surprising for North Dakota to fall back into its more familiar pattern of domestic migration decline in 2016. In every year since 2000, the East and Midwest have lost net domestic migrants in the aggregate. The South has gained in every year and the West in all years but one.

Out of the four divisions in the North East and Midwest, only the West North Central division has had a (single) positive year in net domestic migration in the 2000s. Similarly, the Pacific division has had only one positive net domestic migration year in the 2000s. The situation is virtually the opposite in the remaining divisions. The South Atlantic division and the Mountain division have both added net domestic migrants every year since 2000. The Texas anchored West South Central division and the East South Central division have both added net domestic migrants in 12 of the 14 years.

Early and Later Millennium

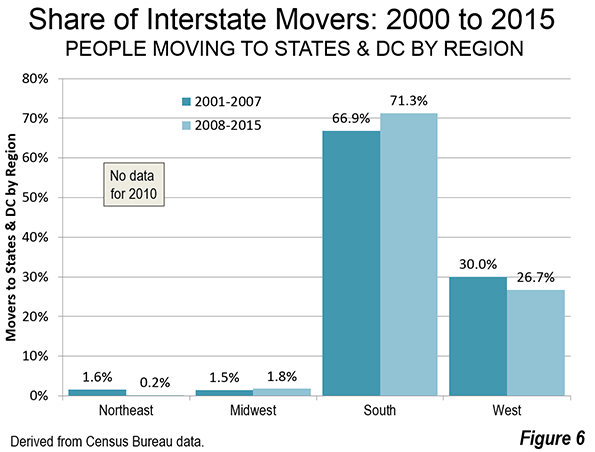
Breaking the period in two, the inflation, of the Housing Bubble (2000-2007) and the aftermath (2008-2015, except for 2010), the movement to the South recently has become somewhat stronger, while the movement to the West a bit weaker (Figure 6). The two regions captured 97 percent of net interstate migrants from 2008 to 2015. The Midwest appears to have done better in the later period, with 1.8 percent of the interstate migrants, up from 0.2 percent between 2000 and 2007. However, North Dakota alone accounts for two-thirds of the net interstate migration to the Midwest. Without North Dakota, interstate migration to the Midwest would have made up only 0.6 percent of the total.

State Highlights: 2014

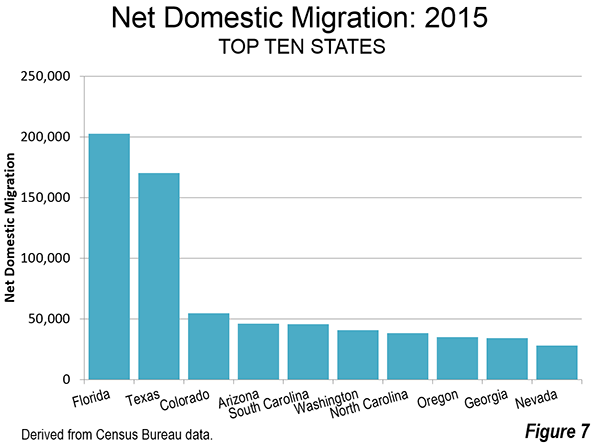
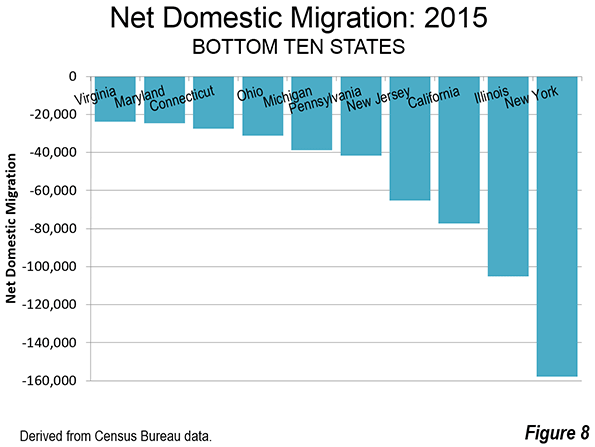
The bulk of the 763,000 net interstate migrants --- 91 percent (694,000) --- moved to the top ten states. Florida regained its lead for the first time since 2005, followed by Texas. All of the other top ten states attracted less than one-third the net domestic migrants that arrived in either Florida or Texas (Figure 7). A large majority of 763,000 net interstate migrants left the bottom ten states --- 78 percent (594,000). New York, Illinois, New Jersey and Illinois lost the most domestic migrants. Each of these states has routinely appeared at or near the bottom during since the beginning of the millennium (Figure 8).

Longer Term State Trends

Overall, eight states gained net domestic migrants in all 14 of the years since 2000 (Table). Of these, Arizona had the largest percentage gain, at 16.5%. However the greatest percentage gain was in Nevada, at 21.5%. However, Nevada had net domestic migration gains only in 12 years, having experienced declines in the years immediately following the housing bust.  

Florida had the largest net domestic migration numeric gain at 1,793,000, but like Nevada suffered two years of net domestic migration losses following the housing bust. Overall, 20 states have experienced net domestic migration gains over the period since 2000.

Two states, Minnesota and Massachusetts, have had 13 years of net domestic migration losses out of the last 14 years. Another nine states have had 14 years of net domestic migration losses out of 14. New York has suffered the largest loss, at 2,278,000 and the largest loss in percentage terms, 12.0%. California, also losing each of 14 years lost 1,739,000 net domestic migrants while Illinois lost 1,027,000 net domestic migrants in 14 years of losses. Others among the largest Northeastern states and Midwestern had 14 years of losses, including Ohio, Michigan and New Jersey. The exception was Pennsylvania, which had four years of net domestic migration gains.


NET DOMESTIC MIGRATION: 2000-2015
State/DistrictYears with Net Domestic Migration Gains: (Out of 14)RankNet Domestic Migration: % of 2000 PopulationRankNet Domestic Migration: NumberRank
Arizona14116.5%2      853,000 3
South Carolina14111.5%3      461,000 6
North Carolina14110.4%5      837,000 4
Delaware1418.0%8        63,000 19
Oregon1417.8%9      269,000 11
Texas1417.4%11   1,545,000 2
Tennessee1416.3%13      361,000 9
Washington1416.1%14      360,000 10
Idaho13910.0%6      130,000 13
Georgia1397.6%10      629,000 5
Montana1396.9%12        62,000 20
Nevada121221.5%1      433,000 7
Florida121211.2%4   1,793,000 1
Colorado12129.0%7      388,000 8
South Dakota11152.2%21        17,000 25
Virginia11152.0%23      142,000 12
Wyoming10175.3%16        26,000 23
Oklahoma10172.4%19        84,000 15
Alabama10172.0%24        89,000 14
West Virginia10170.5%26          8,000 26
Arkansas9212.7%18        72,000 16
Maine9212.1%22        26,000 23
Kentucky9211.6%25        65,000 18
New Mexico824-1.0%28       (19,000)30
North Dakota7255.3%15        34,000 21
Utah7253.0%17        67,000 17
New Hampshire7252.3%20        28,000 22
Missouri725-0.2%27       (10,000)28
District of Columbia629-2.7%36       (16,000)29
Wisconsin430-1.1%30       (60,000)35
Vermont430-1.3%31         (8,000)27
Pennsylvania430-1.3%32     (164,000)42
Iowa430-1.9%34       (57,000)34
Maryland430-2.9%38     (153,000)41
Alaska430-4.9%42       (31,000)31
Louisiana430-7.3%48     (326,000)45
Indiana337-1.1%29       (66,000)36
Mississippi337-2.6%35       (74,000)38
Rhode Island337-6.6%46       (70,000)37
Hawaii240-3.9%39       (47,000)32
Minnesota141-1.6%33       (79,000)39
Massachusetts141-5.1%43     (325,000)44
Nebraska043-2.8%37       (47,000)32
Ohio043-4.5%40     (507,000)46
Kansas043-4.5%41     (121,000)40
California043-5.1%44  (1,739,000)50
Connecticut043-5.8%45     (199,000)43
Michigan043-7.1%47     (711,000)47
Illinois043-8.3%49  (1,027,000)49
New Jersey043-8.4%50     (712,000)48
New York043-12.0%51  (2,278,000)51
Derived from annual Census Bureau population estimates (No data for 2010)


Restoration and then Some

Clearly the migration trends predominant in the years prior to the housing bubble and bust have reasserted themselves. It took more than a decade, and a World War to drag the United States out of the Great Depression and eventually to far greater prosperity. It has taken almost that long to accomplish the same thing following the Great Recession, though thankfully without a world war.  If a mild recovery has sparked a reversion to the historic norm, it would be fascinating to see what would happen under boom conditions.

Wendell Cox is Chair, Housing Affordability and Municipal Policy for the Frontier Centre for Public Policy (Canada), is a Senior Fellow of the Center for Opportunity Urbanism (US), a member of the Board of Advisors of the Center for Demographics and Policy at Chapman University (California) and principal of Demographia, an international public policy and demographics firm. He is co-author of the "Demographia International Housing Affordability Survey" and author of "Demographia World Urban Areas" and "War on the Dream: How Anti-Sprawl Policy Threatens the Quality of Life." He was appointed to three terms on the Los Angeles County Transportation Commission, where he served with the leading city and county leadership as the only non-elected member. He served as a visiting professor at the Conservatoire National des Arts et Metiers, a national university in Paris.

Photo: Florida Oranges by University of Florida IFAS

America's Next Boom Towns: Regions to Watch in 2016

$
0
0

Which cities have the best chance to prosper in the coming decade? The question is a complex one, and as the economy changes, so, too, will the best-positioned cities.

To identify the cities most likely to boom over the next 10 years, we took the 53 largest metropolitan statistical areas in the country (those with populations exceeding 1 million) and ranked them based on eight metrics indicative of past, present and future vitality. We factored in, equally, the percentage of children in the population, the birth rate, net domestic migration, the percentage of the population aged 25-44 with a bachelor’s degree, income growth, the unemployment rate, and population growth.

The results show two divergent kinds of ascendant cities. One is driven by the tech industry, the in-migration of educated people and sharply rising incomes; the other type is what we describe as “opportunity cities,” which tend to have a diverse range of industries, lower costs and larger numbers of families. We may be one country, but the future is being shaped by two very different urban archetypes.

The Lone Star Model

The most vital parts of urban America can be encapsulated largely in one five-letter word: Texas. All four of Texas’ major metro areas made our top 10. Austin, Houston, Dallas-Ft. Worth and San Antonio are very different places, but they all have enjoyed double-digit job growth from 2010 through 2014, well above the national average of 8.1%. They also all have posted income growth well above the national average.

But the biggest divergence from the pack may be demographics. The Texas cities have become major people magnets, with huge growth in their populations of young, educated millennials and households with children. The clear star of the show is No. 1-ranked Austin, which has become the nation’s superlative economy over the past decade.

Austin leads the pack in terms of population growth, up 13.2% between 2010 and 2014, in large part driven by the strongest rate of net domestic in-migration of the 53 largest metropolitan areas over the same span: 16.4 per 1,000 residents. The educated proportion of its population between 25 and 44 is 43.7%, well ahead of the national average of 33.6%, although somewhat below the traditional “brain center” cities of the Northeast and the West Coast.

The other Texas cities also do well across the board, with strong domestic in-migration, low unemployment and a rising population of young families. The biggest question marks going ahead involve No. 6 Houston, which benefited heavily from the energy boom and now is dealing with the consequences of the oil price collapse. Most economists do not see a total meltdown as occurred in the 1980s, but it would not be a surprise to see Houston fall out of our top 10 until energy prices recover. Economist Patrick Jankowski projects some 9,000 layoffs in the energy sector locally in 2016 but enough growth elsewhere — for example 9,000 new jobs in medical services — to keep employment expanding, although far below the pace of the last few years. The other, less energy-dependent Texas metro areas seem likely to continue their stellar performance.

The Flyover Superstars

There are several dynamic, fast-growing metro areas elsewhere in the country that seem likely to increase their status in the coming years, mostly in the Southeast and the Intermountain West. Like the Texas cities, these areas enjoy lower costs than the Northeast or California, notably for housing, and tend to be pro-business. All are experiencing significant population growth.

No. 2 Salt Lake City and No. 4 Denver have been expanding for years, with significant tech-sector growth. Both are logging population increases, with Denver benefiting from strong domestic in-migration while Salt Lake City has the highest birth rate among major metro areas, 16.9 per 1,000 women from 2010-14, largely due to its fecund Mormon population.

The Southeast has a number of ascendant cities led by No. 5 Raleigh, which, like Austin, has emerged as a tech hot-spot. Some 49% of all Raleigh residents aged 25 to 44 have a four-year degree, higher than any other metro area in the South. The national average is 33.6%.

The Glorious Gated Community

Unlike the rest of our rising cities, the Bay Area’s two major metro areas — No. 3 San Jose and No. 9 San Francisco — do not boast rapid population growth, and have low rates of family formation and births. Yet the area’s technology domination has made it so rich that it blows by most regions in terms of positioning for the future.

The big divergence here is income growth. Since 2010, the two metro areas have enjoyed the strongest expansion in earnings in the nation – 9.2% in the San Jose area between 2010 and 2015 and 7.8% in San Francisco. Silicon Valley and the Bay Area also boast extraordinarily well-educated young workforces. In San Jose 53.5% of workers aged 25 to 44 have a college degree, the third-highest share in the nation, and San Francisco ranks fourth at 52.4%.

Full List: America’s Next Boom Towns

So why are people not flocking to these areas? San Jose is net negative for domestic migration over the time we examined while San Francisco made modest gains only after years of net out-migration. Much of the problem lies in high housing prices, which, notes Dartmouth College economist William Fischel, have turned the Bay Area and the Valley into an “exclusionary region” inaccessible to all but the wealthy and highly gifted.

Given the growing importance of the technology industry, it seems likely that this gated region will continue to thrive in the years ahead, albeit with a low level of new family formation, relatively few children and a limited middle class. It’s a model that some cites may wish to duplicate but few will be able to. Perhaps the most promising candidate to join this list is No. 15 Seattle, which also has experienced strong job growth, largely from technology and boasts a large population of college graduates.

The Fading Big Enchiladas

Perhaps the most glaring omissions at the top of our list are America’s three largest metropolitan areas: New York, Los Angeles and Chicago. Of the three, New York does best, but only well enough for 36th place, hardly what one would expect for America’s, and arguably the world’s, premier city.

New York has high costs like San Francisco but a far more bifurcated economy and demographics. Wall Street may be approaching the end of an epic run, but overall incomes in New York have fallen 0.5% since 2010. Employment has expanded a respectable 7.3% over the past five years, roughly the national average, but the metro area has the highest rate of domestic out-migration in the country.

Similar dynamics have lowered future prospects for Los Angeles and Chicago. Ranked 39th, Los Angeles has posted better job growth than New York at 10.2%, but its income losses were also more severe, down 3.8%. As in Gotham, the elites of Southern California in entertainment, real estate and technology may be thriving, but the vast majority are not doing so well, as manufacturing, construction and business services have lagged. Los Angeles’ population — more heavily Latino and African America — is also less well-educated, with only 34.8% of adults 25 to 44 holding bachelor’s degrees, a good 20 points less than their San Francisco-area competitors.

Chicago, ranked 40th, appears to have worse prospects. For all its problems, Los Angeles still dominates entertainment, has the largest port in the country, close Pacific Rim connection and enjoys the finest weather on the continent. Chicago has none of those advantages, although it boasts a very attractive downtown. The region around the magnificent mile is not doing well, with low job and population growth, stagnant incomes and strong out-migration. Urban analyst Pete Saunders describes Chicago’s economy as “one-third San Francisco and two-thirds Detroit.” That seems more true than many Windy City boosters would like to admit.

Future Of The Future

Of course the future is not completely predicable and many things could change in the coming years. In the short run, as mentioned above, the energy boom towns will take a bit of a hit. Energy slowdowns could impact other cities with a concentration in this industry, notably Denver, Salt Lake and even Columbus, near Ohio’s big natural gas and oil reserves.

But other factors suggest that these lower-cost cities will do well into the future. Columbus, Ohio, for example, may see its  job growth impacted, but the benefits of strong in-migration will linger, particularly the growing numbers of college-educated millennials who have headed to it and other more affordable Rust Belt metro areas in recent years.

Ultimately we may see the emergence of two distinct urban futures. One will emerge in elite “gated” regions such as San Francisco, San Jose, and, perhaps in the near term, Seattle. These areas will dominate many key tech sectors, and will continue to leverage their well-educated populations. The other will be more along the Texas model, diversified economies driven by lower costs, particularly for housing, diversified economies and increasingly well-educated populations.

Rather than being fundamentally incompatible, this enormous country should have room for both models. America needs its elite centers, but there also have to be cities for middle-class families. Each can claim a piece of the future.


2016 Regions to Watch Index
RankRegion (MSA)ScoreChildren age 5-14, 2014Job Growth, 2010-2015Popltn Change, 2010-2014Earnings growth, 2010-2015Domestic Mig rate 2010-2014Birth rate, 2010-2014Bachelor's degrees, Age 25-44, 2014Unemplymt, Nov 15
1Austin75.613.7%19.1%13.2%1.5%16.413.843.7%3.3%
2Salt Lake City66.316.2%14.8%6.0%2.1%-0.116.931.2%2.9%
3San Jose65.613.1%21.3%6.3%9.2%-1.813.153.5%3.9%
4Denver63.213.6%15.0%8.3%0.8%9.313.143.9%3.2%
5Raleigh63.114.7%15.4%10.0%-1.6%11.012.949.0%4.6%
6Houston63.015.2%15.2%9.6%3.8%7.415.032.5%4.9%
7Dallas61.115.2%15.0%8.2%0.7%6.614.433.4%4.0%
8San Antonio58.614.5%12.5%8.7%1.1%9.914.127.6%3.8%
9San Francisco56.611.4%15.7%6.0%7.8%2.911.752.4%3.9%
10Oklahoma City56.213.9%9.3%6.7%3.5%6.814.530.4%3.6%
11Nashville56.113.3%14.8%7.3%1.7%8.913.137.8%4.3%
12Charlotte54.314.1%15.4%7.4%0.9%8.812.837.6%5.1%
13Minneapolis52.113.6%8.7%4.4%-0.6%0.113.344.9%2.7%
14Columbus51.213.5%10.8%4.9%0.7%2.613.740.7%3.9%
15Seattle50.912.2%13.8%6.7%4.0%4.312.843.1%4.9%
16Atlanta50.814.6%11.9%6.2%0.8%3.513.338.2%5.0%
17Orlando49.112.6%16.6%8.8%-1.5%8.212.131.0%4.5%
18Grand Rapids48.214.0%20.0%3.9%-2.2%1.713.537.1%5.2%
19Phoenix48.114.2%12.9%7.1%-2.1%6.513.729.3%5.0%
20Indianapolis47.914.3%11.0%4.4%-2.2%2.113.836.4%4.2%
21Washington47.812.9%5.3%7.0%-3.4%0.413.853.2%4.1%
22Portland47.512.7%12.2%5.5%3.1%5.112.138.9%4.8%
23Kansas City45.814.2%6.9%3.1%-0.3%-0.313.639.5%3.9%
24San Diego44.112.1%9.6%5.4%1.9%0.314.038.7%4.8%
25Boston43.111.4%8.4%3.9%2.2%-0.511.254.1%4.1%
26Cincinnati39.413.6%6.4%1.6%0.4%-2.112.937.0%4.2%
27Louisville39.313.0%10.2%2.8%-1.2%1.512.531.7%4.2%
28Riverside39.015.0%13.9%5.1%-2.7%1.614.118.8%6.1%
29Jacksonville39.012.7%9.0%5.5%-2.4%5.412.728.2%4.7%
30Richmond38.312.7%5.3%4.3%-2.4%3.112.038.1%4.2%
31Detroit37.512.9%12.0%0.0%-1.6%-4.611.633.9%3.0%
32Sacramento36.713.3%8.3%4.4%-0.6%1.712.532.2%5.5%
33Tampa35.811.5%10.2%4.7%-1.6%6.410.931.3%4.6%
34Miami35.011.4%12.6%6.5%-1.7%0.911.431.3%5.0%
35Milwaukee35.013.3%4.9%1.0%-1.0%-3.412.838.3%4.4%
36New York35.012.1%7.3%2.7%-0.5%-6.312.744.8%4.7%
37Baltimore34.912.4%6.8%2.8%-1.2%-0.612.343.9%5.3%
38Las Vegas33.813.5%13.6%6.1%-6.5%4.713.222.4%6.3%
39Los Angeles33.712.5%10.2%3.4%-1.8%-3.613.034.8%5.3%
40Chicago32.913.3%6.5%1.0%-0.1%-6.012.741.7%5.4%
41Birmingham31.913.1%5.5%1.4%-1.1%-0.612.932.3%5.2%
42St. Louis31.812.8%4.2%0.7%-0.4%-3.312.238.4%4.6%
43Philadelphia31.612.4%3.8%1.4%-1.7%-3.012.141.7%4.6%
44New Orleans31.212.6%4.5%5.2%-6.0%4.712.733.4%5.6%
45Cleveland30.112.3%5.2%-0.7%0.3%-4.311.234.5%3.7%
46Memphis29.514.2%3.6%1.4%-0.8%-4.014.228.3%6.1%
47Pittsburgh28.810.8%3.9%0.0%2.6%0.410.142.2%4.5%
48Virginia Beach28.812.3%1.0%2.4%-1.2%-3.513.430.1%4.6%
49Tucson25.312.3%3.7%2.5%-3.9%0.112.129.1%5.3%
50Buffalo25.011.6%3.7%0.1%0.3%-2.310.636.8%4.9%
51Hartford24.511.9%5.5%0.2%-1.6%-5.710.041.9%4.8%
52Rochester23.911.9%3.3%0.3%-2.5%-3.910.836.6%4.6%
53Providence23.311.5%5.1%0.5%-0.4%-3.210.433.2%4.9%

Analysis by Mark Schill, Praxis Straetgy Group (mark@praxissg.com). The index incldues eight equally-weighted measures: share of population age 5-14, 5-year job growth, 5-year population change, 5-year real earnings growth, annual average domestic migration rate, annual average birth rate, share of young population with a bachelor's degree, and current unemployment rate.

This piece first appeared in Forbes.

Joel Kotkin is executive editor of NewGeography.com and Roger Hobbs Distinguished Fellow in Urban Studies at Chapman University, and a member of the editorial board of the Orange County Register. He is also executive director of the Houston-based Center for Opportunity Urbanism. His newest book, The New Class Conflict is now available at Amazon and Telos Press. He is also author of The City: A Global History and The Next Hundred Million: America in 2050. He lives in Orange County, CA.

Mark Schill is a community process consultant, economic strategist, and public policy researcher with Praxis Strategy Group.

SaltLake City photo by Skyguy414.

China's Navy: A Maritime Power?

$
0
0

When China’s navy looks beyond its coastal waters, which it increasingly does, it sees a kind of Great Wall. The Chinese call this the “First Island Chain,” a line of islands, some small, others huge, extending from the Japan archipelago to the north, the Ryuku island chain past Taiwan, and the Philippines to the south. The waters within this arc are considered an integral part of China itself.

Increasingly, China’s sailors are penetrating this barrier through various choke points to gain access to the broader Western Pacific Ocean. In late November, a large formation of Chinese long-range bombers and support craft passed through the gap between Okinawa and the island of Miyako, the so-called “Miyako Channel".

The Miyako Channel is strategically vital for China because it is one of the few international waterways through which the Chinese navy and air can access the Pacific Ocean without violating somebody’s space. It is also located close to the Japanese-controlled Senkaku islands which are also claimed by China.

The first time a Chinese H-6K bomber passed through the channel was September, 2013; the first multi-plane formation to use this passageway was in May this year, and late this year an unusually large formation of eight bombers and support aircraft passed through the gap, flew around the Pacific, and then returned to home base through the channel.

The H-6K is a modified and much improved version of an old Soviet Tu-22 bomber, known as a “Badger”. It has been configured to hold cruise missiles under its wings or in its bomb bay. The planes reportedly flew about 620 miles into the Pacific before returning to their home base near Shanghai.

Both the Chinese navy and the air force are learning to conduct extended maritime operations far from home waters and into the wider Western Pacific. Of course, China has maintained a permanent, rotating flotilla of two destroyers and a supply ship in the waters off the coast of Somalia and the Gulf of Aden since 2009. Unlike Japan, it does not have a permanent base in that region, although it is seeking one.

In March, 2014, two Chinese warships docked at Abu Dhabi, the first time a Chinese fleet had made a port call on the Arabian Peninsula since the days of the Treasure Ships of Admiral Zheng He. In 2013, the Chinese navy made its first goodwill visit to South America, and it stationed a guided missile frigate in the Mediterranean to help escort ships removing chemical weapons from Syria.

These missions are not war fighting, but the ships have enhanced capabilities for operating in seas far from home. They have gained experience in coordinating with other naval services on anti-piracy patrol, and exercised with other navies, including those of South Korea and Pakistan.

In the summer of 2013 a Chinese naval flotilla passed through the Soyu Strait, which separates Hokkaido from the southern tip of Russia’s Kurile islands; they returned to their home base through the Miyako Channel. The People’s Daily trumpeted this maneuver as if it were a major triumph. Never mind that these narrow waters are international passageways or that they could easily be closed off if the Japanese decided to do so.

China routinely conducts naval and air exercises beyond the First Island Chain as far away as the Philippine Sea, and the number of Chinese naval flotillas passing through the First Island Chain has increased significantly in recent years. There were two in 2008 and 2009, four in 2010, five in 2011, and eleven in 2012. In 2012 surface combatants were deployed seven times to the Philippine Sea; they were deployed nineteen times in 2013. The Maneuver-5 exercise in the Philippine Sea involved units from all three of China’s fleets, its largest open-ocean exercise to date.

The Chinese navy has now penetrated all of the Western Pacific choke points along the chain, from the Tsuruga Strait separating Hokkaido from Honshu in northern Japan to the Bashi Strait separating Taiwan from the Philippines and the Sunda Strait in Indonesia. In October, 2012 a flotilla exited the East China Sea through the narrow passage way between Taiwan and Japan’s Yonaguna island in the Ryukyu chain (where the Japanese army has constructed a surveillance radar).

This is thought to have been a signal from Beijing of displeasure over Tokyo’s decision to buy the Senkaku islands a month earlier. Later, two Sovremnny Class destroyers and two frigates exited the chain through the Miyako Strait and returned via the waters separating Yonaguna from Taiwan.

The navy has steadily progressed from a handful of vessels, to multi-fleet (i.e. elements from all three of China’s fleets), to combined operations with submarines, drones and long-range bombers. Not only does China maintain a permanent anti-piracy force in the Indian Ocean, it now routinely conducts naval exercises and operates beyond the First Island Chain, says the US National Defense University.

This year China was invited to participate in the Rimpac exercise in waters near Hawaii. It sent a destroyer, but also an intelligence-gathering ship, making it possibly the first time a nation spied on an exercise in which it was a participant.

When queried as to its purpose and intentions of these missions, Beijing has a standard reply: “The training is in line with the relevant international practices and is not aimed at any one country or target and poses no threat to any country or region.”

In June, 2015, Beijing issued a white paper on its defense priorities in which it stated what has been obvious to any naval planner paying attention: that China's naval interests are no longer limited to its coastline, but span the globe. “The traditional mentality [going back to Mao Zedong] that the land outweighs the seas must be abandoned,” the paper states.

That the Chinese navy will enhance its capabilities for “open seas protection” just puts into words what is actually happening. The white paper leaves little doubt that China is intent on transforming itself into a modern maritime power, capable of challenging Japan or the US in Asia and elsewhere.

Todd Crowell is the author of The Coming War, published by Amazon as a Kindle Single.

First Island Chain (perimeter marked in red) map by Suid-Afrikaanse (GFDL) via Wikimedia Commons


Around The World, The Tide Is Turning Against Megacities

$
0
0

The massive construction waste collapse last month in Shenzhen reflects a wider phenomenon: the waning of the megacity era. Shenzhen became a megacity (population over 10 million) faster than any other in history, epitomizing the massive movement of Chinese to cities over the past four decades. Now it appears more like a testament to extravagant delusion.

In 1979, Shenzhen was a small fishing town of roughly 30,000 people when it became a focus of former Chinese leader Deng Xiaoping’s first wave of modernization policies. Now it is a metropolis of 12 million whose population grew 56 percent between 2000 and 2014. For years, it stood as the brash wunderkind of Chinese cities, proud of its gleaming infrastructure that is now increasingly suspect.

The Shenzhen collapse came four months after a similar deadly public safety disaster in Tianjin, another relatively new megacity, where an explosion at a chemical warehouse killed 173 people. And of course, there is the widespread urban air pollution that is hazardous in Beijing and simply noxious elsewhere. Simply put, the once compelling “economies of scale” offered by increasing the size of cities have broken down in urban agglomerations over 10 million people, where their size has now become encumbrances to further growth, not to mention the happiness and health of their citizens.

One big problem with megacities, the Chinese are discovering, is their impact on property prices and fertility. Chinese may have been freed last year from the tyranny of the one-child policy, but don’t expect a baby boom in any of the biggest, most glamorous cities. Shanghai has among the lowest fertility rates in the world, one-third of the replacement rate. Beijing and Tianjin suffer a similarly dismal fertility rate.

This reflects both crowded conditions and insanely high property prices that, on an income-adjusted basis, now are far higher than those in expensive world cities like Vancouver, London, Sydney, San Francisco and New York — two times higher in some cases.

The population growth rate in Beijing and Shanghai has dropped dramatically since 2010, according to  demographer Wendell Cox. The population of China’s capital expanded 3.9 percent a year from 2000 to 2010; growth slowed to 2.3 percent annually from 2010 to 2014. In Shanghai the population growth rate for the same periods slowed from 3.4 percent annually to 1.3 percent. High degrees of pollution have led at least some affluent urban Chinese to move back toward the countryside, as well as to cleaner, less congested regions in Australia, New Zealand, and North America.

Nonetheless, the Chinese government remains committed to driving further urbanization to boost economic growth, aiming to turn more rural farmers into city-dwelling, free-spending consumers. In 2014 the government set a goal to increase the ratio of the Chinese population that lives in cities to 60% by 2020 from 53.7% then. But  the urbanization strategy aims to funnel migrants to small and midsize cities with less than 5 million residents, maintaining tight restrictions on legal migration to the megacities.

To make the smaller cities more attractive Beijing promised to ramp up infrastructure spending, and local governments have rolled out housing subsidies, tax breaks and cheaper mortgages to lure migrants. Whether that will be enough to counteract the pull of the megacities’ bigger job markets is an open question.

Peak Megacity In Much Of The World

Until recently the worldwide trend toward megacities — there were 34 in 2014 — has seemed relentless. But in much of the world this trend is slowing down. The populations of Europe and North America are growing slowly, with the exception of London and Moscow. In the last decade the population of New York City grew at roughly one third the relatively low national rate.

Where megacities can be expected to grow in the future are in the backwaters of the global economy, in Africa and parts of Asia, where the most rapid population growth and urbanization is taking place.

In an impressive 2011 study, the consultancy McKinsey predicted that through 2025, population growth would shift to 577 “fast-growing middleweight” cities many of them in China and India, while, in contrast, megacities would underperform economically and demographically.

In India as well, population growth rates have slowed considerably for two of its three largest cities, Mumbai and Kolkata, while New Delhi has become the country’s largest megalopolis. More rapid population growth has taken place in mid-sized cities such as Hyderabad, Pune, Chennai, and Bangalore, as well as in smaller cities like Coimbatore, home to 2.5 million, that have seen much of the industrial and tech growth in the country.

Urban decentralization has become something of a theme of the government of Prime Minister Narendra Modi, who implemented a program of “rurbanization” as Chief Minister of the state of Gujarat. Villages are still home to the vast majority of Indians and serve as the primary source of new urban migrants. Modi speaks of human settlements with the “heart of a village” and developing “the facilities of the city.”

Singapore-based scholar Kris Hartley notes a shift of industrial and even service businesses to more rural locales in Southeast Asian countries like Thailand, Vietnam and Indonesia, and parts of China. As megacities become more crowded, congested, and difficult to manage, Hartley suggests, companies in these areas are finding it more convenient, less costly, and better for the families of their employees to locate farther from giant cities.

Where Megacities Will Grow Fastest

According to U.N. estimates, 99 percent of all population growth between 2010 and 2100 will take place in developing countries, some 83 percent in Africa alone followed by 13 percent in Asia, particularly the less developed parts.    

Rather than an indicator of the future, megacity growth in these regions increasingly is something of a lagging indicator of an early phase of urbanization. Growth projections suggest the evolution of two more megacities in Africa: Johannesburg-East Rand (South Africa) and Luanda (Angola).  They will join Lagos in Nigeria, as well as the rapidly growing and poor megacities Cairo and Kinshasa, as well as Karachi in Pakistan

As is the case in India, these cities will likely be most prolific in producing slums. Worldwide there are now as many as a billion denizens of these depressed areas, threatening the social stability of not only of their countries but also the world, as they tend to generate high levels of both random violence and more organized forms of thuggery, including terrorism.

One does not have to be a Gandhian idealist to suggest that perhaps dispersion, not concentration, provides a better model for future urban growth in developing countries, offering more space, privacy, and connection to nature, note social scientist Robert Obudho. A focus on large city development, he argues, will exacerbate problems, while shifting toward smaller-scale areas could encourage more “self-reliance, spatial equity, [and] local participation.”

Ultimately, a shift toward dispersion—both within regions and between them—has been made more feasible in the developing world, as in the West, by new technology. Smaller cities and even villages are no longer as economically isolated and are brought closer to the outside world through the use of cell phones and the Internet. Economic growth in these places could help stem megacity migration by closing the gaps in living standards of rural people relative to their urban counterparts, as has occurred in western countries.

Such ideas need to be heard more in the discussion about cities in the developing world. We need to confront the urban future with radical new thinking. Rather than foster an urban form that demands heroic survival, we should focus on ways to create cities that offer a more prosperous, healthful and even pleasant life for their citizens.

Joel Kotkin is executive editor of NewGeography.com and Roger Hobbs Distinguished Fellow in Urban Studies at Chapman University, and a member of the editorial board of the Orange County Register. He is also executive director of the Houston-based Center for Opportunity Urbanism. His newest book, The New Class Conflict is now available at Amazon and Telos Press. He is also author of The City: A Global History and The Next Hundred Million: America in 2050. He lives in Orange County, CA.

Photo: Shenzhen:  Binhe Avenue from the Shun Hing Tower (by Wendell Cox)

Is California’s Economy Swell?

$
0
0

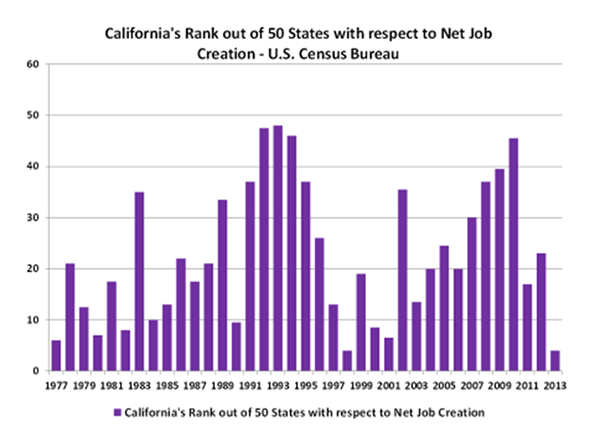
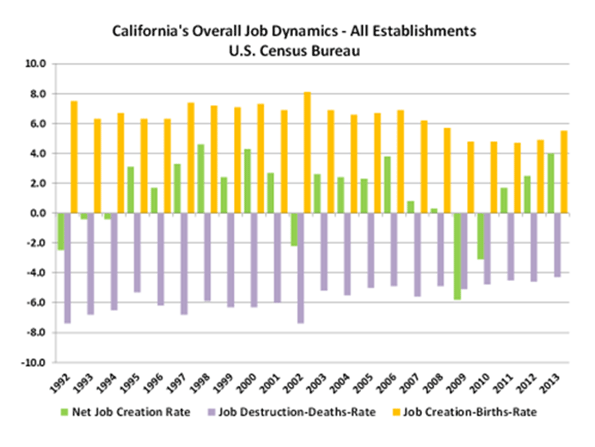
Every now and then, something happens to cause California’s comfortable establishment to celebrate the state’s economy.  Recent budget surpluses and jobs data have provided several opportunities, never mind that these are hardly summary statistics.  They don’t tell the complete story.

The celebrants conveniently ignore California’s nation-leading poverty, huge inequality, persistent negative domestic migration, and the fact that with about 12 percent of the nation’s population, California is home to about 30 percent of the nation’s welfare recipients.

A recent Next 10 report, prepared by Beacon Economics, has provided another opportunity for celebration.  The Los Angeles Times’ coverage of the report is here.  Their reporter, Chris Kirkham, provides a straight-forward summary, including charts not in the original report and quotes from people who might not be expected to be mindless cheerleaders.  Full disclosure: He tried to interview me, but I was unavailable.

My favorite coverage was a celebratory piece at The National Memo, by one Froma Harrop, titled High Taxes, Regulations, and a Swell Economy.  Try telling the children of one of the several families living in a single-family home, children with little prospect of ever living a middle-class lifestyle, that California’s economy is swell.  Try telling that to the huge numbers of long-term unemployed in California’s Central Valley, or one of the many people who, like Martin Saldana, have been poorly served by California’s swell economy.  California’s economy might be swell, but only for a portion of the population.

Harrop, and apparently large numbers of California’s comfortable establishment, don’t appear to care much about their less-fortunate fellow citizens.  She’s channeling Marie Antoinette when she says “OK.  Those who can’t pay the price—or who want bigger spaces—can and often do consider other parts of the country.”

Right.  What about all the people who provide services to California’s wealthy coastal residents in places like Monterey and Santa Barbara?  What about counties like Napa and Ventura that insist, by law, that land be set aside for agriculture, an industry that employs thousands, but can’t survive and pay wages that would allow a respectable standard of living in these high-cost counties?

This time the celebration turns out to be about nothing.  The Next 10 report is seriously flawed.  The first hint of weakness is on the first page of the actual report, page 4 of the document, where they say “This analysis is trying to show….”  Serious analysis attempts to answer questions, not support a pre-conceived opinion.

The next clue is Table 1.  In a report filled with time series, the authors present data on one point in time, say that California has the fourth highest net job growth rate, and conclude all is good.  Why would they do that?  Could it be that the time series doesn’t support the narrative?

Actually, they used the only recent year where California performed significantly better than the United States.  Here’s the data in time series.  It’s similar to a chart in the Los Angeles Times’ piece.  We compare California’s net job creation rate with that of the United States:

Doesn’t look so spectacular, does it? 

Maybe the rankings would look better?  Below is a chart of California’s ranking going back to 1977.  Remember, one is good, 50 is bad:

The narrative isn’t supported here either.  California has only ranked in the top 20 twice since 2006, and over that time it’s been in the bottom 20 three times.  Indeed, California has been in the top ten only once since 2001.  That was the data point they used in their analysis.

The report has other weaknesses.

Consider the charts 4a through 4f.  Combined, they purport to show that for California, firms of all ages were net job creators every year.  There is no year where they show firms of any age group having net job losses.  Given the well-documented massive California job losses in the past few recessions, this is simply unbelievable. 

Indeed, a close look at the charts yields apparent internal inconsistencies.  Chart 4e is an example.  In 2002, 2009, and 2010 job destruction rates were far greater than job creation rates, but somehow they report that net job creation rates managed to remain positive in each of these years?  For the record, we built a chart using aggregate data that show net job loss rates for all California establishments of -2.2, -5.8, and -3.1 for the years 2002, 2009 and 2010, respectively:

California’s apologists don’t do themselves any favors by resorting to such shoddy and misleading work.  California has had some good job years recently.  It also has some huge strengths.  These include a world-leading venture capital infrastructure, a world-leading climate, and a fantastic location between Asia and the massive American consumer market.

California has some huge challenges too, including the poverty, inequality, and limited opportunity for minorities.  Ignoring these challenges and exaggerating the state’s strengths is a guarantee that California will never be the land of opportunity that it was --- or could be.

Bill Watkins is a professor at California Lutheran University and runs the Center for Economic Research and Forecasting, which can be found at clucerf.org.

Why High Taxes Aren’t the Only Reason GE Left Connecticut

$
0
0

General Electric, unhappy with a recent corporate tax increase in Connecticut, has now announced that it is relocating to Boston’s south waterfront. Indeed Connecticut’s tax climate is bad, ranking 44th according to the Tax Foundation, but GE’s move points to much bigger problems in the state.  I examine this in my new piece over at City Journal. Here’s an excerpt:

For decades, nearby New York City’s pain was Connecticut’s gain. New York was a grim, dangerous, failing city that almost went bankrupt in the 1970s. More than 100 Fortune 500 companies fled during that era, many heading to suburban New Jersey and Connecticut—including GE, which moved in 1974 from 570 Lexington Avenue to Fairfield, Connecticut. The same story played out in cities across America, with corporations fleeing dying downtowns for the safety of the suburban office campus.

Today, cities are back. The policing revolution—helped by the waning of the crack epidemic—made cities safe again. Core public services were slowly restored, parks were rebuilt, and transit systems were cleaned up and refurbished. Investment started returning. The structure of the economy changed, too. Starting in the 1990s, technology radically transformed the business world and is now a major industry in its own right. The financial industry was deregulated. Globalization drove demand for new types of business services, reinforcing the need to stay on top of a constantly shifting landscape. People with advanced, specialized knowledge are the ones who help companies innovate now. These employees work in highly interactive ways that benefit from clustering together—disproportionately in urban areas like New York, Chicago, and Boston.

Click through to read the whole thing.

Aaron M. Renn is a senior fellow at the Manhattan Institute and a Contributing Editor at City Journal. He writes at The Urbanophile, where this piece originally appeared.

Photo: The former General Electric/Remington facility in Bridgeport, CT. The buildings have been demolished in recent years.

In Southern California, It Takes an Assortment of Villages

$
0
0

Among urban historians, Southern California has often had a poor reputation, perennially seen as “anti-cities” or “19 suburbs in search of a metropolis.” The great urban thinker Jane Jacobs wrote off our region as “a vast blind-eyed reservation.”

The Pavlovian response from many local planners, developers and politicians is to respond to this criticism by trying to repeal our own geography. Los Angeles’ leaders, for example, see themselves as creating the new sunbelt role model, built around huge investments Downtown and in an expensive, albeit underused, subway and light-rail network.

Yet the notion of turning Southern California into a dense, New York hybrid makes very little sense. Nor has it done much for the regional economy, certainly in Los Angeles. The City of Angels thrived during its period of development into a multipolar region; in the 21st century, as Downtown has gained a few thousand hipsters, the rest of the city has lagged economically while population and job growth – including in tech – has been more robust in the surrounding counties of Orange, Riverside and San Bernardino.

Building off Strength

Southern California, even before the advent of the freeways, developed along the lines of an “archipelago of villages.” Even Downtown Los Angeles, the one legitimate urban core in the region, lost its central relevance by the 1930s and, despite all its self-promotion, employs close to the smallest share – well short of 3 percent – of the regional workforce of any large region in the country.

In contrast, the two fastest-growing areas in Southern California – the Inland Empire and Orange County – are arguably the largest regions in the country without a real downtown. Rather than a negation of urbanity, as some suggest, these areas are nurturing an expansive archipelago of smaller hubs, each serving distinct geographies, populations, tastes and purposes, and constitute the building blocks for Southern California’s urban future.

Read the entire piece at The Orange County Register.

Joel Kotkin is executive editor of NewGeography.com and Roger Hobbs Distinguished Fellow in Urban Studies at Chapman University, and a member of the editorial board of the Orange County Register. He is also executive director of the Houston-based Center for Opportunity Urbanism. His newest book, The New Class Conflict is now available at Amazon and Telos Press. He is also author of The City: A Global History and The Next Hundred Million: America in 2050. He lives in Orange County, CA.

American Extremism is a Product of American Apathy

$
0
0

Much research has gone into studying the political polarization that has gripped American politics. Why have the two American parties moved to the extremes? One explanation, championed by MIT Professor Noam Chomsky is that the Republicans have ceased to be a functioning party. Chomsky claims that the GOP has wholly given itself over to the rich, and in order to win elections has been forced to appeal to the radical fringes of American society, who he defines as Evangelicals, nativists, racists and gun fanatics.

Peter Wehner, Senior Fellow at the Ethics and Public Policy Center, argues that rather than the GOP moving to the right, it’s the Democrats who have moved dramatically to the left. Wehner argues that while Bill Clinton revived the Democrats from nearly twenty years of political defeats by abandoning left-wing politics and embracing centrist policies, Obama ran as an unabashed liberal, and today Hillary Clinton and Bernie Sanders have only followed suit. There may be other, less directly political reasons.

A Princeton study claims that political polarization has been a frequent occurrence as inequality has increased in the United States, and extremism has been a regular response to economic woes. Another study by UC Berkeley places the blame not on the parties or society, but on the voters themselves, who political scientist David Broockman argues have spontaneously become fanaticized, even more so than their representatives.

These are all interesting ideas, but most lack hard numbers, and what little numbers are offered come from selective results of specific poll questions asked to a few thousand people at most. If we were to look at the total voting practices of the American people, what insight could we draw? I set about to do just that and have concluded that the driving force of political polarization in America is from profound voter apathy. I am not saying that Chomsky, Wehner, Broockman or any other political theorists are necessarily wrong, but while their arguments seek to explain why the two extremes have become ascendant they fail to address or minimize the shocking disappearance of the moderates in both parties. The disappearance of the center, particularly in the primaries, explains political polarization in America, not the rise of the fringes.

Pundits and political experts have placed far more emphasis on primaries over the past six years due to the rise of the Tea Party. Despite the evident surge in media attention by elites and massive donations by the super-rich on both sides, the presence of voters in the primaries has been collapsing to all-time lows. In 1972, 30.9% of registered voters participated in the primaries. That number has dropped nearly every year, to 21.7% in 1992 at the beginning of the Clinton era, and 19% in 2000. In 2008, in the heavily-contested race between Clinton and Obama, primary turnout hit 30.3%. But that spike proved to be a one-time oddity, as in 2012 the primary voter rate for both parties declined to an all-time low of 15.9%, or nearly half the rate forty years ago.

What makes this even more striking is an accompanying decline in total voter registration. In 1972, 72.3% of Americans eligible to vote were registered. In 2012 that number dropped to 65.1% (in 2014 this declined further to 64.6%) for a 7.9 percentage point difference. The drop in voter registration combined with a drop in primary voter participation of eligible voters has resulted in an overall decline of 54% in primary voter participation from the last generation to the current one. More than half of voters have ceased to engage in the ideological formation of our two parties in any meaningful way, leaving the most die-hard 46% to dominate politics. To put that in perspective, let us hypothesize that 7 out of 10 Republicans and a similar 7 out of 10 Democrats have moderate, mostly rational views. Now imagine that the most moderate 5 of 10 left each party; this would leave a distribution of 3 fringe voters for every 2 moderates. Even if the center had previously been the supermajority a drastic decline of the sort we have witnessed between 1972 and 2012 could easily explain the sudden extremism of the party. This demographic collapse in primary voters may explain the rise of extremism far better than the supposition that the majority of people on the right and left have substantially changed their ideologies and adopted extremist positions.

Any serious conversation on the polarization of American politics cannot ignore the drop in primary voters, though up to this point it mostly has. While the general elections decide whether conservatism or liberalism are dominant at the time, the primaries decide what conservatism and liberalism are. In 1972 when twice as many Republicans participated in the primaries, some of the main points in their platform were nuclear arms reduction, increased government protection for the environment, a 7% tax increase on those making $100,000 or more, and the increase of “trade and cultural exchanges as ways of improving understanding between [the U.S. and China].” In 1972 the DNC supported the Drug War and efforts to maximize coal efficiency. These policies would be unthinkable to GOP and DNC primary voters forty years later. This may have more to do with the fact that the most moderate 60% of voters have disappeared from the political landscape, rather than a change in ideology from the majority of voters.

What effect does the disappearance of the center have on the structure of American politics? To understand this it is necessary to first outline the general election process. Of the 322 million American citizens only 208,012,000 (64.6%) are registered to vote. 32% of Americans identify as Democrats while 23% identify as Republicans or 67 million and 48 million respectively, with the rest identifying as Independent or belonging to third parties. In 2012, Mitt Romney was only able to win 10 million votes out of 19 million primary votes cast on his way to the nomination. Considering that the Republican Party has 48 million members, hardly a third of Republicans showed up to the polls, perhaps fewer due to Independents voting in the twenty-seven open primaries. The Democratic Party appears to have even lower turnout than the Republicans based on the 2004 race, but even if the Democrats exhibit similar voting patterns, one can expect less than 27 million to vote, in a party comprised of 67 million people.

Furthermore, one only needs around 50% of the primary vote to win the nomination, and the last two primary competitions were near that figure (53% for Romney 2012, 47% for Obama in 2008). In order to win the GOP nomination Trump, Cruz, Carson or whoever takes 2016’s trophy will only need to win in the range of 10 million votes, or 3% of the total US population. Meanwhile, in order to win the DNC nomination, Clinton or Sanders will only need to win roughly 14 million votes, or 4% of the total US population, meaning that the ideologies of America’s two ruling political parties are decided by a mere 7% of the total population. To put this in perspective, in 1972, 22.3% of Americans who were eligible to vote participated in the formation of their party’s ideology.

Chomsky and Wehner are not necessarily wrong. Perhaps the GOP has become too dependent on rich donors to connect with the average voter, while the Democrats have moved too far to the left for many who constituted Bill Clinton’s former base. But what is clear is that forty years ago nearly a quarter of eligible Americans voted in the primaries, playing a direct hand in the formation of their party’s ideology, while today that number is closer to one in ten. While the near-universal consensus among pundits and political theorists is that politics has become too polarizing, this extremism has emerged not from fanaticized voters, but from an apathetic middle that has almost completely disappeared from the political landscape. The absence of moderate voters has only had a multiplying effect, as extremist candidates drive out even more centrists from the voting pool.

Gary Girod is currently pursuing a Ph.D in modern Western European labor history at the University of Houston, and graduate of Chapman University.

Suicide: The New Curse for Boomers?

$
0
0

We often associate suicide with the crises of youth, or the despair of the old. Yet the group that is now experiencing the biggest surge in suicide is in the Baby Boomer Generation; from about 14 percent in the year 2000 to about 19 percent in 2013. Baby boomers rose to 37.5% of all suicides in 2010. That is now the highest suicide rate of any existing age bracket (shown in figure 1). In order to find a way to reduce this percentage, one must understand why this is happening in the first place.  

Before tackling the issue of suicide, it is important to understand what it means to be a baby boomer. Baby boomers were those born in the United States between the years 1945 and 1964. Total births per year during that period “grew from 2.3 million to 4.3 million and then fell to 3.2 million.”  This surge in births was largely due to the rapid expansion of the job market created by World War II. The subsequent financial comfort produced an overall positive attitude towards childbearing, causing what is known as the baby boom. These baby boomers would live to see a time where women were joining the work force in large numbers, automobiles were becoming popular, and the U.S. was in a war with Vietnam.

So why would people born in such an exciting time be committing more suicide today? A study done by Katherine A. Hempstead and Julie A. Phillips tries to decipher whether this sharp increase in Boomer suicide rate is due to personal (e.g. mental and physical health), interpersonal (e.g. divorce), or external circumstances (e.g. economic and political). The data for this study was collected from the National Violent Death Reporting System (NVDRS) and from the CDC. In 2010, suicides from personal circumstances decreased to 79.8%, interpersonal circumstances decreased to 40.4%, and external circumstances increased to 37.5% issue lies in the 4.6% increase in suicides due to external circumstances. This pattern suggests that the large increase in suicides among this generation due to changes in their external circumstances.  


Figure 1: Suicide rates of different age brackets from 2000 to 2013 (afsp)

Most reports of suicide due to external circumstances were related to job, financial, or legal distress. A possible explanation of this reporting is the correlation between these suicides and the effects of the Great Recession. The Great Recession, triggered by the bursting of the 8 trillion dollar housing bubble in 2007, caused the U.S. labor market to lose 8.4 million jobs and reduce wages all across the board.

Although every demographic was hit by the Great Recession, the baby boomer generation was hit the hardest in terms of lost property value, household finances, and lost retirement savings. As one researcher discovered, “27 percent of those aged 50 to 64 experienced reduction in salaries. This was higher than any other age group”   

This downward trajectory was more difficult for baby boomers to deal with for three known reasons. The first is that Boomers were born at a time of economic optimism, so they tend to have had high expectations for their financial futures. Seeing the wealth that they spent their lives accumulating dwindle away because of an economic downturn may have been a large blow to their prides/egos.

The second reason is the feelings of losing power that many baby boomers must be going through. The daily spending of boomers decreased from 114 million in 2008 to 55 million in 2009. Even with the recent 15 million dollar spike, boomer daily spending was still down to 105 million per day as of December, 2015. (Fleming).

The third reason is the current age that baby boomers are currently living through. When hitting the age brackets of 50’s and 60’s, people usually begin considering what they will do to afford retirement. Entering a time of financial instability makes these considerations problematical, especially for those in the middle and lower classes. A study done in 2007 called Money Across Generations shows “51% of boomers reporting being ‘very confident’ of their ability to assure a ‘financially secure life’ for themselves and their children. By 2011, that number had fallen to 33%.”   The combination of financial fear as well as possible mid-life crises makes possible suicide completely understandable.

Fortunately for the baby boomer generation, the economy is slowly growing back to a relatively normal state. At about 2.2 percent GDP growth per year since 2009, America’s financial future seems optimistic. The hope is that this will be enough to reduce the suicide rate of baby boomers.

That outcome seems doubtful, however. In fact, suicide rates of baby boomers are expected to go up in the coming years. Figure two shows suicide rates of different age groups in the years 1999 and 2007. Until recently, suicide rates among those in their 40s and 50s seemed to level out or even decrease. The common explanation for this is the level of contentment some often feel in their middle ages. They are less likely to commit suicide because they are often focused on their careers, their children, and even sometimes their grandchildren. Many of the stresses of youth are gone yet they still have the vitality necessary to chase after the things they want. On top of that, they often have a much healthier diet than other age groups, so their risk for chemical depression is much lower.

This makes the current upsurge in boomer suicides all the more distressing.   At a time when traditionally suicide rates are low, those of boomers are now actually higher than those of any other generation. That includes the 15 to 24, 25 to 44, and the 85 (asfp) and older demographics, all of which traditionally suffer higher suicide rates.   

Baby boomers are headed into a new stage of their lives, which is usually called the golden years. That name is very misleading however, as suicide rates among the elderly are consistently higher than those of other ages. This is because many elderly people live with undiagnosed cases of depression, which are often worsened by the loss of a spouse or the stress of living with a chronic illness. They also tend to lack adequate social interaction, which is important in fighting the loneliness that often exacerbates depression. Lastly, they are much more likely to carefully plan out suicide attempts. That, combined with their more fragile bodies, makes their suicide attempts much more likely to be successful  


Figure 2: Suicide Rates Among Ages, 1999 and 2007 (afsp)

One theory suggests that depression is not decreasing because men are not getting the emotional help that they so desperately need. Figure 3 shows the separated suicide rates of males and females between 1981 and 2013, inclusive (afsp). In that window, the trend stays relatively the same; males are committing suicide more than twice as much as women. Since women are diagnosed with depression twice as much as men, this disparity is surprising. A study by Lisa A. Martin, Harold W. Neighbors, and Derek M. Griffith explores this disparity and finds that men may be equally depressed, but they seem less equipped to handle it.


Figure 3: Suicide Rates by Sex from 1981 to 2013 (Milburn)

Some of this comes from today’s social conditions in which boys have been told that they are not supposed to express sadness, as it can be deemed a “unmasculine.” As a result, they feel less willing to see counselors or get help in dealing with their emotional issues. Instead, they turn to other means of consolation such as bouts of anger or substance abuse. That is why they are less often diagnosed with depression.

One surprising finding is that suicide among boomers is not only a largely male phenomenon, but also largely a white one. Figure 4 shows the suicide rates between 1990 and 2010 by race/ethnicity. According to the data, White people have the highest suicide rate of any ethnicity, followed closely by Native Americans. All minorities, other than Native Americans, have a much lower suicide rate. This trend seems counterintuitive since white people are known to have less financial instability. A theory suggests that white people are less used to adversity, which makes it difficult for them to deal with the difficulties of everyday life. They also may have an unrealistic view of how easy life will be as they grow up, making them more often disappointed with the end result. Other ethnicities may also have a more positive outlook or have stricter religious/moral beliefs on suicide.


Figure 4: Suicide Rates by Race/Ethnicity from 1990 to 2010 (afsp)

Though there have been a lot of generalizations throughout this paper, it is important to note that every individual is unique. Although race, gender, generation and other demographics may tell a lot about a person, there is also much more that can only be found by getting to know a person individually. Helping baby boomers to be happier and commit less suicide is going to take personal care and compassion instead of a single standard approach.  An improved economy may help as well in preventing a tsunami of boomer depression and suicide in the years ahead.

Tyler Hishmeh is a senior business student at Chapman University. When not at school he’s usually training in Muay Thai or hitting balls at the golf range.

Best and Worst: 2015 International Housing Affordability

$
0
0

Housing affordability and its impact on   middle income households around the world is emerging as a major concern throughout the developed world. The largest element in household budgets is housing, and house prices have skyrocketed relative to incomes in many metropolitan areas, especially those that have adopted strict land use regulation (particularly urban containment, as described below).

The 12th Annual Demographia International Housing Affordability Survey reports that, as of the third quarter of 2015, Hong Kong has the least affordable housing among major markets in 9 nations, followed by Sydney, Vancouver, with Auckland, Melbourne, San Jose, San Francisco, London, Los Angeles and San Diego. In each of these markets, housing costs are now triple or more their  levels before restrictive land use regulation (house prices have tripled compared to incomes).

Ranking Similarities: Demographia and the UBS Real Estate Bubble Index

The Demographia list of least affordable metropolitan areas is largely echoed by UBS, the international financial services company headquartered in Switzerland. The UBS Global Real Estate Bubble Index ranks London, Hong Kong, Sydney and Vancouver as most vulnerable to risk from a real estate bubble. Demographia rates Hong Kong, Sydney and Vancouver as having the least affordable housing. London is ranked 8th in the Demographia Survey. Overall, the five cities rated by UBS as the most vulnerable are included among the eight least affordable in the Demographia Survey. The three other cities ranked in the least affordable eight by Demographia are not considered in the UBS report.

Background on Middle-Income Housing Affordability

In his introduction to the Survey, Senator Bob Day (Australian federal Senate) recalls that: “For more than 100 years the average Australian family was able to buy its first home on one wage. The median house price was around three times the median income allowing young home buyers easy entry into the housing market.”

Senator Day’s description of the experience in Australia tracks with that of other nations. Following World War II and until the early 1970s, virtually all metropolitan areas in Australia, Canada, Ireland, New Zealand, the United Kingdom and the United States had median multiples around 3.0 or below.

Since then far more restrictive land use policies have spread beyond the metropolitan areas to many others in other nations. This has often included urban containment policies (called “urban consolidation in Australia”), which severely limit or even prohibit new housing construction on or beyond the urban fringe. The result, as basic economics predicts, is higher land prices and skyrocketing housing costs, (despite expectations to the contrary by planners).

Rating Housing Affordability

The Demographia International Housing Affordability Survey uses the "median multiple" price-to-income ratio. The median multiple is calculated by dividing the median house price by the median household income.  Housing affordability ratings are indicated in Table 1.

Virtually all of the severely unaffordable major markets in this year’s Survey exercise urban containment policy. Meanwhile, no market without strong land use regulation has ever been rated as severely unaffordable in the 12 years of the Survey.

The Bottom 10: Least Affordable Major Metropolitan Markets

The kinds of restrictions on development that Senator Day outlines are evident in the most unaffordable metropolitan areas.

For the fifth straight year, Hong Kong had the least affordable housing.  Its median multiple was 19.0. Sydney became the second least affordable, at 12.2, leaping by 3.2 points, the largest annual increase ever recorded among major markets in the Survey. Sydney displaced Vancouver, which had the third least affordable housing among the major markets, with a median multiple of 10.8. This is up from 10.6 last year. Each of these is the highest median multiple recorded in these markets in the history of the Survey.

Three metropolitan markets tied in fourth position with a median multiple of 9.7, San Jose, Melbourne and Auckland. San Francisco was the 7th least affordable market, with a median multiple of 9.4, followed by London (8.5). San Diego and Los Angeles, which both had a median multiple of 8.1 (Figure 1).

Urban containment markets clearly and nearly perennially suffer declines in housing affordability. In 2013, the same ten metropolitan markets were the least affordable and had an average median multiple of 9.1. By 2015, their average median multiple had risen to 10.5. Housing affordability deteriorated in all 10 markets (house prices rose faster than incomes). This loss in housing affordability was at least 14 times the loss in the 10 most affordable markets (below).

The Top 10: Most Affordable Major Metropolitan Markets

Again, the United States, with its multiple regulatory variations accounted for all of the top 10 in housing affordability (actually the top 12, because of a four way tie for ninth position). Buffalo, Cincinnati, Cleveland and Rochester had the most affordable housing, with a median multiple of 2.6. Pittsburgh ranked 5th, at 2.7. Detroit, Grand Rapids and St. Louis tied for 6th, at 2.8. The tenth place tie was between Columbus, Indianapolis, Oklahoma City and Kansas City, with a median multiple of 2.9.

By contrast, the top ten markets experienced relatively little deterioration in housing affordability over the past two years. In 2013, their median multiple averaged 2.6, and rose to 2.7 in 2015 (Figure 1). The housing affordability deterioration in the bottom 10 markets (all urban containment markets) was 14 times as high, as noted above.

Among the five megacities (over 10 million population) in the Survey, Osaka-Kobe-Kyoto had the best housing affordability, with a moderately unaffordable median multiple of 3.4.

All Markets

Overall, the Survey included 368 markets. The most favorable housing affordability was in Ireland, with a median multiple among the markets of 2.8. This was the third year in a row that Ireland had the best housing affordability. In the nine prior years of the Survey, the most affordable housing had always been in either Canada or the United States (Figure 2).

The United States was the second most affordable in 2015, with a median multiple of 3.5. Canada and Japan tied for third, with median multiples of 3.9. Four geographies with virtually universal urban containment policy were the least affordable, the United Kingdom (5.1), New Zealand (5.2), Australia (5.6) and Hong Kong (19.0).

Singapore, though seriously unaffordable at 5.0, is far more affordable than its long-time rival,  Hong Kong (19.0). Each has virtually no suburban or rural hinterland and high population density. Yet there is a serious difference in housing policy. In contrast to Hong Kong, Singapore’s e Housing and Development Board, which accounts for approximately 90 percent of housing (which after sale is privately owned) has increased production and reduced new house prices which has led to a lowering of resale house prices as well.

A Wholly Contrived Crisis

Senator Day characterizes the housing affordability crisis “wholly contrived,” and “a matter of political choice… the product of restrictions imposed through planning regulation and zoning.” Senator Day calls the economic consequences of present land use policies “devastating.” He argues that governments and central banks have been too hasty to blame unprecedented housing affordability losses on demand factors, while missing the “real culprit,” which is the “refusal of … governments … to provide an adequate and affordable supply of land for new housing stock to meet demand (typically urban containment policy).

Without reform, prospects for middle income households are grim in the metropolitan areas with urban containment policy. Housing affordability can be expected to deteriorate more, with dire economic and social consequences. According to London School of Economics and Political Science economists Paul C. Cheshire, Max Nathan and Henry G. Overman (see: People Rather than Places, Ends Rather than Means: LSE Economists on Urban Containment).

"The problem is it is utterly unviable in the long term. With every passing decade the problems would get worse, the wider economic costs would become more penalising, the economy and monetary policy more unmanageable and the outcomes – the divide between the property haves and the property have-nots – more unacceptable."

Wendell Cox is Chair, Housing Affordability and Municipal Policy for the Frontier Centre for Public Policy (Canada), is a Senior Fellow of the Center for Opportunity Urbanism (US), a member of the Board of Advisors of the Center for Demographics and Policy at Chapman University (California) and principal of Demographia, an international public policy and demographics firm. He is co-author of the "Demographia International Housing Affordability Survey" and author of "Demographia World Urban Areas" and "War on the Dream: How Anti-Sprawl Policy Threatens the Quality of Life." He was appointed to three terms on the Los Angeles County Transportation Commission, where he served with the leading city and county leadership as the only non-elected member. He served as a visiting professor at the Conservatoire National des Arts et Metiers, a national university in Paris.

Photo: Sign advertising new house and land packages starting in the $170,000s. Suburban St. Louis, third quarter 2015 (photo by author).


Cleveland Renaissance Fair

$
0
0

So much talk of the Cleveland comeback with our downtown building boom and Republican National Convention-fueled makeover makes it difficult not to think about our mid-1990s civic renaissance. In 1995, The New York Times headline proclaimed " 'Mistake by the Lake' Wakes Up, Roaring" as downtown's stadiums and lakefront development created a "new face and new style of a city that for a long time had little panache."

But it wasn't just the media who became enchanted with our freshly minted charms — even the scholars were feeling it. The academics, however, had a Lake Erie-sized caveat. There was a divide in the region's comeback, noted the authors of the 1997 study "The Rise and Fall and Rise of Cleveland," with areas separated by characteristics of "capital investment and disinvestment, industrialization and deindustrialization, suburbanization and ghettoization, white flight and a black underclass, the growth of services, and a [high-skill and low-skill] dual economy."

Prophetic then, those words serve as a warning now. The paradox of Cleveland's comeback, if not an urban American comeback, is that the more a city returns, the greater the number who get left behind.

Rob English splits his time between Baltimore and Cleveland. He has been doing so for nearly three years.

A former Army infantryman, he serves as supervising organizer for the Greater Cleveland Congregations, a network of local faith and community-based organizations working for social justice. His experience in Baltimore since 1997 gives him a different perspective on his work in Cleveland today. "You have to meet people where they're at, listen to them, and find ways to act in their mutual interest," he says.

English marched with the Cleveland group in late May after the Michael Brelo trial verdict to demand comprehensive criminal justice reform. As the demonstrators from about 40 religious congregations walked arm-in-arm along downtown streets to City Hall and the Justice Center, it was peaceful — unlike what happened in Baltimore a month earlier. There, the death of 25-year-old Freddie Gray in police custody prompted violent social unrest.

"Baltimore is about seven to 10 years ahead of Cleveland," says English.

Odd as it sounds, what English means is that Baltimore's economic resurgence has been longer in the making — and that may be a good thing for Cleveland.

Baltimore's signature project, the cleanup and rehabilitation of Baltimore's Inner Harbor with its world-class aquarium and science center, began in the 1980s. Oriole Park at Camden Yards, an architectural model for Progressive Field, opened in 1992.

With the beautification came a change in the city's demographics. Today, nearly 27 percent of Baltimore residents have college degrees, compared to 16 percent in Cleveland. Baltimore's median income ($41,385) is $15,000 higher than here. Cleveland's poverty rate sits at 35 percent, 12 percentage points more than Baltimore.

But the benefits in Charm City are not evenly distributed. White city residents earn nearly double that of black city residents. Baltimore also had the ninth worst wage disparity between high- and low-income workers in the nation, according to the Martin Prosperity Institute. So, while the physical redevelopment is apparent in the eyes of all Baltimoreans, the effect is uneven in their temperaments.

English, 46, recalls a talk he had with an African-American woman from East Baltimore several years back. She could see the Inner Harbor off in the distance from her neighborhood.

"Let me tell you about my anger," she told him. "Every morning when I wake up and take the kids to the bus stop, every morning I look down and see the harbor, and every morning I get angrier."

Her experience is more than an isolated one, says English. In Baltimore, people saw aspects of the city improve year after year. Yet so many weren't a part of it. Eventually tensions built, and the Freddie Gray incident ignited it.

"Now, Cleveland is beginning a renaissance," English says. "But there is room to come together so you're not two cities."

--------

Thomas P.M. Barnett's book The Pentagon's New Map is more than a decade old. But its message is no less relevant.

"Disconnectedness defines danger," he argues.

For the expert geostrategist, the world is split between two types of geographies: the Core, where "globalization is thick with network connectivity, financial transactions, liberal media flows, and collective security," and the Gap, or areas disconnected from globalization and defined by poverty, low education rates and "the chronic conflicts that incubate the next generation" of instability.

"We ignore the Gap's existence at our own peril," concludes Barnett.

It is a useful model in understanding what's occurring in Northeast Ohio.

Consider that, according to a Brookings Institution study, Cleveland and Seattle led the nation with the biggest percentage increases in high-income households from 2012 to 2013. Yet, research from Rutgers University revealed Cleveland also has one of the largest increases in neighborhoods with concentrated poverty since 2000.

This division is further evident when mapping the concentration of Northeast Ohio residents with college degrees. Higher educated areas are centered in downtown, Ohio City, Tremont, Detroit Shoreway and AsiaTown, which have each seen double-digit percentage increases in residents with college degrees since 2000, as well as along the lakeshore, near University Circle and in various suburban and exurban clusters. Meanwhile less educated areas are grouped in the city of Cleveland outside the urban core and in the rural exurbs.

Simply, areas of Cleveland that are revitalizing are part of the globalizing Core. The isolate neighborhoods, or those experiencing higher levels of violence and poverty, comprise the Gap.

In fact, for a number of quality of life indicators, outcomes in various East Side neighborhoods are below that of developing nations. A recent PolitiFact article showed that infant mortality rates were worse in select East Cleveland neighborhoods than in North Korea, Uzbekistan, Zimbabwe and the Gaza Strip.

According to data by Case Western Reserve University, homicide rates for sections of the city are similarly comparable. In 2010, homicide rates in Ward 1, comprising parts of the southeast side, and Ward 9, which entails Glenville, are similar to Guatemala and El Salvador.

What's happening here is not unlike cities such as Chicago, Baltimore, Miami and Brooklyn, New York, where the spatial patterns of having and not having mean poverty gets pushed together, not alleviated. When cities evolve as separate and unequal, they create a deepening sense of alienation and marginalization.

"The economic and social frustration could be expressed in more recourse to violence," says Mark Joseph, director of the National Initiative on Mixed-Income Communities at Case Western Reserve University.

Revitalizing neighborhoods have more "eyes on the street," says Joseph, who examined the effect in the Second City while at the University of Chicago. And more vigilant policing can "push gangs into more constrained areas of the city and into more conflict with each other."

In the first nine months of 2015, for example, there was a 40 percent increase in gun homicides compared to 2014.

"As we are seeing in our city, innocent bystanders suffer the consequences as well as those directly targeted," Joseph says.

In a span of a month, a 5-year-old, a 3-year-old and a 5-month-old were all victims of drive by shootings from gang violence that has boiled over in various East Side neighborhoods.

After the youngest, Aavielle Wakefield, was killed, Cleveland police chief Calvin Williams stood at the crime scene on East 143rd Street in Cleveland's Mount Pleasant neighborhood. It was night. The street was lit by the television crews. With Mayor Frank Jackson by his side, the chief demurred about the senseless tit for tat, the need to catch the perpetrators.

Suddenly, his face went from firm to fragile. "To the family ... it's tough ... it's tough," he said in tears. "This should not be happening to our city. And we got to do something about it."

--------

"I have looked into the eyes of children soldiers overseas," says English, who served a platoon leader stationed in Somalia. "I see the same look in Cleveland and Baltimore. That is what decades of disinvestment has created in our urban areas. It's got to stop."

Click to Enlarge

English was in Baltimore in April when the riots erupted about 20 miles away from the harbor. The city was on needles. English and a few co-workers received alerts about young people near Mondawmin Mall turning violent.

The message was to go where the rioting was occurring, with the intent to stem the unrest.

When English arrived, a CVS was being looted and burned. As a community organizer, English attempted to do what organizers do: connect to the disconnected. But he wasn't succeeding.

"I looked at the young people in the eyes," he recalls. "I lost my soul. I couldn't connect with them."

Anthony Body, a 29-year-old Glenville resident and member of the Cleveland Community Police Commission, sees similarities here.

"There is a sense of hopelessness," he says.

Isolation fuels the cycle of disenfranchisement. Without exposure to positive outcomes, there can only be so much progress. Body says due to the lack of role models in his neighborhood people were influenced by the lifestyle of rappers, drug dealers and the garbage man.

"There is nothing wrong with being a garbage man," he says. "But in order to choose Option B, you had to be exposed to Option B."

The realities of his neighborhood have taken a personal toll. Body has lost at least one family member or friend to violence every year since 2006.

"All the trauma. The trauma of no job, the trauma of violence — the lack of family or social support — the schools," he says, "it all drags on you when you try to better your life, so that when difficulty hits, you just go back to what you know."

No doubt, the persistence of violence is not just a Cleveland problem, but a national one. Homicides are up sharply in Washington, D.C., Milwaukee, St. Louis and Baltimore.

On a mid-October trip to Ohio, FBI director James B. Comey wondered aloud: After years of declining violent crime in cities, why the uptick? "I'm not here announcing any big initiative or program," Comey said, "but we have a lot of smart people who we brought on board after 9/11 who may be able to help look at the issue differently."

Cheap heroin from Mexico and the turf battles to supply what has become a nationwide heroin epidemic was one likely scenario, he offered.

"What we're in the midst of is a drug war," says Hough resident and writer Mansfield Frazier, who likens today's violence to the St. Valentine's Day Massacre that left seven men dead in Prohibition-era Chicago.

For Khrystalynn Shefton, a housing development manager at the Famicos Foundation — a community development corporation in Glenville and Hough — this drug war is not just an urban problem, but an everyone problem. It's limiting the potential for struggling neighborhoods to appreciate.

Shefton tells the story of a friend who lives off Rockefeller Park in a beautifully renovated home in Glenville. On a recent Sunday, she was enjoying tea in her sunroom. "A guy pulls up, straps up and does heroin in front of her house," Shefton says. When he was done, the man left down Martin Luther King Jr. Boulevard to head toward Interstate 90 and back to the suburbs.

"The pain for me in this renaissance is that as a city we have not figured out that 'I am my brother's keeper,' " she says. "It's all connected — the ills in the suburbs and the city."

The roots of urban violence run deeper than the existence of a drug war. In September, the Cincinnati Enquirer investigated the Queen City's rise in gun violence. What Cincinnati was witnessing ran counter to conventional wisdom that crime goes up in bad economic times and down in good times, offered Mayor John Cranley.

"This is the best economy we've had since the Great Recession and yet crime is up," Cranley explained. "So it's more likely to be linked to social and cultural than economic reasons."

Of course, one could argue that the violence is linked to social and cultural issues stemming from economic reasons. Simply, the economy has changed rapidly since so many worked in the plants. Good economic times have been divorced from so many people, if not a generation of so many people.

The Georgetown Public Policy Institute found that four out of the five jobs lost since the Great Recession required a high school degree or less. "The shift in the workforce from less-educated to more-educated has been a slow and steady process," notes the authors.

In the early 20th century, Cleveland was a magnet for European immigrants, Puerto Ricans and African-Americans because industry needed labor to produce economic growth. Manufacturing built our middle class. It enabled people to move up.

In 1990, for example, more than 50 percent of Cuyahoga County's African-American residents lived in heavily segregated East Side city neighborhoods, while today that number is down to 30 percent.

That said, large-scale launchpad industries for formerly blue-collar communities are now nonexistent. Cleveland lost its old magnetism. But the children and grandchildren of the city's factory-floored forefathers remain.

And they are idle. Thirty-eight percent of Cleveland's males are not in the labor force. In black majority neighborhoods such as Union Miles, Central and Glenville, those numbers approach 50 percent.

When English first began canvassing Rust Belt cities, the Texas native was amazed at the number of black men standing on the corners. In Baltimore, he got to know many of them.

"We have always been on the corners," English recalls one of them telling him. "The difference then is that we had lunch pails, and we were waiting for a ride to the steel mills."

While English has been making that point for years, corporate and civic leadership in Baltimore are just now coming around to it, he says. "The unrest in Baltimore and the day-to-day violence in Cleveland — it's a jobs issue."

Body, a good neighbor ambassador supervisor with the Northeast Ohio Sewer District, echoes the sentiment. "People where I live just want opportunity," he says. "They want to work. Every generation up to recently had [opportunities to work] handed down, somewhere in between it stopped being handed down."

Body, who earned a business degree from Malone University while on a football scholarship, considers himself blessed. His parents and higher education taught him critical-thinking skills. He became better prepared for today's economy. He found his place — and Glenville is a part of it.

"I'm still playing the dozens and breaking bread with my community," he says. "I'm trying to express to folks there is another way."

But too many of them can't see it, he says. "The feeling in most folks is disappointment for not being able to join with it."

--------

There is an understanding in geopolitics that everything local is global. What you see happening on the corner is tied together, whether that's a vacant house and a skeletal factory or a condo development and state-of-the-art medical research facility.

It is correlated to Cleveland's relationship with and relevance in the world. One set of aesthetics are birthed by severing from our economic past, and the other birthed from ties to our economic future.

In between these aesthetics are people.

Yes, a younger, more educated generation has found aspiration in Cleveland's core. Yet to think Cleveland can come back by deepening the pattern of isolation versus prosperity is to ignore a basic tenant of modernization: With evolution comes progress — not just economically, but humanly.

Cleveland's rebirth is in its infancy. The city is still alive in the shadows of all it has lost, making it possible for a consciousness to be reborn right.

Part of this entails learning from the lessons of Baltimore. There, like in Cleveland, the city's economic transformation is largely spearheaded by the education and medical sectors centered around Johns Hopkins University and Johns Hopkins Hospital in East Baltimore.

Recently, in the face of Baltimore's social unrest, the two institutions joined in an initiative called HopkinsLocal. The point is simple: Tackle social and health issues in Baltimore by engaging the city's poorest residents and preparing the unprepared. By 2018, they plan to fill 40 percent of targeted positions by hiring from within the city's most distressed communities. In all, it is one of the more robust buy local anchor institution policies in the nation.

Locally, programs to do something similar with anchor institutions have been developed, particularly the Evergreen Cooperatives. The worker-owned co-ops based in Cleveland's East Side are contracted out to sell local goods and services to global institutions such as the Cleveland Clinic. While innovative, the efforts need scaling. Discussions are happening in Cleveland to do just that.

For English, the urgency couldn't have come too soon.

"It's a generational moment," he says. "In the future, people will look back to now and ask, 'How did we respond?' "

This piece first appeared in Cleveland Magazine.

Richey Piiparinen is a Senior Research Associate who leads the Center for Population Dynamics at the Levin College of Urban Affairs at Cleveland State University. His work focuses on regional economic development and urban revitalization.

Live from Honolulu: HART Rail, a Megaproject Failure in the Making

$
0
0

Typically very few people pay attention to the goings on in the small state of Hawaii. How bad can possibly things get there? Well, a lot of people recall Boston’s Big Dig, the nation’s largest infrastructure fiasco with a final price tag of about $15 billion. What if I tell you that tiny Honolulu is building a rail system that’s expected to cost at least one-half the cost of the Big Dig? On a per-capita basis it would be the nation’s largest infrastructure fiasco by far.

Honolulu rail, managed by Honolulu Area Rapid Transit (HART), is a 1970s style 20 mile, all-elevated heavy-rail guideway with third rail power delivery and light rail-sized cars limited to about 650 passengers per two-car combination; it has an ability to run only up to four cars for peak period service. It is the worst design possible because it combines an intrusive and expensive infrastructure including 21 elevated stations, and a low passenger carrying capacity with over 60% of it as standing passengers.

Despite the preponderance of evidence that Honolulu’s rail will do little to mitigate the severe congestion on the island of Oahu, the project did garner marginal (50.6%) public support on a 2008 referendum. Despite a couple major lawsuits, it completed the Federal Full Funding Grant Agreement process in 2012.  Local political preference (e.g., why build a $1 Billion taxpayer project when you can get away with a $5 Billion project? … also known as “the gravy train”) stands among the major causes of this megaproject failure in progress.

What’s a megaproject failure? An infrastructure project that exhibits at least two out of three bad outcomes: 1) Large cost overruns, 2) Long project delivery delays, and 3) Much lower usage than forecast.  Well known megaproject failures include the Chunnel Tunnel/Eurotunnel that suffered all three failures, and Boston’s Big Dig that suffered failures 1 and 2 in a big way. Tren Urbano in San Juan, Puerto Rico is a peer project that HART rail will likely match in failure-to-meet-targets. Tren Urbano’s actual construction cost was 80% over the planned estimate, and its ridership has been only one quarter of what was projected! HART rail and Tren Urbano were planned by the same consultant (PB) and had the same oversight (FTA.)

At the end of 2015, five miles of the HART guideway, and the rail yard appear to be substantially complete. HART, the voter approved “independent authority” that runs the project with many of its budget strings controlled by the city council, claimed a 25% project completion in December 2015, although 15% is a more realistic estimate based on what has been physically constructed so far. Several segments and columns have suffered large cracks, concrete delamination and segment misalignment [1], and safety lapses were alleged at the Ansaldo rail yard [2]. In less than two years, the guideway construction company (Kiewit) submitted 40 work change orders and recently demanded a $20 million price adjustment. But this is nothing compared to the total escalation of cost figures.

First, let’s review some highlights of the project’s development between 2004 and 2015.

  • 2004: Newly elected mayor Hannemann asserts that 34 miles of rail will cost $2.7 Billion.
  • Mid-2006: Hannemann switches to the Minimum Operating Segment: 20 miles will cost about $3 B.
  • Late-2006: Alternatives Analysis sets the cost at $4.6 B (this figure and all figures below include FTA-mandated contingency funds).
  • Spring 2008: Hawaii legislature approves a 0.5% tack-on to Hawaii’s GET tax that applies to every transaction. Against expectations, Republican Governor Linda Lingle opted to save her political career and let the tax stand without a veto. The rail tax is expected to generate about $2 B. The gravy train has thus been established.
  • Summer 2008: Mayor Hannemann up for reelection gives a helicopter ride to Senator Oberstar who then says that the Feds will give Honolulu $900 M. Hannemann declares that “the train has left the station.”
  • 2009: President pro tempore Senator Inouye of Hawaii joins the rail party. FTA is strong-armed to pay $1.55 B.
  • 2010: The cost is up to $5.4 Billion not counting the error of locating an insufficient distance from an airport runway. A $150 M realignment is necessary to reroute the guideway one block over.
  • 2010: Outgoing Governor Linda Lingle releases an independent financial analysis of the project by IMG and Thomas Rubin which concluded that construction cost will likely be more than the $5.4 B projection, ridership projections were both very high and would require passenger loads significantly higher than that of any U.S. transit operator, future rail renewal and replacement costs were ignored, operating subsidies were significantly understated, and many projected revenues were significantly overstated.  Mayor Carlisle dismissed the report as “a product of rail opponents.”
  • 2011: Mayor Carlisle performs a “ceremonial groundbreaking” but only utility relocation occurs afterwards. The project still aims for a 2019 completion.
  • 2012: Both a National Environmental Policy Act (NEPA) and a Hawaiian burial ground desecration lawsuit are filed, the former in federal court the latter in state court. Only the second lawsuit causes minor construction restrictions in areas where archeological surveys had not been done.
  • 2012: Construction accelerates at the casting yard and the first piers appear in the middle of prime agricultural land. The first four miles of the project are on agricultural land. Carlisle loses in the primary. Two Democrats, Kirk Caldwell (pro rail) wins the mayor race over past governor Ben Cayetano (anti rail.) Although some frame it as another victory for the rail project, Cayetano’s battles with unions during his eight years in the governor’s office were a major cause of his loss.
  • Mid-2014: 9th Circuit court appeal ends unsuccessfully for the plaintiffs of a NEPA-based suit.
  • December 2014: HART reveals a $910 projected deficit and asks for more tax monies.
  • December 2015: HART proposes to open 10 miles of service in 2018.

One of the flaws in megaproject development is strategic misrepresentation, or cleverly worded lying to the public and decision makers such as the HART board members and the Honolulu city council members, none of whom have any expertise in large infrastructure projects and rail in particular. Project advocates such as the FTA turned a blind eye to facts and in 2009 they presented to the people of Hawaii Figure 1, a gem of strategic misrepresentation [4] which simply fit the political line that the proposed 20-mile rail will cost $4.6 billion as applicable during the 2008 rail referendum.  Notice that the FTA cost development in Figure 1, line labeled MEAN, goes against decades of real world evidence of a project’s cost escalation as it moves from planning to construction (e.g., Dr. Bent Flybjerg’s summaries of infrastructure megaprojects [3]). This FTA-sponsored report contains one point of truth: There is a 10% chance that HART rail will cost about $10 B.


Figure 1. HART expected cost over time.

One would think that only three years into construction, with only about 15% of the project completed and only about half of the project gone to bid, HART would be sitting comfortably on a pile of money generated by a general excise tax surcharge being collected since 2007 (about $140 M per year) plus $1.55 B from the full funding grant agreement. Nothing could be further from the truth. In late 2014 HART announced a $910 M expected shortfall and successfully lobbied the Hawaii legislature to extend the 0.5% surcharge from end of 2022 to end of 2027.

In another move of strategic misrepresentation, rail planners pretended that the rail is like an electric car, e.g., one buys an EV, then goes homes and plugs it in. Likewise, HART builds rail, which plugs into the city grid for free.  However, rail’s 30 MW to 50 MW power draw is a major requirement. The utility’s reaction was unpleasant for HART [5] which is now negotiating another expensive arrangement. The combined cost of substations, power generation and the (still in limbo) airport utility relocation tasks are likely to cost about $500 M bringing the known total to approximately $7 B with none of the 21 stations constructed nor the second half of the project gone to bid.

HART rail’s cost development is plotted in Figure 2. The second half of the project includes the challenging construction through urban Honolulu which is one of the densest US cities. There are now peripheral discussions to terminate the project at a large transit bus and handicapped van terminal at Middle Street, which is approximately at the 16th mile of the rail route. This is a welcome possibility because Honolulu will be spared of the heavy construction and debilitating lane and road closures at its downtown and near Waikiki which will be deleterious to general economic activity and tourism.


Figure 2. Actual and expected cost plot.

As the project cost creeps above $7 B (for a city of just one million people), with an expected payoff of about 1% in congestion reduction [6], and the dramatic re-arrangement of TheBus as a feeder to the rail [7], one can begin to outline some of the major consequences such as:

  • Minimal ridership like Tren Urbano in San Juan, PR. Furthermore, San Juan’s average income and auto ownership are much lower to those of Honolulu (i.e., Honolulu has far fewer transit dependent commuters than San Juan.)
  • Destruction of prime agricultural land on Oahu. After years in legal battles, the state Supreme Court approved B.R. Horton’s proposed 12,000 suburban Ho’opili development which includes two rail stations. Although HART makes a big deal out of Transit Oriented Development, Horton’s own EIS reveals that each station will generate the equivalent of only two busloads of passengers for the rail in the peak hour. This approval is proof that development that does not pass traffic congestion standards simply gets … a rail pass.
  • The huge opportunity cost. With $7 B and counting, Honolulu could have actually reduced traffic congestion by more than 25% and reduced its dependency on oil by over 40%. Honolulu burns oil to produce electric power and as a result its electricity cost is 300% above US average. Instead of switching power generation and fleet fueling to natural gas, island policies emphasize oil-generated electric cars and electric trains!

Finally, looking at the bigger picture for Honolulu which includes a $5 B consent decree with the EPA for secondary sewer treatment, increasing dependency on imports, including 90% of food, with prices escalated by the Jones Act requirements, and the nation’s fifth worst unfunded pension liability according to The Economist [8], the future is worrisome: At best Honolulu will experience large increases in taxes and congestion, at worst those plus bankruptcy.  One thing is certain.  This textbook megaproject failure orchestrated by business interests and unions, supported by misguided environmentalism and enabled by enterprising politicians got Honolulu railroaded [9].

Panos D. Prevedouros is Professor and Chair, Department of Civil and Environmental Engineering, University of Hawaii at Manoa.

Photo by super-structure (Jason Coleman), "Honolulu Murals".

REFERENCES AND CLARIFICATIONS

[1] HawaiiNewsNow, Large Cracks Develop along Rail Line, http://www.hawaiinewsnow.com/story/28827333/large-cracks-develop-along-rail-line, 2015.

[2] HawaiiNewsNow, Rail Whistleblower Suit Filed, http://www.hawaiinewsnow.com/story/30203942/exclusive-rail-whistleblower..., 2015.

[3] Bent Flyvbjerg, et al. Delusion and Deception in Large Infrastructure Projects: Two Models for Explaining and Preventing Executive Disaster, California Management Review Vol. 51, No. 2 Winter 2009.

[4] FTA, Project Management Oversight Program, Honolulu High-Capacity Transit Corridor Project, July 2009 (Final)

[5] KHON2, Tension Escalates over Rail’s Power Supply and Who Will Pay for It, http://khon2.com/2015/11/11/tension-escalates-over-rails-power-supply-and-who-will-pay-for-it-2/, 2015.

[6] Past mayors and HART have been eager to misuse the EIS statistic that rail is projected to remove 40,000 cars from the streets.  The actual statistic says that rail may reduce car trips by 40,000. Total car trips on Oahu when rail is completed are projected to be four million.  HART rail may provide a 1% reduction.

[7] TheBus is one of America’s best bus transit systems and has a 6% commuting trip share in Honolulu. Many of its routes will be eliminated or terminated at HART stations. According to the EIS, the subject routes are: B, C, E, 3, 9, 11, 20, 43, 53, 73, 81, 90, 91, 92, 93, 94, 96, 97, 98A, 101, 102, 103, 201 and 202 many of them are popular peak hour express routes.

[8] The Economist, Pensioners Are Pushing Many Cities and States towards Financial Crisis, http://www.economist.com/news/united-states/21582282-pensioners-are-pushing-many-cities-and-states-towards-financial-crisis-who-pays-bill, 2013.

[9] Randy T. Simmons, et al., Bootleggers, Baptists, and Political Entrepreneurs: Key Players in the Rational Game and Morality Play of Regulatory Politics, The Independent Review, v. 15, n. 3, Winter 2011.

The Digitally Connected City

$
0
0

We are witnessing an explosion in digital technology that is reshaping cities… and resulting in a fundamental shift in the way people move and interact within the built environment.

New innovations have always had a profound impact on the evolution of cities, supporting commerce as well as addressing lifestyles. Making sense of the prevailing trajectory requires a new paradigm for city residents, visitors and those who govern.

In recent times, computers and phones have become a must for navigating the vast ecosystem of urban options. New digital technologies support activities such as the ability to use forms of mobility other than cars. From digital apps such as RideScoutApp.com to local amenity rating services like Yelp.com, digital tools abound to guide both local residents and city visitors to where they want to go. These developments provide the backbone of sustainable economic development.

Public and private initiatives are deploying tech solutions to interests and demands. The AT&T Smart Cities Initiative, which is being rolled out in urban centers like Chicago, Atlanta and Dallas, is just one example of a tool for citizens to stay abreast of developments locally and regionally. For example, consumers can receive live updates on their phones if a traffic signal isn’t working. And they can remotely access information on parking meters to reserve a space in advance. In addition, transportation updates in the form of digital signage allow commuters to be advised in real-time of arrival and departure schedules. These digital tools also allow them to rent electric bikes at stations populated throughout these host cities.

The fuel for this movement? Rapid momentum in the deployment of high-speed Internet technology in cities and regions. This is the “juice” that fuels mobile technology adoption and the use of city-based apps, providing consumers with connectivity and the ability to have their data delivered fast. Leading the race in this push is Google Fiber, which is on board to offer warp speed Internet to a growing number of cities across the U.S., including Charlotte, Kansas City, Provo, Raleigh-Durham, Salt Lake City and San Antonio. While the full implications are still a ways off, it promises to serve as a lightening-rod of possibilities for igniting the new digital economy.

Google’s catalytic spark has created a groundswell of public/private interest in boosting the gigabit landscape of cities and regions. A prime example of this is in Longmont, Colorado which has created an experimental laboratory of sorts around what they have coined the GigaBit City. Called NextLight, this venture is a plan to deliver warp-speed broadband to local residents and business. Seen as an economic development game-changer for this city of nearly 90,000, located about 45 minutes northwest of Denver, it is scheduled to be available by 2016. And the monthly price, which is reported to be around $49, is destined to raise some eyebrows among intrigued city planners. Viewed as a quasi-public utility, the ultimate goal of the city is to provide the fastest-speed at the most affordable price of any city in the nation.

Greater access to reliable and fast Internet services allows city locals and visitors to efficiently navigate business and lifestyle options. It also helps citizens to engage more deeply with their communities and provide data-driven feedback on ways in which improvement can take place. Growing numbers of city governments are embracing the benefits as they bring more people online, which helps bridge the digital divide that often exists in their locales. While laws and compliance will always be the primary raison d'etre for public entities, there is a reason for optimism in their willingness to acknowledge and celebrate new technologies.

The key drivers of citizen engagement are phones and other mobile tools. Anthony M Townsend expresses this theme eloquently in his book, Smart Cities: Big Data, Civic Hackers, and the Quest for a New Utopia. He writes:

“We are witnessing the birth of a new civic movement, as the smartphone becomes a platform for reinventing cities from the bottom up. Every day, all across the globe, people are solving local problems by this increasingly cheap consumer technology… And smartphones are just the start - open government data, open-source hardware, cities of the future that are far smarter than any industry mainframe. And so, just as corporate engineers fan out to redesign the innards of the world’s great cities, they’re finding a grassroots transformation already at work. People are building smart cities much as we built the Web - one site, one app, and one click at a time."

The proliferation of phones and other mobile devices are the tipping point of a new digital normal for cities. Ridesharing tools like Uber and Lyft, community building sites like Meetup.com, dining apps like OpenTable.com, and even new digital currency apps like Airbitz.com open the door for civic engagement and local economic activity.

And what about access to power sources for these mobile devices? We’ve all had times when our phone batteries have gone dead, leading us to a frantic search and rescue mission for an electrical outlet. This is the reason why ChargeIt (chargeitspot.com) stations are becoming available in growing numbers of cities.

In the end, this mashup of tech infrastructure, consumer tools, and government engagement are fostering an exciting evolution in how we interact with our built environments. It signals the next wave of innovative solutions driving the connection between technology and the economic development of cities and regions.

Michael Scott is a Denver-based journalist specializing in disruptive themes fueling today’s emerging digital economy. More on his work can be found on his blog site, BITDisrupt.

Flickr photo by Adam Fagen: Texting Congress in support of medical research; Washington, D.C.

The Politics Of The Next Recession: How A Bust Could Impact The 2016 Elections

$
0
0

n this hyper-political age, perceptions about virtually everything from the weather to the Academy Awards are shaped by ideology. No surprise then that views on the economy and its trajectory also divide to a certain extent along partisan lines.

How the public perceives the economy will have a major impact on this year’s elections. That most are already discouraged cannot be denied;  the negative sentiment has propelled the rise of such seemingly marginal political figures as Donald Trump and Bernie Sanders. But will the economy prove a bother to the Democrats?

A lot depends on where you live and what you do. Much of the country is not doing so well; despite a strong two-year run in job creation, some 93 percent of U.S. counties still have not gained back all the jobs that they lost in the Great Recession, according to the National Association of Counties.

Yet many liberals believe the economy is shipshape. Paul Krugman, the progressive economist, hails the “Obama boom,” citing rising employment, some slight income gains and, at least until recently, a soaring stock market.

Krugman and others point to California, the epitome of true-blue virtues, as having what one progressive journalist calls a simply “swell” economy. Rarely mentioned is the fact that, for the past two decades, the state’s economy has more often underperformed national averages.

More serious still, the same state that boasts Silicon Valley also suffers the highest poverty rate in the nation. Overall nearly a quarter of Californians live in poverty, the highest percentage of any state, including Mississippi. According to a recent United Way study, close to one in three is barely able to pay their bills.

A slowing economy and weak stock market, in contrast, does offer some solace to Republicans, who clearly see a political opportunity. Even at its best, this has been a slow growth recovery and while the official unemployment rate has improved sharply, labor participation rates remain depressed by historical standards. Millions of young people remain in their parent’s homes as opposed to engaging the economy, buying homes, and getting onto adulthood.

The End Of The Asset Boom

America may not be in as bad shape as Republicans and conservatives like to insist. Certainly compared to Europe or Japan, we’re in great shape. While some doubt weakness in China really poses a danger to the U.S. – exports account for only 13% of U.S. GDP, after all, and China is not one of the largest markets for U.S. goods — David Stockman, among others, argues that China’s slowdown is due to a dangerous phenomenon that is present in the U.S. as well: a disastrous level of debt. Some Democratic economists like Larry Summers, as well as economic gurus such as Mohammed el-Erian, warn that we should at least prepare for the possibility of recession.

Certainly the China crisis threatens the trajectory of certain blue cities. Money from China and other parts of Asia has helped propel real estate markets in places like coastal California, New York and San Francisco. China has also been a major source of tourists and consumers for high-end electronic products that are at least designed and marketed here.

Similarly California’s tech boom also seems to have reached its apogee. The fact that Silicon Valley types have gotten rich appears to have done little for the average American, and done very little to improve productivity. With the market looking on with greater skepticism, several major players — Groupon, Yahoo, Twitter, for example — seem vulnerable. If a full scale bust is not imminent, a downturn in valuations, and likely employment, seems inevitable.

A slowdown in the Valley could place the blue bastions in an uncomfortable situation, exacerbating splits already evident in the Clinton-Sanders clash. The mega-profits enjoyed by sectors close to the Democrats, notably Silicon Valley, media and a large part of finance, have encouraged progressives to advance an ever more expansive, and expensive, liberal agenda. With billionaires stalking the streets of San Francisco, who could possible oppose a big boost in the minimum wage, family leave, massive transit projects and the provision of subsidized housing.

Progressives may detest the investor class that has gotten rich in the “Obama boom,” but they remain deeply dependent on them to finance their green and social agendas. California’s coffers have been filled in recent years largely by the huge rises in income and capital gains among the investor class, who are well represented in the Golden State. Similarly New York Mayor Bill de Blasio’s aggressive agenda for new housing and expansion of social programs depends largely on the continued looting of the economy by Wall Street.

The developing decline in asset values threatens the progressive agenda, and could set up a major battle between key progressive constituencies — rich liberals and those dependent on public sector spending. The fundamental incompatibility of ever-expanding pension liabilities and the provision of basic public services is becoming painfully clear in places like Chicago and Detroit, and smaller cities like San Bernardino and Stockton. More of blue America could join them if asset values continue to drop.

A nascent recession would almost certainly spark something of a civil war between the traditional left constituencies and the kind of business progressives one finds in Silicon Valley, Wall Street and the media industry. A first stage of this conflict is already emerging in California, where former San Jose Mayor Chuck Reed has been seeking to rein in the state’s unfunded $350 billion pension liability. Silicon Valley largely has backed Reed’s past efforts, which has elicited a fierce blow-back by the public employee unions and their political allies.

Blue And Red, Reinforced

A recession would change many things, but not enough to challenge Democratic dominance in California, New York and other parts of the “blue wall.” Unemployment could double and Hillary Clinton — perhaps even Bernie Sanders — could win these places in a walk. After all, Jerry Brown was elected and then re-elected when California’s economy was still struggling to recover. Theoretically, the cost of energy, the lack of water for farms, and a decaying infrastructure should provide an opening for Republicans, but as middle income families continue to move elsewhere, the shift to a single, childless, minority and immigrant demographic makes any successful GOP makeover all but impossible.

Instead of pushing them to the GOP, a recession could further radicalize the Democrats but not upset their control of dark blue states. But the deepening decline in the real tangible economy — energy, manufacturing, agriculture — could prove a boon to the GOP in much of the rest of the country.

Before the decline in oil prices many areas in the middle of the country enjoyed a gusher in energy jobs, providing high wage employment (roughly $100,000 annually, exceeding compensation for information, professional services, or manufacturing). Due largely to energy, states such as Texas, Oklahoma, North Dakota have enjoyed consistently the highest jobs growth since 2007, and were among the first states to gain back all the jobs lost in the recession.

Of course, tough times in red states like Texas, Oklahoma, Louisiana and North Dakota will only pad Republican gains. But there are other, contestable heartland states — Ohio and Pennsylvania, in particular — that also benefited from the expansion of fracking, which created whole new markets for manufactured products like pipes and compressors. Similarly, the administration’s directive to crack down on coal plants could be problematic for Iowa, Kansas, Ohio, Illinois, Minnesota and Indiana, which rank among those most reliant on coal for electricity. Not surprisingly much of the oppositionto the EPA’s decrees come from heartland states.

Right now virtually every Great Lakes state, except Illinois, enjoys unemployment rates below the national average and several, led by the Dakotas, Minnesota, Nebraska and Iowa, boast among the lowest in the nation.

But with energy, agriculture and manufacturing slowing down, the prospects for the middle of the country have turned increasingly sour. A manufacturing decline might not matter much to New York, where the sector accounts for barely 5 percent of state domestic product but industry accounts for 30 percent of the economy in Indiana, 19 percent in Michigan. If the current trends hold, the case for the “Obama boom” in this vast swath of America may be further weakened.

To the problems of regulation and market turbulence, manufacturing economies are also threatened by the rising value of the dollar, which threatens the Rust Belt’s prime exports and bolsters competitors, both in Europe and Asia. After all, manufactured goods are the leading export in much of the upper Midwest while food exports, also hard-hit by the hard dollar, dominate many Great Plains economies. In 2012, a recovering Rust Belt was critical to President Obama’s victory; a weakened industrial economy could make Republicans more competitive in the region, particularly if they nominate an electable candidate.

Will A Recession Create A New Politics?

Until the stock swoon, few commentators focused on the political implications of what very well may be an emerging recession. After all, if coal miners in West Virginia lose their livelihoods, it hardly effects the lifestyle of Capitol bandits a couple of hours away, and eliminating oil jobs in Bakersfield doesn’t cramp the style of tech moguls who don’t ever get their hands dirty. But with the stock market in sharp decline, the affluent may soon be feeling some of the angst felt by many middle and working class people during the “Obama boom.”

Indeed because President Obama’s policies are so identified with progressivism, a recession now could undermine support for his bank-friendly, super-green policies. The chimera of green jobs never had much reality, but low energy prices inevitably weaken the renewable sector. In times of asset inflation, losses on the farm, the factory, the mine or the drilling platform can be dismissed as part of “disruption” and progress, but what happens if other linchpins of the economy, notably tech and finance, begin to wobble as well?

If nothing else, a weaker economy will accelerate the increasingly populist tone of the Democratic Party, as epitomized by Senator Bernie Sanders’ remarkable rise. The kind of neo-liberalism epitomized by the Clintons rested on financial support from Wall Street, Silicon Valley and media companies. This support has become something of a liability for the former Secretary of State.

But the most important political impact of a slowdown or new recession, will be in the heartland, where elections are often won. Yet logic seems on a holiday in a Republican Party which seems to feed on resentment but produce little in the way of practical solutions. Indeed front-runners like Donald Trump and Ted Cruz thrive not by addressing economic growth but focusing instead on anxieties relating to immigration, Islamic terrorism and cultural change. Amidst an incipient recession, or at least a serious slowdown, after a weak recovery, Republicans should be able to make some gains, but to do so they have to give some glimmer of having the chops to turn the economy around.

Joel Kotkin is executive editor of NewGeography.com and Roger Hobbs Distinguished Fellow in Urban Studies at Chapman University, and a member of the editorial board of the Orange County Register. He is also executive director of the Houston-based Center for Opportunity Urbanism. His newest book, The New Class Conflict is now available at Amazon and Telos Press. He is also author of The City: A Global History and The Next Hundred Million: America in 2050. He lives in Orange County, CA.

Photo by Gage Skidmore [CC BY-SA 3.0], via Wikimedia Commons


Discount Airlines: The Cheap Seats Challenge

$
0
0

Market forces in the airline business are, for the moment, a battle between state-owned carriers like Alitalia and Aeroflot, and start-up discounters like Ryanair and AirAsia. The conflict between state monopolies and under-capitalized start-ups is a perfect metaphor for the economic debates over subsidies and competition that divide much of the industrial world in America, Europe, and Asia. When my dreams come true, carriers like these will encircle the globe with two-hour, $49 short-hop flights.
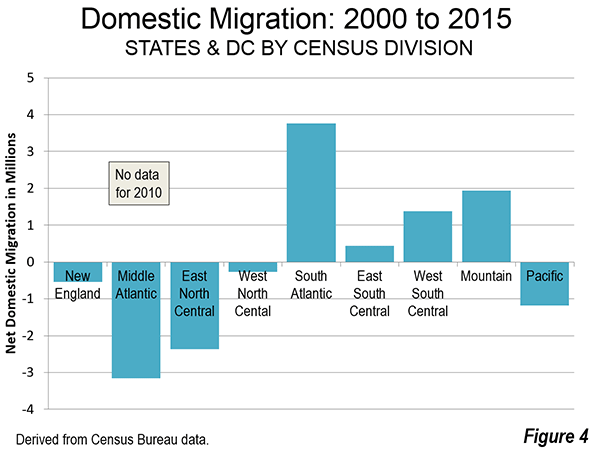
With the Internet marketing sky-high seats in real time, travel pricing has become an endless bazaar. Airborne seats are one futures market that everyone understands. For the moment, there’s no clear winner in these fare/service battles, although many state airline companies are functionally bankrupt. The monopolists fly the latest jets and check bags without ransom payments, while the discounters, going nearly everywhere (Pristina, Erbil, Kochi, and Perth are among their many stops), find leg room, hungry passengers, and reclining seats annoying.

For now, don’t expect the large airlines to cave in to the budget carriers. Competitive round-the-world tickets, using established airlines, can be found for about $1500-2000, although only for about $3000 can you visit all the places that may interest you and still move around the world.

Is it possible to travel around the world using only one-way, discount airlines? To try, I would start by heading east — from my home in Switzerland — to Dubai or its suburb, Sharjah, a hub of low-cost carriers. Wizz Airlines, an Eastern European carrier, can get me there for less than $100, although it means a connection in Cluj-Napoca, the capital of Transylvania.

For a little more money, I could trade my Romania stopover for Istanbul’s Sabiha Gökçen International Airport (way out of town), and get to the Persian Gulf on Pegasus, a Turkish low-cost airline that links Europe to the Middle East; use it to get to Baku, Tehran or Turkish Cyprus.

From Dubai, the trick is to find a Middle Eastern budget airline — Air Arabia and flydubai are two of my preferred magic carpets — that overlaps with the vast network of Asian low-cost carriers, which include, among many others, Air Asia, Cebu Pacific, and Jetstar.

India and Sri Lanka offer a few of the “crossover airports,” where I could change, say, from flydubai ($120 to Colombo) and enter Air Asia’s low-cost paradise ($80 to go on to Kuala Lumpur).

Fortunately, nearly every Asian country — especially India, Malaysia, Singapore, Hong Kong, South Korea, Australia, and the Philippines — is a discount hub. For less than $300 it is easy to go from Delhi to Japan on lines such as Tiger, Vanilla, IndiGo, and Lion. You will have to change somewhere, but that provides a chance to stretch cramped legs or visit Chittagong.

It is somewhere way east of Suez that my round-the-world discount dreams start to blur.

The Pacific Ocean does not lend itself to puddle-jumping airlines. The only 'local' among the long-haul trans-Pacific flights is United Airlines #155, which in leisurely fashion connects Guam (get there on Cebu Pacific for pocket change) to Honolulu, with stops in Truk, Pohnpei, Kosrae, Kwajalein, and Majuro, atolls that the Marines liberated in World War II.

Air Micronesia (affectionately “Air Mike”) used to fly this mail run across the central Pacific, but that carrier became Continental and now is part of United, which no one will ever confuse with a low-cost carrier. As best as I can determine, just to fly from Guam to Honolulu on the island hopper would cost about $1500, which is a lesson in monopoly pricing.

Without a discount airline to get across the Pacific, the only option is to search for one-way tickets on established airlines, which sometimes offer fares for about $400 to $500.

Technically, these airlines are not discounters and many of the cheap trans-Pacific fares involve cumbersome changes en route; low-fare-paying customers are routed on emptier flights. Some Pacific layovers are for about nineteen hours in places like Wuhan or Incheon.

Once you are in Los Angeles or San Francisco (LAX is the cheaper option), it’s easy to embrace the discount networks of JetBlue ($159 in mid-January) or Southwest ($147) to hop across the United States.

One-way trans-Atlantic plane tickets are expensive. Generally, on the big carriers they cost the same as a round-trip tickets, sometimes more. To get home to Europe on a budget, my two best choices involve Scandinavia and Iceland.

Norwegian is a low-cost airline that has one-way flights for about $300 from New York to London Gatwick, Oslo and Copenhagen, and then connections into a wide European network.

The cheaper option is WOW, an Icelandic discounter that flies from Boston to the continent with a stop in Reykjavik (okay, you purists, Keflavik).

In mid-winter, WOW can take me across the Atlantic, although not back home to Geneva, for less than $200. To get home I would then be at the mercy of EasyJet, which is technically a low-cost airline but, to my mind, a full-cost baggage hauler, which charges crazy prices for checked luggage, with its rudeness toward paying customers thrown in for free.

On a direct line north of the equator, this trip might have cost me $1500, and would have taken me, depending on a few choices, through Romania (Cluj-Napoca), Dubai, Colombo (Sri Lanka), Malaysia (Kuala Lumpur), Seoul, Wuhan (China), Los Angeles, New York, Boston, Reykjavik, and Copenhagen. The total time in the air would have been about fifty hours.

For most of us it would be the trip of a lifetime, and it can be done for less than $1500, provided you are not checking a bag.

What could go wrong? The exposed flank in my travel plans is the Pacific Ocean. Only by plugging and playing with a lot of combinations of cities and dates can I find those one-way $400-500 fares. They only show up briefly on carriers such as Evergreen, Korean, or Air China, and just as quickly vanish.

Try as hard as I have, I cannot find a discount Russian airline, not even the alluring S7 or Yakutia, to make the land bridge from Siberia across the Bering Strait to Alaska. Even if I did get to Anchorage I would be out of luck finding a cheap airline to the lower forty-eight, except to Minnesota in mid-summer, on something called Sun Country.

Nor have I been able to find local airlines to take me across the South Pacific on, say, the path Ahab took in Moby-Dick. Fiji Airlines has some promise, but gouges whenever the opportunity arises. Jetstar, owned by Qantas, does make it possible to fly for relatively low cost between Cambodia and New Zealand. So, for now, the trans-Pacific discount trail grows cold after Fiji. Although I can think of worse places, including Cluj-Napoca, to run out of gas.

Matthew Stevenson, a contributing editor of Harper’s Magazine, is the author most recently of Remembering the Twentieth Century Limited, a collection of historical travel essays, and Whistle-Stopping America. His next book, Reading the Rails, will be published in 2016. He lives in Switzerland.

Flickr Photo by dreamcatcher-68: Wizz Air HA-LWF Airbus Z320-232.

Viewing all 3789 articles
Browse latest View live


Latest Images