Quantcast
Channel: Newgeography.com - Economic, demographic, and political commentary about places
Viewing all 3794 articles
Browse latest View live

12 Ways to Map the Midwest

$
0
0

What is the Midwest? There’s been a lot of debate about this question among folks passionate about such thing. But it defies easy definition. Here are eleven ways various people have taken a crack at drawing the map.

Traditional Maps

1. The Northwest Territory

Start with the original Northwest Territory, now sometimes referred to as the Great Lakes region. This is the historic core of what we now think of as the Midwest.

nwterr

Image via WorldAtlas.com

2. Midwest Census Division

The Census Bureau has an official definition of the Midwest, which is one of four so-called “Census Divisions.” This is further divided into two “Census Regions” as in the map below.

Ethnic and Cultural Definitions

Others have attempted to draw maps based on shared ethnicity and culture. These tend to deny the existence of an actual Midwest as we think about it today.

3. Nine Nations of North America

One of the most famous of these is from Joel Garreau, who made a claim that there were actually nine nations on the North American continent in his book of that same name.

9nations

Joel Garreau’s Nine Nations

4. Eleven Nations of North America

Colin Woodard took this a step further and argued that there were really eleven nations in North America, which he identifies based on settlement patterns. You can see his writeup on this in an article in Tufts Alumni magazine.

Colin Woodard's 11 Nations

Colin Woodard’s 11 Nations

Economic Definitions

Other maps try to define a region based on shared economic characteristics such as industries.

5. The Rust Belt

Here’s a map of the Rust Belt that’s floating around the I found on a website about coal communities of all places. I’m not sure exactly where it originated.

The Rust Belt

The Rust Belt

Hybrid Definitions

These maps attempt to use both shared cultural/historical and economic characteristics to define a Midwest region.

6. Richard Longworth’s Midwest

In his book Caught in the Middle: America’s Heartland in the Age of Globalism, Richard Longworth created his own bespoke definition of the Midwest. He notably excludes the southern regions of Missouri, Illinois, Indiana, and Ohio as extensions of the south (similar to the 9 & 11 nations map), and also the pure play Great Plains states along the western edge of the Census definition.

Richard Longworth's Midwest

Richard Longworth’s Midwest

7. Pete Saunder’s Five Midwests

Pete combines the nations approach with the traditional Census definition of the Midwest in order to divide the Midwest into five sub-regions.

Pete Saunder's Five Midwests

Pete Saunders’s Five Midwests

8. Kotkin’s American Regions and City-States

Joel Kotkin took a similar approach to dividing America up in Forbes magazine. His view also appears to be a hybrid of culture, economics, and history. He turns America into seven regions and three city-states (New York, LA, and Miami). The full map is too huge to blog, but an excerpt is below which you can click on to see the whole thing in a new window.

The Midwest in Kotkin's map

The Midwest in Kotkin’s map

Crowdsourced Maps

A couple of other people used crowdsourcing, in whole or in part, to define the Midwest

9. Walter Hickey/538 Map

Walter Hickey, writing at 538, conducted a survey with Survey Monkey to ask people which states they thought were in the Midwest. Here’s what he came up with.

Walter Hickey/538 Map

Walter Hickey/538 Map

10. miguecolombia’s Reddit Map

Here’s one that I found on a Reddit thread started by user miguecolombia. It appears to be his personal take on how to divide America, with a strong dose of crowdsourcing from Reddit.

miguecolombia and Reddit's map

miguecolombia and Reddit’s map

Self-Defining Maps

And a couple maps that try to use statistical techniques to let the Midwest map itself.

11. Facebook Network Maps

Pete Warden took a look at Facebook profiles and connections to create clusters of regions. Most of what we’d think of as the Midwest he called Stayathomia, which also covers much of New England.

Pete Warden's Map

Pete Warden’s Map

12. Chicago Migration Map

Lastly, a special surprise – a map you’ve never seen before. This was created by someone named Daniel Jarratt, who emailed it to me back in 2012. Using Chicago as the capital of the Midwest, he used IRS migration data and a statistic technique called modularity to divide the US into regions based on affinity with Chicago. Darker red means more connection to Chicago and thus in a sense more Midwest.

Daniel Jarratt's Midwest

Daniel Jarratt’s Midwest

Aaron M. Renn is a senior fellow at the Manhattan Institute and a Contributing Editor at City Journal. He writes at The Urbanophile, where this piece originally appeared.

Top photo by Benjamin Reed (flying over the midwestUploaded by France3470) [CC BY-SA 2.0], via Wikimedia Commons


Berlin: The Imperial Impulse in City Planning

$
0
0

"He who controls Berlin, controls Germany, and who controls Germany, controls Europe." V.I. Lenin (but also attributed to Karl Marx, and sometimes to Otto von Bismarck)

About the time that Syrian refugees were on the march to Germany’s safe havens, I spent a few days in Berlin, which is not only the capital of reunified Germany, but the unofficial capital of the European Union, as well as being hipster ground zero.

The Europe that united under the EU — the New Europe — was predicated on a weak, federal Germany surrounded by strong members such as France, Britain, and Italy. On paper, the EU has its headquarters in Brussels and, for one week a month, in Strasbourg (to placate the envious French). But the Union's power emanates from Berlin, where Angela Merkel — the latest Iron Chancellor — has made most of the EU decisions concerning the Greek bailout and Syrian emigrants. The EU has become a ward of the Teutonic Knights, where solvency and peace come only from German diktats.

Does the modern city of Berlin speak about a resurgent Germany (über alles, so to speak), or about the ability of the Union to tame the excesses of German nationalism?

Since Germany united in 1989 the success of reunification has often been measured in the bright lights and new buildings that have spread across Berlin, from West to East. Once a Cold War no-man’s land, the Potsdamer Platz is now a crossroads on Architectural Digest walking-tour maps, while the worker housing in the East has been recycled into studios and sidewalk bistros for hi-tech executives and skateboarders.

For the past twenty years, I have believed that a healthy and vibrant Berlin could only mean good things for the European Union. It meant that reunified Germany was working, that Russia was at bay, and that in the New Europe there were enough new jobs to service the debt on the leveraged buyout of Eastern Europe.

On this trip to Berlin, however, I glimpsed the other side of the German coin, which is that as Germany succeeds — economically and politically — the European dream will become ever more distant.

What did I see in Berlin that made me doubt the future of the European Union?

On the surface, Berlin is a success story, with open-topped tourist buses crisscrossing the city and new restaurants. Old working-class neighborhoods such as Prenzlauer Berg and Kreuzberg have gotten facelifts, and the city’s infrastructure of railroad stations, banks, and conference centers glistens.

In other, more subtle ways, however, the city seems to be fulfilling the dreams of Adolf Hitler and his architect, Albert Speer, to turn Berlin into a capital of the thousand year Reich, even if, for now, it is a dream of admirable intentions.

Take the $600 million gilded palace of the Humboldt Forum that is being built on Museum Island, just off Unter den Linden, the imperial boulevard of Prussian dreams.

Swathed in marble frontage, the reconstructed palace dwarfs much that is nearby, including several classical museums. The web site descriptions make it sound like an elaborate visitors’ center, however, with nebulous goals:

The Humboldt Forum is a novel centre for exhibitions, events, and human encounter in the heart of Berlin. Museums, a library and a university will pool their competencies and create a lively place where knowledge about the cultures of the world can grow and be exchanged. In this, the Humboldt Forum distinguishes itself from the traditional idea of the ethnographic museum.

It's difficult not to recall that Hitler, when he spoke to Speer about the purpose of the nearby New Reich Chancellery on Voss Strasse, said, “On the long walk from the entrance to reception hall they’ll get a taste of the power and grandeur of the German Reich!”

* * *

On this trip, I had the use of a bicycle — until it was stolen — to ride around the city, including along Unter den Linden. Graffiti is still visible on the last fragments of the Wall; elsewhere, I came across some posters of the far-right National Democratic Party (NPD), with turbaned immigrants and the tag line: “Have a good flight home.”

I first saw united Berlin in December 1989, a month after the Wall came down, when it was a city in liquidation. As if in the Berlin airlift, I flew on a Pan American jet from Frankfurt, and in a friend’s small Trabant toured West and East Berlin, which felt, respectively, like Manhattan and Brooklyn, in the days before gentrification. The Kurfürstendamm had the brand-name franchises of New York’s Fifth Avenue, while East Berlin felt like the far reaches of Bensonhurst.

This time, on foot (post-bike theft), I saw a united Berlin, but one with many cracks in the sidewalks. I found a street on which the English writer Christopher Isherwood, whose fiction inspired the play and movie Cabaret, had lived. His building was destroyed in the war, and the replacement speaks of the temporary housing that became permanent. If writing now about the city’s decadence, he might describe its bureaucracies — Humboldt is run by the Prussian Cultural Heritage Foundation — rather than its cabarets.

Another thing I did was go around to Berlin's bookstores, and was surprised at how mediocre many were. Yes, they had book club novels and Hitler histories, but everything looked second-hand, not fresh off presses with any new ideas about the European Union, Mrs. Merkel, or Berlin. Has Germany discovered the end of history?

* * *

Before the bike vanished, I did take it up and down the Wilhelmstrasse to see what remains of Hitler’s and Bismarck’s Berlin. The city doesn’t have much from Bismarck's era as the head of the German government. He wanted Berlin at the head of a unified Germany. When he got what he wanted in 1871, he realized (although it was too late for him to do much about it) he had the rest of Europe as his enemies.

Likewise, the imperial masquerade of Speer’s Berlin went up in the smoke of the World War II. Hitler mandated him to draw boulevards wider than the Champs-Élysées, and reception halls vaster then the cathedral at Rheims. It was to have been Rome on steroids.

In his memoirs, published in the 1970s, Speer describes a Hitler consumed with architectural ambitions, as if his military and political aggression was just to make the world safe for his city planning. The two spent countless hours discussing castles in the air, or an imperial way from the south Berlin station to a Great Hall near the Reichstag.

There was to have been an oversized Arch of Triumph, and various Nazi ministries housed behind those faceless façades of National Socialism that spoke of government by diktat. Looking back on his dreams, however, Speer wrote of the Grunewald forest, “Of the whole vast project for the reshaping of Berlin, these deciduous trees are all that have remained.”

Matthew Stevenson, a contributing editor of Harper’s Magazine, is the author most recently of Remembering the Twentieth Century Limited, a collection of historical travel essays, and Whistle-Stopping America. His next book, Reading the Rails, will be published in 2015. He lives in Switzerland.

Flickr photo by Nigel Swales: Billboard announcing construction on the now-completed Schlossplatz - Berliner Schloss (Humboldt Forum); a modern building housing museums and offices, but with the façade of the original city palace.

Too Many Places Will Have too Few People

$
0
0

The adage “demographics are destiny” is increasingly being replaced by a notion that population trends should actually shape policy. As the power of projection grows, governments around the world find themselves looking to find ways to counteract elaborate and potentially threatening population models before they become reality.

Nowhere is this clearer than in China’s recent announcement that it was suspending its “one child” policy. The country’s leaders are clearly concerned about what demographer Nicholas Eberstadt has labeled “this coming tsunami of senior citizens” with a smaller workforce, greater pension obligations and generally slower economic growth.

A second example is Europe’s open migration policy. Despite widespread opposition by its own citizens, and cost estimates that run to a trillion euros over 30 years, Europe’s political and business leaders regard migration as critical to address the Continent’s aging demographics. Germany knows it may not be able to keep its economic engine running without a huge influx of workers.

In defense of the migration policy, European Union economists project that refugees from the Middle East, Africa and Central Asia could boost Europe’s GDP by 0.2 percent to 0.3 percent by 2020.

This all speaks to a kind of demographic arbitrage between countries with aging demographics and those with youth to spare. Half the world’s population already lives in countries with fertility rates below replacement level (2.1 per woman).

Read the entire piece at The Orange County Register.

Joel Kotkin is executive editor of NewGeography.com and Roger Hobbs Distinguished Fellow in Urban Studies at Chapman University, and a member of the editorial board of the Orange County Register. He is also executive director of the Houston-based Center for Opportunity Urbanism. His newest book, The New Class Conflict is now available at Amazon and Telos Press. He is also author of The City: A Global History and The Next Hundred Million: America in 2050. He lives in Orange County, CA.

Photo "Nursery Cart" by flickr user Pieterjan Vandaele

China’s Demographics at a Turning Point

$
0
0

For decades, the decline in China’s birth rate was a big boost for the economy. What now?

This week, schadenfreude could have been a word invented for China experts if you judge by some of the commentary surrounding the country’s lifting of its one-child policy. Most got it right that the legacy of the one-child policy is now a problem for the Chinese economy because of a rapidly rising old-age dependency ratio (green line in the first chart below). This was tacitly acknowledged by the lifting of the policy.

But many got it wrong that the one-child policy has always been a problem for the Chinese economy since its inception. The cause of their error is the inclination in some quarters to merge a political and moral issue with an economic one, as if to press the point that unfree and coercive decisions are not only bad eventually for the economy, but bad always and from day one. Unfortunately, economic accountability does not come instantaneously after coercive policies are implemented. Politicians are lucky in that the ultimate consequences of their decisions can take years or even decades to finally be seen in full relief.

Before this occurs, the more immediate and proximate result of a bad policy may in fact be hugely positive for a long time. The reason is that a bad policy can borrow prosperity from the future, or in other words, front-load prosperity to the detriment of future generations. By enacting a policy that pulls prosperity forward, the present can look like a boom but the future then has to contend with the reversing undertow of that same policy.

At any rate, it is right that a free society focuses on the one-child policy’s encroachment on personal freedom and on the unintended consequence of a lopsided male-female ratio. But ignoring these very important issues for a moment, it must also be said that the one-child policy was in fact a significant contributor, arguably even a critical enabler, of the Chinese boom of the past few decades.

(The chart shows China’s dependency ratios: Total DR in blue; Child DR in red; Old-age DR in green. Source: UN Population Division. See definitions in footnotes.)

DR China

There is no mystery here because the chain reaction is well understood by demographers and economists, albeit perhaps forgotten or ignored by some this week. As the Chinese fertility ratio declined, so did the total and child dependency ratios (blue and red lines in the chart), opening a window of opportunity for a demographic dividend.

China’s policymakers managed to seize on this window to accelerate the economy. Here business dynamism, economic policy and the large expansion of trade with the US, Europe, Japan and other economies made a big difference and allowed the country to capitalize on the opportunity and to reap a large demographic dividend.

But there is no free lunch in economics or indeed in demographics. The long-term effect of the one-child policy was to pull prosperity forward by crashing the dependency ratio faster and generating a demographic dividend that was far larger than would have been if households had had more children.

Without the one-child policy, China’s dependency ratio would have fallen more slowly between 1980 and 2010 and may have looked more like India’s (chart below). The decline would have been less pronounced in 1980-2010 and therefore the demographic dividend less great, but the climb would be less steep now and therefore the future less challenging. See Demography Charts – 1 for dependency ratios of other countries.

BRIC Countries Total Dependency Ratios

BRIC Countries Total Dependency Ratios

With only one child to support aging parents, the dependency ratio has started a climb that will continue for several decades. Should the removal of the one-child policy result in more children, this would in the near term push the dependency ratio to rise even faster. As sure as demography was a tailwind in the years 1990-2010, it will be a headwind for decades to come.

This does not mean that the Chinese economy will be weak for decades. Demographics is only one component among many and economies can adapt to changing conditions. Should there be a surge in Chinese innovation and/or new reforms to raise productivity, China could very well skirt or mitigate the coming demographic challenge.

China’s target for annual real GDP growth is now 6.5%, compared to nearly 10% on average since 1980.  These figures must be seen against the backdrop of a working-age population that rose steadily from 500 million in 1975 to a billion in 2015, and that is expected to level off and contract to 920 million by 2035. See also Working Age Population Around the World 1960-2050.

Version 2

Here are a few notable recent articles on the one-child policy:

  • Harvard Professor Amartya Sen writes in the New York Times that the empowerment of women had more to do with China’s declining fertility ratio than did the one-child policy. This is credible on the one hand because the fertility ratio had already declined significantly by the time the policy was enacted. But it is not wholly credible on the other hand because it does not square with the issue of selective abortions. It seems odd that empowered women would have a bias for male children. Perhaps the chronology of events must be examined more closely in order to validate Professor Sen’s thesis.
  • Several commentators are quoted in this other New York Times article and most get it right. Many agree with Harvard Professor David Bloom’s statement that “the economically active share of the population will fall, reversing the demographic dividend that has figured so prominently in China’s rapid economic growth over the past few decades”. Fred Hu, founder of Chinese investment firm Primavera Capital Group, argues that “what drives China’s future in the next two or three decades is not the population. It is whether future leaders can continue to push ahead political and economic reforms.”
  • In this Wall Street Journal piece, economist Nicholas Eberstadt seems to ignore the demographic dividend when he writes that “the one-child mandate is the single greatest social-policy error in human history.” As argued above, this is true from the point of view of individual freedom, and maybe true for the Chinese economy going forward, but certainly not true for that economy from 1980 to today.

Definitions:

The total dependency ratio is the ratio of the population aged 0-14 and 65+ to the population aged 15-64. They are presented as number of dependents per 100 persons of working age (15-64).

The child dependency ratio is the ratio of the population aged 0-14 to the population aged 15-64. They are presented as number of dependents per 100 persons of working age (15-64).

The old-age dependency ratio is the ratio of the population aged 65 years or over to the population aged 15-64. They are presented as number of dependents per 100 persons of working age (15-64).

Sami Karam is the founder and editor of populyst.net and the creator of the populyst index™. populyst is about innovation, demography and society. Before populyst, he was the founder and manager of the Seven Global funds and a fund manager at leading asset managers in Boston and New York. In addition to a finance MBA from the Wharton School, he holds a Master's in Civil Engineering from Cornell and a Bachelor of Architecture from UT Austin.

Top photo by Rex Pe from Savannah, Georgia, USA (student teacherUploaded by Adrignola) [CC BY 2.0], via Wikimedia Commons

When Detroit Stood Tall and Shaped the World

$
0
0

My recent post about how urban planning decisions helped lead to the Motown sound in Detroit was inspired by David Maraniss’ new book Once in a Great City: A Detroit Story.

The book takes a deep dive into Detroit 1963, a city that was, although in some ways already in decline, in others near its zenith.

It’s a great read, in particularly for the depth of characterization. Too often Detroit writing is a story of heroes, villains, and victims. Maraniss rejects that approach and provides mostly nuanced portrayals of Detroiters that allows them to be the actual real, red-blooded human beings that they are.

I just posted a review of the book over at City Journal.  Here’s an excerpt:

In his new book, Once in a Great City: A Detroit Story, Pulitzer Prize winner David Maraniss takes a fascinating and engrossing look at the Motor City during this fateful year. Under Henry Ford II (“the Deuce”) and hard-charging salesman Lee Iacocca, the Ford Motor Company was set to unveil its revolutionary Mustang. The civil rights struggle was creating tensions in Detroit and elsewhere, but Mayor Jerome Cavanagh was committed to addressing discrimination and reforming the police. Detroit was about to transform the American musical landscape with Motown Records, whose roster of superstar artists included Smokey Robinson, Diana Ross and the Supremes, Stevie Wonder, and Marvin Gaye. The United States Olympic Committee even nominated Detroit as the American representative to host the 1968 summer Olympics, though it lost out to Mexico City. On the more dubious side, the mafia had a powerful presence in the Motor City, where colorful mob boss Tony Jack Giacalone rode around town in his garish “Party Bus” painted blue and silver, the colors of the NFL’s Detroit Lions.

Click through to read the whole review or buy the book.

Aaron M. Renn is a senior fellow at the Manhattan Institute and a Contributing Editor at City Journal. He writes at The Urbanophile, where this piece originally appeared.

The Cities Where Your Salary Will Stretch The Furthest 2015

$
0
0

Average pay varies widely among U.S. cities, but those chasing work opportunities would do well to keep an eye on costs as well. Salaries may be higher on the East and West coasts, but for the most part, equally high prices there mean that the fatter paychecks aren’t necessarily getting the locals ahead.

To determine which cities actually offer the highest real incomes, Mark Schill, research director at Praxis Strategy Group, conducted an analysis for Forbes of the 53 largest metropolitan statistical areas, adjusting annual earnings by a cost factor that combines median home values from the U.S. Census (20%) with a measure of regional price differences from the U.S. Bureau of Economic Analysis (80%).

The takeaway: When cost of living is factored in, most of the metro areas that offer the highest effective pay turn out to be in the less glitzy middle part of the country. 

Ranking first is the Houston-the Woodlands-Sugar Land metro area, followed by one high-cost outlier: San Jose-Sunnyvale-Santa Clara, Calif., aka Silicon Valley. Although average wages in the San Jose area are $38,000 higher than Houston’s $60,096, the much lower cost of living in Houston means residents there are effectively slightly better off. Adjusted for costs, Houston’s average real income is $62,136. A big contributing factor is Houston’s low home prices: the ratio of the median home price there ($215,000 in the third quarter) to median annual household income is 3.1, compared to 7.5 in the San Jose area (median 3Q home price: $795,000).

San Jose’s high ranking is somewhat of an anomaly: the very high salaries paid by the tech industry in a metro area made up of largely affluent suburban communities go a long way to make up for the high prices. San Jose’s prices were the third highest among major U.S. metro areas in 2013, the most recent year for which the BEA has data — 21.3% above the national average — while the average annual wage of $98,247 as of this year ranks first.

Another example of a higher-cost success story is the Hartford, Conn., metro area, which ranks fourth on our list with adjusted annual real earnings of $54,590. One of the lowest-density regions in the country, it boasts many small, prosperous communities with high housing prices surrounding a largely impoverished but small core city (population: 125,000 ). In 2011, the Harford metro area was ranked by Brookings as the most productive metropolitan region in the world.

But for the most part, it’s the low-cost heartland that dominates the top 15 of our ranking of Cities Where Your Salary Stretches The Furthest. Manufacturing powerhouse Detroit-Warren-Dearborn ranks third with cost-adjusted annual earnings of $55,950. The metro area is comfortably affordable, including an average home price value of $136,400, but also boasts strong wages given the area’s high concentration of factory and engineering jobs, which tend to pay better than other industries, particularly for blue-collar workers.

Low costs are an advantage that unites a number of the top-ranked heartland metro areas, including Cleveland-Elyria (seventh), where prices of goods and services are 10.5% below the national average, and Cincinnati (ninth), where prices are 9.5% below the national average. In all these areas, the cost of a house is about 20% of what passes for normal in Silicon Valley.

Hip, But Increasingly Not Worth It

Perhaps the biggest surprise in our survey is the low rankings of the “cool” cities that are widely discussed as the places that offer the best economic opportunities.

Take for instance San Francisco, a city that has become the epicenter of “disruptive” tech companies Uber, Lyft, Airbnb, Salesforce.com that are changing our service economy, as well as Twitter. With an average annual salary of $74,794, you would think people would be fat and happy in Baghdad by the Bay. But soaring home prices — median value, $657,300 — have raised costs so high that the area ranks a poor 41st on our list.

The tech boom has also raised prices in Austin, which ranked fifth when we last did this ranking in 2012, but falls to 19th this year. Over the past year, the average home value in the Texas capital has risen by $24,000, twice the increase experienced in the rest of the country. Median prices now average $217,9000, well above the national median of $188,000 for all large metropolitan regions. This is still not ridiculous, but costs do seems to be eroding some of Austin’s still powerful advantage.

Similarly, greater New York City also fared poorly, ranking 33rd, in large part due to high housing prices and the overall cost of living: prices there are 22.3% above the national average, according to BEA data, making it the second-costliest metro area in the nation.

Some of the biggest gaps between cost of living and salary are in Southern California, which has experienced significant house price gains without the income growth that makes San Jose more competitive. Already high, prices in San Diego-Carlsbad (51st), Los Angeles-Long Beach-Anaheim (52nd) and Riverside-San Bernardino (last among the 53 largest metro areas) have all risen considerably above the national average.

Long-Term Implications

Our paycheck analysis does not impact everyone equally. Given the central role of housing, for example, long-term residents who bought their homes before prices began to rise dramatically can keep a bigger portion of their take-home pay, and if they decide to sell, they’ll benefit greatly from inflated values. More directly impacted may be young adults and immigrants, most of whom do not own their own homes, and often lack the resources to buy in the more expensive markets.

Over time this could influence where young families and singles chose to migrate. Since 2010, according to an upcoming study by Cleveland State’s Center for Population Dynamics, there has been a marked shift of college educated workers aged 25 to 34. While between 2008 and 2010, metro areas like San Francisco, New York, Los Angeles, San Jose and Chicago enjoyed the biggest upticks in this coveted population, over the most recently studied period, 2010-13, the leaders were generally less expensive places like Nashville, Pittsburgh, Orlando, Cleveland, San Antonio, Houston and Dallas-Ft. Worth.

This suggests that areas that have both high-wage jobs and low costs are likely to gain momentum in coming years, particularly if the economy expands. This is not to say that people do not like the excitement and culture associated with San Francisco, Los Angeles or New York, but many may be finding that the price of admission to these fabled places may be too high.

This could be a great opportunity for less-heralded communities, from Arizona and Texas to Ohio, to gain more educated workers and the companies that require them.


Metropolitan Average Annual Earnings Adjusted for Cost of Living and Home Values
RankMSA NameAdjusted Ave Annual Earnings
1Houston-The Woodlands-Sugar Land, TX$62,136
2San Jose-Sunnyvale-Santa Clara, CA$56,147
3Detroit-Warren-Dearborn, MI$55,950
4Hartford-West Hartford-East Hartford, CT$54,590
5Dallas-Fort Worth-Arlington, TX$54,497
6Atlanta-Sandy Springs-Roswell, GA$53,922
7Cleveland-Elyria, OH$53,841
8Pittsburgh, PA$53,726
9Cincinnati, OH-KY-IN$53,405
10St. Louis, MO-IL$53,115
11Charlotte-Concord-Gastonia, NC-SC$52,508
12Birmingham-Hoover, AL$51,710
13Kansas City, MO-KS$51,460
14Memphis, TN-MS-AR$51,339
15Boston-Cambridge-Newton, MA-NH$50,373
16Columbus, OH$50,369
17Chicago-Naperville-Elgin, IL-IN-WI$50,351
18Nashville-Davidson--Murfreesboro--Franklin, TN$50,168
19Austin-Round Rock, TX$50,154
20Minneapolis-St. Paul-Bloomington, MN-WI$50,117
21Indianapolis-Carmel-Anderson, IN$49,790
22Oklahoma City, OK$49,771
23Seattle-Tacoma-Bellevue, WA$49,514
24Philadelphia-Camden-Wilmington, PA-NJ-DE-MD$48,976
25Louisville/Jefferson County, KY-IN$48,807
26Milwaukee-Waukesha-West Allis, WI$48,341
27Denver-Aurora-Lakewood, CO$48,287
28Washington-Arlington-Alexandria, DC-VA-MD-WV$48,102
29Buffalo-Cheektowaga-Niagara Falls, NY$48,071
30New Orleans-Metairie, LA$47,956
31San Antonio-New Braunfels, TX$47,837
32Rochester, NY$47,660
33New York-Newark-Jersey City, NY-NJ-PA$47,649
34Jacksonville, FL$47,230
35Raleigh, NC$47,164
36Richmond, VA$47,002
37Grand Rapids-Wyoming, MI$46,480
38Phoenix-Mesa-Scottsdale, AZ$46,281
39Tampa-St. Petersburg-Clearwater, FL$45,826
40Baltimore-Columbia-Towson, MD$45,184
41San Francisco-Oakland-Hayward, CA$45,082
42Portland-Vancouver-Hillsboro, OR-WA$44,451
43Salt Lake City, UT$43,857
44Sacramento--Roseville--Arden-Arcade, CA$43,254
45Miami-Fort Lauderdale-West Palm Beach, FL$42,976
46Las Vegas-Henderson-Paradise, NV$42,960
47Providence-Warwick, RI-MA$42,827
48Orlando-Kissimmee-Sanford, FL$42,463
49Tucson, AZ$42,264
50Virginia Beach-Norfolk-Newport News, VA-NC$42,226
51San Diego-Carlsbad, CA$37,395
52Los Angeles-Long Beach-Anaheim, CA$35,691
53Riverside-San Bernardino-Ontario, CA$34,040
Figure is the average annual wages, salaries and proprietor earnings adjusted for cost of living usine BEA Regional Price Parities (80%) and variation in Census median home value among the 53 regions (20%). Data Sources: EMSI 2015.2 Employment Data, U.S. Bureau of Economic Analysis Regional Price Parities, U.S. Census American Community Survey
Analysis by Mark Schill, mark@praxissg.com


This piece first appeared at Forbes.com.

Joel Kotkin is executive editor of NewGeography.com and Roger Hobbs Distinguished Fellow in Urban Studies at Chapman University, and a member of the editorial board of the Orange County Register. He is also executive director of the Houston-based Center for Opportunity Urbanism. His newest book, The New Class Conflict is now available at Amazon and Telos Press. He is also author of The City: A Global History and The Next Hundred Million: America in 2050. He lives in Orange County, CA.

Photo by w:Flickr user Bill Jacobus [CC-BY-2.0], via Wikimedia Commons

Cherry Hill: The Winners

$
0
0

This is Cherry Hill. It is by far the most desirable suburb in this part of southern New Jersey as measured by all the usual metrics. Property values are high. Public schools are great. The municipal government is lean and responsive. This is as good as the American Dream gets.


Screen Shot 2015-11-17 at 2.50.46 PM

Screen Shot 2015-11-17 at 2.51.14 PM

Screen Shot 2015-11-17 at 2.52.55 PM


Screen Shot 2015-11-17 at 2.52.03 PM

Screen Shot 2015-11-17 at 2.50.22 PM

Screen Shot 2015-11-17 at 3.06.03 PM

Screen Shot 2015-11-17 at 3.06.42 PM

Screen Shot 2015-11-17 at 3.05.02 PM

Screen Shot 2015-11-17 at 3.11.13 PM

The families who live here are overwhelmingly well educated professionals, often first and second generation immigrants who have discovered the high quality of life on offer. What was once a nearly 100% white enclave is now a diverse multi-cultural community. You’re just as likely to live next door to Hindus, Jews, Greek Orthodox, or Muslims, as the main line Protestants that dominated the area in previous decades. When proponents of suburban living talk about the success of the suburban development pattern this is the kind of place they often refer to.

Screen Shot 2015-11-17 at 2.56.58 PM

Screen Shot 2015-11-17 at 2.55.15 PM

Screen Shot 2015-11-17 at 2.56.28 PM

Screen Shot 2015-11-17 at 2.55.44 PM

If you’re raising children you really can’t ask for a better environment. It’s safe, clean, and (most importantly) your kids will rub shoulders with the kids of equally successful families – which is what exclusive suburbs and premium school districts are really all about. Cherry Hill has successfully filtered out the riffraff.

Screen Shot 2015-11-17 at 4.09.10 PM

Screen Shot 2015-11-17 at 4.26.18 PM

Cherry Hill has a middle-of-the-road population when it comes to social issues, but it’s decidedly conservative when it comes to money. It has embraced all the usual cost savings techniques to keep the budget tight and taxes as low as possible. Traditional in-house departments have been dissolved in favor of contract services with low cost private firms for things like waste management, school buses, and landscaping. Sales tax revenue has been boosted by cultivating the most successful regional shopping mall in the area. Class A suburban office parks deliver commercial property taxes to help subsidize the shortfall from residential taxes.

Screen Shot 2015-11-17 at 4.08.41 PM

And yet… there are problems. The average homeowner in Cherry Hill pays about $8,000 a year in property tax. Some of the larger homes pictured above pay on the order of $23,000 a year. You can blame teachers and cops and their “extravagant” salaries and pensions, but schools and public safety are the primary attractions to living in Cherry Hill. Outsourcing to low wage alternatives for these public services may not really work over the long term – although Cherry Hill keeps pushing that envelope. And the cost of maintaining a huge amount of very expensive attenuated public infrastructure like roads, sewers, and water pipes is rapidly getting out of control.

Screen Shot 2015-11-17 at 3.59.48 PM

Screen Shot 2015-11-17 at 5.54.35 PM

Screen Shot 2015-11-17 at 5.54.06 PM

Here’s another problem with Cherry Hill. This is what passes for the public realm. All the emphasis has been placed on private space. The homes, the tree lined subdivisions, the quality retail establishments, and the hermetically sealed professional centers are pristine. But in between there’s nothing that even comes close to a pleasant commons. Route 70 is “Main Street.” That’s all you get. Of course, the people who self select in to Cherry Hill don’t care. They’re inside their homes, shops, offices, and cars 100% of the time. There’s simply no need for a public realm. It’s a fully private pay-per-view environment.

Screen Shot 2015-11-17 at 4.01.15 PM

Screen Shot 2015-11-17 at 3.59.17 PM

Screen Shot 2015-11-17 at 3.50.30 PM

Screen Shot 2015-11-17 at 4.10.16 PM

Screen Shot 2015-11-17 at 4.13.11 PM

Unless you’re one of these poor bastards standing on the side of the highway waiting for a bus that may or may not arrive sometime within the next hour. These people can’t afford to live in Cherry Hill or own private vehicles so they commute on crappy inadequate public transit to and from neighboring low income suburbs.

Cherry Hill is a giant wealth sponge. It soaks up the segment of the population that can afford to live the best version of a suburban life. That means there are many other suburbs – the vast majority – that become the also-ran towns of fair-to-middling suburbs with just-okay schools and mediocre shops. And then there are the lower income suburbs farther out that can’t quite manage to bootstrap themselves up above the poverty line.

The dominant conversation in America today centers on the bleakness of inner city ghettos and the extravagance of newly gentrified urban elite neighborhoods. The reality is that most Americans live in the suburbs. A small number of people live in a few great places like Cherry Hill. The overwhelming bulk of the population, including the poor and large downwardly mobile middle class, now live in failing cheap anonymous declining suburbs that no one talks about – until they erupt Ferguson style.

I’m just sayin.

John Sanphillippo lives in San Francisco and blogs about urbanism, adaptation, and resilience at granolashotgun.com. He's a member of the Congress for New Urbanism, films videos for faircompanies.com, and is a regular contributor to Strongtowns.org. He earns his living by buying, renovating, and renting undervalued properties in places that have good long term prospects. He is a graduate of Rutgers University.

2014 Journey to Work Data: More of the Same

$
0
0

The major metropolitan area journey to work data is out, reported in the American Community Survey ‘s 2014 one year edition. The news is that there is not much news. Little has changed since 2010 despite all the talk about “peak car” and a supposed massive shift towards transit. Single occupant driving remains by far the largest mode of transport to work in the 53 major metropolitan areas (with over 1,000,000 population), having moved from 73.5 percent of commutes to 73.6 percent. Little upward change in single occupant commuting can be expected, since it is probably already a virtual saturation rate.

The only significant change is the most important trend that is occurred for decades in US commuting: the reduction in carpooling. Between 2010 and 2014, carpooling dropped from 9.8 percent to 8.8 percent in the major metropolitan areas.

Transit continued to hold on to third place, with an increase from 7.9 percent to 8.1 percent in the major metropolitan areas. Working at home, including telecommuting, continued its more dramatic rise, from 4.4 percent in 2010 to 4.7 percent in 2014. Walking remained constant at 2.8 percent, while cycling continued its increase but from a small 0.5 percent to 0.7 percent. Other modes of transport, such as taxis and motorcycles remained constant at 1.2 percent (Figure 1).

In the major metropolitan areas, transit continued to lead over working at home (8.1 percent compared to 4.7 percent), though at the national level the margin was much smaller (5.2 percent compared to 4.5 percent). Transit strength was far more concentrated principally in a few metropolitan areas with “legacy” cities and, as a result, working at home exceeded transit's market share in 39 of the 53 markets.

Should carpooling continue its downward trend, it would fall below transit before the end of the decade among the major metropolitan areas (now at 8.8 percent compared to transit 8.1 percent), though the carpooling lead is sufficient to retain second-place far longer at the national level (9.2 percent compared to 5.2 percent). As in working at home, however, transit's strength is highly concentrated relative to carpooling. Transit leads carpooling only in the six metropolitan areas with transit legacy cities (New York, Chicago, Philadelphia, San Francisco, Boston, and Washington), while carpooling leads in 47 metropolitan areas.

Commuting market share data for the major metropolitan areas is shown in Tables 1 and 2.

Transit Gains and Losses

With by far the most attractive urban environment for transit use in the United States and far and away the largest system, New York dominated the transit share of the  journey to work data, adding 240,000 daily transit commuters between 2010 and 2014 (out of a national total of 576,000). Six other metropolitan areas with the strongest transit gains were San Francisco at 66,000, Chicago with 41,000, Boston with 38,000, Seattle with 34,000 and Washington with 32,000. All of these were above the next highest, Philadelphia, with 16,000. Each of these metropolitan areas, with the exception of Seattle, has a transit legacy city at its core. Overall the other 45 metropolitan areas, with nearly 70 percent of the population, accounted for less than 20 percent of the transit increase.

Los Angeles, which has been hailed as the becoming "next transit city," seems long on intentions and construction, but wanting in results.  The laggard transit performance of Los Angeles, despite one of the world's most aggressive rail construction programs has been described in a recent Orange County Registercommentary. In 2014-2015, ridership on the legacy MTA (former SCRTD) bus and rail system was almost 10 percent below the bus only system of 1985, despite an increase in the Los Angeles County population of approximately one-quarter (see: Los Angeles; Rail for Others).

Thirteen metropolitan areas experienced modest transit commuting losses (less than 3,000). In addition to Los Angeles, these included rail metropolitan areas Virginia Beach-Norfolk, San Diego, Buffalo, Cleveland, and Pittsburgh.

Working at Home Gains and Losses

The largest working at home gain was also in New York, at 40,000 (out of 499,000 in the major metropolitan areas). The second largest gain was in Los Angeles at 32,000. San Diego added 27,000 people accessing work from home. Four metropolitan areas lost commuters who work at home, though the losses were modest (less than 1,000) in all but Virginia Beach-Norfolk, where the decline was more than 11,000.

Driving Alone Gains, No Losses

New York also led in the number of additional commuters driving alone to work, adding more than 420,000. The other largest gainers were in Los Angeles at 325,000 and Houston at 309,000. All of the 53 major metropolitan areas added single occupant commuters and in each single occupant commuting added more than any other mode, including transit. Rochester had the smallest increase, at 7,000.

Carpool Gains and Losses

Despite its continuing overall losses, carpooling made gains in some metropolitan areas. Detroit led with nearly 14,000 new carpoolers, followed closely by Orlando, Portland, and Dallas-Fort Worth both added more than 10,000 new carpoolers, adding more commuters than their rail oriented transit systems.

However, the car pool losses were generally more severe. Chicago lost nearly 36,000 carpooling commuters. Los Angeles lost 30,000, New York lost 29,000 and Tampa-St. Petersburg lost 19,000. Losses of more than 10,000 were also sustained in Washington, St. Louis, San Diego, Pittsburgh, Phoenix, Memphis, Baltimore, and Boston.

Cycling Gains and Losses

New York also gained the most cycling commuters, at nearly 14,000, followed by San Francisco at 13,000, Los Angeles at 10,000. Eight metropolitan areas lost cycling commuters, but only two exceeded 250, Grand Rapids (800 loss) and Riverside-San Bernardino (700 loss).

More of the Same

U.S. commuters continue to travel to work using the modes that have dominated for decades, with the exceptions of substantial increases in working at home and big losses in car pooling. Though even in these modes, the changes are slight in view of the dominance of single-occupant commuting, as Figure 1 indicates. This is not surprising, commuters who drive alone reach virtually anywhere in the metropolitan area and nearly always at a faster speed than any other method of commuting, save working at home.


Table 1
Transit Work Trip Market Share: 2014
Major Metropolitan Areas (53 over 1,000,000 Population)
MARKET SHARE       
MSADrive AloneCar PoolTransitBicycleWalkOtherWork at Home
Atlanta, GA77.6%10.3%3.1%0.2%1.4%1.4%6.2%
Austin, TX76.6%10.1%2.5%0.7%1.7%1.5%6.9%
Baltimore, MD77.2%8.2%6.6%0.3%2.6%1.1%4.0%
Birmingham, AL85.2%9.1%0.5%0.2%1.1%1.1%2.9%
Boston, MA-NH67.6%6.8%12.9%1.0%5.3%1.2%5.1%
Buffalo, NY82.3%7.7%3.0%0.4%2.9%0.9%2.9%
Charlotte, NC-SC81.0%9.4%1.9%0.2%1.4%1.1%5.1%
Chicago, IL-IN-WI70.9%7.7%11.9%0.7%3.2%1.2%4.5%
Cincinnati, OH-KY-IN82.8%7.9%2.1%0.3%2.0%0.8%4.1%
Cleveland, OH82.3%6.8%3.2%0.3%2.6%0.9%3.9%
Columbus, OH83.0%7.7%1.8%0.5%2.1%0.7%4.4%
Dallas-Fort Worth, TX80.8%9.9%1.6%0.2%1.2%1.7%4.6%
Denver, CO76.3%8.8%4.5%0.9%2.0%0.8%6.6%
Detroit,  MI84.0%9.0%1.6%0.3%1.3%0.8%3.1%
Grand Rapids, MI81.6%8.9%1.7%0.3%2.2%1.4%4.0%
Hartford, CT81.4%7.8%2.7%0.2%2.6%1.1%4.2%
Houston, TX80.3%10.7%2.4%0.3%1.3%1.6%3.4%
Indianapolis. IN84.2%8.5%1.2%0.3%1.3%0.7%3.8%
Jacksonville, FL80.4%9.7%1.2%0.6%1.2%1.7%5.2%
Kansas City, MO-KS83.4%8.5%1.0%0.2%1.2%1.0%4.7%
Las Vegas, NV77.6%10.2%4.8%0.5%1.6%2.3%3.1%
Los Angeles, CA74.6%9.7%5.8%1.0%2.5%1.3%5.1%
Louisville, KY-IN81.8%9.5%2.0%0.3%1.7%1.0%3.7%
Memphis, TN-MS-AR84.9%8.6%1.0%0.1%1.1%1.7%2.6%
Miami, FL78.7%8.9%3.7%0.6%1.7%1.4%5.0%
Milwaukee,WI80.6%8.4%3.5%0.5%2.6%0.8%3.6%
Minneapolis-St. Paul, MN-WI77.3%8.6%4.8%1.0%2.4%0.9%4.9%
Nashville, TN81.7%9.8%1.3%0.2%1.6%0.8%4.6%
New Orleans. LA79.2%9.7%3.1%1.3%2.3%1.5%2.9%
New York, NY-NJ-PA50.2%6.4%31.1%0.6%6.0%1.5%4.2%
Oklahoma City, OK82.8%10.1%0.4%0.4%1.5%1.1%3.7%
Orlando, FL79.8%9.9%2.0%0.6%0.9%1.2%5.6%
Philadelphia, PA-NJ-DE-MD73.0%7.8%9.7%0.6%3.7%0.8%4.3%
Phoenix, AZ77.0%10.5%2.1%0.9%1.5%1.9%6.1%
Pittsburgh, PA77.5%8.1%5.6%0.4%3.4%0.8%4.1%
Portland, OR-WA70.0%10.2%6.5%2.6%3.3%1.0%6.4%
Providence, RI-MA81.1%7.9%2.8%0.5%3.4%0.9%3.5%
Raleigh, NC80.0%9.0%1.0%0.2%1.3%1.1%7.3%
Richmond, VA81.8%9.1%1.7%0.4%1.6%1.2%4.2%
Riverside-San Bernardino, CA77.4%13.3%1.6%0.3%1.7%1.0%4.7%
Rochester, NY82.5%6.9%2.5%0.7%3.1%0.7%3.7%
Sacramento, CA76.4%10.2%2.7%1.8%2.0%1.3%5.5%
Salt Lake City, UT74.9%12.2%3.8%0.8%2.1%0.8%5.3%
San Antonio, TX80.0%10.8%2.1%0.2%1.7%0.9%4.3%
San Diego, CA76.0%8.6%2.7%0.8%2.9%1.4%7.5%
San Francisco-Oakland, CA59.2%9.4%16.7%2.2%4.7%1.6%6.2%
San Jose, CA76.2%10.4%4.0%1.6%1.7%1.2%4.8%
Seattle, WA69.0%9.8%9.6%1.2%3.6%1.1%5.7%
St. Louis,, MO-IL82.7%7.3%2.9%0.3%1.8%0.8%4.1%
Tampa-St. Petersburg, FL81.1%7.4%1.5%0.9%1.5%1.7%5.9%
Virginia Beach-Norfolk, VA-NC82.4%8.2%1.6%0.5%3.0%1.2%3.1%
Tucson, AZ77.0%9.1%2.9%2.1%2.5%2.0%4.5%
Washington, DC-VA-MD-WV66.1%9.7%14.3%0.8%3.1%1.0%5.1%
Major Metropolitan Areas73.6%8.8%8.1%0.7%2.8%1.2%4.7%
Outside Major Metropolitan Areas80.4%9.8%1.2%0.5%2.7%1.2%4.1%
United States76.5%9.2%5.2%0.6%2.7%1.2%4.5%
From American Community Survey: 2014 (1 Year)


Table 2
Transit Work Trip Market Share: 2010 (2008-2012 ACS)
Major Metropolitan Areas (53 over 1,000,000 Population)
MARKET SHARE       
MSADrive AloneCar PoolTransitBicycleWalkOtherWork at Home
Atlanta, GA77.6%10.7%3.2%0.2%1.3%1.4%5.6%
Austin, TX75.0%11.3%2.6%0.8%1.8%1.9%6.6%
Baltimore, MD76.3%9.7%6.3%0.3%2.7%0.9%3.9%
Birmingham, AL84.0%10.6%0.7%0.1%1.1%0.6%3.0%
Boston, MA-NH68.8%7.9%11.9%0.9%5.3%0.9%4.4%
Buffalo, NY81.8%8.1%3.5%0.4%3.0%0.9%2.4%
Charlotte, NC-SC80.5%10.4%1.8%0.1%1.4%0.9%4.9%
Chicago, IL-IN-WI70.9%8.8%11.3%0.6%3.1%1.1%4.2%
Cincinnati, OH-KY-IN82.6%8.7%2.2%0.2%2.1%0.7%3.6%
Cleveland, OH82.1%7.8%3.5%0.3%2.1%0.8%3.4%
Columbus, OH82.6%8.2%1.6%0.4%2.1%0.8%4.2%
Dallas-Fort Worth, TX80.9%10.5%1.5%0.2%1.2%1.3%4.5%
Denver, CO75.7%9.5%4.5%0.9%2.1%1.2%6.0%
Detroit,  MI84.2%8.7%1.6%0.2%1.4%0.8%3.1%
Grand Rapids, MI82.8%8.9%1.2%0.5%1.9%0.7%3.9%
Hartford, CT81.0%8.2%3.1%0.2%2.7%1.0%3.8%
Houston, TX79.2%11.7%2.4%0.3%1.4%1.6%3.4%
Indianapolis. IN83.6%9.0%1.1%0.3%1.7%0.8%3.6%
Jacksonville, FL81.1%9.9%1.3%0.6%1.4%1.3%4.4%
Kansas City, MO-KS82.9%9.2%1.2%0.2%1.3%1.0%4.1%
Las Vegas, NV78.5%11.1%3.7%0.4%1.8%1.5%3.0%
Los Angeles, CA73.6%10.8%6.1%0.9%2.7%1.2%4.9%
Louisville, KY-IN82.9%9.3%2.1%0.3%1.7%0.8%2.9%
Memphis, TN-MS-AR82.8%10.7%1.3%0.1%1.3%1.0%2.8%
Miami, FL78.2%9.8%3.7%0.6%1.8%1.4%4.5%
Milwaukee,WI79.9%9.2%3.6%0.5%2.8%0.7%3.2%
Minneapolis-St. Paul, MN-WI78.1%8.6%4.6%0.9%2.3%0.8%4.7%
Nashville, TN81.5%10.4%1.1%0.2%1.2%0.9%4.6%
New Orleans. LA79.0%10.9%2.6%0.8%2.4%1.6%2.6%
New York, NY-NJ-PA51.0%7.1%29.9%0.5%6.1%1.6%3.9%
Oklahoma City, OK82.9%10.4%0.5%0.3%1.6%1.1%3.3%
Orlando, FL81.1%9.3%1.9%0.5%1.1%1.7%4.5%
Philadelphia, PA-NJ-DE-MD73.4%8.2%9.4%0.6%3.7%0.8%3.8%
Phoenix, AZ76.4%11.9%2.1%0.8%1.6%1.6%5.6%
Pittsburgh, PA76.9%9.3%5.7%0.2%3.6%0.9%3.5%
Portland, OR-WA71.2%9.7%6.1%2.2%3.5%1.0%6.3%
Providence, RI-MA80.8%8.8%2.7%0.3%3.2%0.9%3.3%
Raleigh, NC80.6%9.6%1.0%0.3%1.4%1.2%5.9%
Richmond, VA81.3%9.6%2.0%0.4%1.4%0.8%4.5%
Riverside-San Bernardino, CA76.2%14.4%1.6%0.4%1.8%1.1%4.4%
Rochester, NY81.4%8.4%1.9%0.5%3.6%0.7%3.5%
Sacramento, CA75.1%11.6%2.7%1.8%2.0%1.2%5.6%
Salt Lake City, UT75.9%12.0%3.5%0.8%2.3%1.2%4.3%
San Antonio, TX79.1%11.5%2.2%0.1%1.9%1.2%3.9%
San Diego, CA75.9%10.2%3.1%0.7%2.7%1.1%6.3%
San Francisco-Oakland, CA61.5%10.3%14.7%1.7%4.3%1.4%6.0%
San Jose, CA76.5%10.4%3.2%1.7%2.1%1.4%4.7%
Seattle, WA69.7%11.0%8.3%1.0%3.6%1.1%5.3%
St. Louis,, MO-IL82.6%8.4%2.5%0.3%1.7%0.8%3.7%
Tampa-St. Petersburg, FL80.3%9.5%1.4%0.7%1.6%1.4%5.2%
Virginia Beach-Norfolk, VA-NC80.6%9.0%1.8%0.4%2.6%1.1%4.4%
Tucson, AZ76.5%10.3%2.4%1.5%2.5%2.0%4.8%
Washington, DC-VA-MD-WV66.0%10.6%14.0%0.6%3.2%0.9%4.7%
Major Metropolitan Areas73.5%9.6%7.9%0.6%2.8%1.2%4.4%
Outside Major Metropolitan Areas80.8%9.8%0.9%0.5%2.7%1.2%4.2%
United States76.6%9.7%4.9%0.5%2.8%1.2%4.3%
From American Community Survey:2008-2012


Wendell Cox is Chair, Housing Affordability and Municipal Policy for the Frontier Centre for Public Policy (Canada), is a Senior Fellow of the Center for Opportunity Urbanism (US), a member of the Board of Advisors of the Center for Demographics and Policy at Chapman University (California) and principal of Demographia, an international public policy and demographics firm.He is co-author of the "Demographia International Housing Affordability Survey" and author of "Demographia World Urban Areas" and "War on the Dream: How Anti-Sprawl Policy Threatens the Quality of Life." He was appointed to three terms on the Los Angeles County Transportation Commission, where he served with the leading city and county leadership as the only non-elected member. He served as a visiting professor at the Conservatoire National des Arts et Metiers, a national university in Paris.

Photo: Harbor Freeway (I-110), Los Angeles (by author)


Tech Titans Want to be Masters of All Media We Survey

$
0
0

The rising tech oligarchy, having disrupted everything from hotels and taxis to banking, music and travel, is also taking over the content side of the media business. In the process, we might see the future decline of traditional media, including both news and entertainment, and a huge shift in media power away from both Hollywood and New York and toward the Bay Area and Seattle.

This shift is driven by several forces: the power of Internet-based communications, the massive amounts of money that have accumulated among the oligarchs and, perhaps most important, their growing interest in steering American politics in their preferred direction. In some cases, this is being accomplished by direct acquisition of existing media platforms, alliances with traditional firms and the subsidization of favored news outlets. But the real power of the emerging tech oligarchy lies in its control of the Internet itself, which is rapidly gaining preeminence in the flow of information.

This transition is being driven by the enormous concentration of wealth in a few hands, based mostly in metropolitan Seattle and Silicon Valley. In 2014, the media-tech sector accounted for five of the 10 wealthiest Americans. More important still, virtually all self-made billionaires under age 40 are techies. They are in a unique position to dominate discourse in America for decades to come.

In recent years, like Skynet in the “Terminator” series, the oligarchs have become increasingly aware of their latent power to shape both the news media and the political future. A prospectus for a lobbying group headed up by Mark Zuckerberg’s former Harvard roommate, suggests tech will become “one of the most powerful political forces.” The new group’s “tactical assets” include not only popularity and great wealth but the fact that “we control massive distribution channels, both as companies and individuals.”

Read the entire piece at The Orange County Register.

Joel Kotkin is executive editor of NewGeography.com and Roger Hobbs Distinguished Fellow in Urban Studies at Chapman University, and a member of the editorial board of the Orange County Register. He is also executive director of the Houston-based Center for Opportunity Urbanism. His newest book, The New Class Conflict is now available at Amazon and Telos Press. He is also author of The City: A Global History and The Next Hundred Million: America in 2050. He lives in Orange County, CA.

Facebook photo by BigStockPhoto.com.

The Detached iHome of the Future

$
0
0

Will new American housing growth continue to reflect old methods, or will the land development, home building, and consulting industry retool, re-educate, and collaborate to create a new era of more attractive, livable, efficient, and environmentally responsible growth at attainable prices?

Here is why it would be so significant to make a change: The US Department of Housing has determined that 620,000 new single family homes were completed in 2014, averaging 2,453 square feet on an 8,689 square foot average lot. The average price was $345,800, with a national total of $214.4 billion.

Those post-recession 620,000 homes have used up much of the existing empty suburban lots from the recession. Assume that 30 percent of a development is consumed by infrastructure, and that typical 8,689 square foot lot represents about 12,400 square foot of growth. That means we have newly-developed — or recently consumed — about 275 square miles of construction, using lot stock. In other words, now that the existing lots are consumed, future growth will annually consume more than 275 square miles of land.

That development, at $214 billion dollars in home value, is the equivalent of a $650 iPhone 6s for every US resident. Unlike the iPhone that is assembled in a minute, though, a single family home is built by craftsmen over many months in a development that takes years to go through the approval and construction process.
An iPhone is a marvel of technology, representing billions in research and development, and requiring close communication and collaboration between professionals in engineering, materials, software, and manufacturing.

The design for the $345,800 home and its neighborhood progress at a snail’s pace. Both floor plans and site plans are rooted in the 1960s, with civil engineering standards from the 1950s handbook. The professionals involved in land development design and construction — surveyors, planners, civil engineers, and architects — are a most un-collaborative group, fostering this stagnation.

Yet today, innovations in both technology and methods can empower the consulting industry to create neighborhoods and housing that matches the progress of other industries, like those that are creating mobile phones, cars, and medicines. Savvy developers and home builders are beginning to break free, setting new trends by merging planning, architecture, and engineering.

Of those 620,000 homes, it’s likely that only a few custom built ones had a tight coordination between the room function, the wall and window locations, and the connection to the surrounding viewsheds.

When land is ‘subdivided,’ the streets, and afterwards the lot lines, are all set to regulatory minimums. This method ‘stretches’ the public street to create the greatest volume of street and the smallest area available for lots. The compression of space forces cookie-cutter, mundane growth. Architectural design was traditionally an afterthought to the subdividing process.

To develop alternative approaches, we used the ‘down-time’ during the recession to research and develop new geometric relationships between lot and home, as well as to develop better spatial analysis and design software to accomplish 'Architectural Blending' for the mass market single family home.

We saw how advancements in land planning have been made possible by merging engineering and surveying geometry with organic site layout methods. This combination has proven to significantly reduce infrastructure (street-utility length), while increasing average lot area. Redistributed space allows for more flexible designs.

The merging of interior and exterior spaces, ‘Architectural Blending,’ was first implemented in a design idea coined as ‘BayHomes.’ The term came from the bay-like shape of common open spaces that undulated between home fronts. In 1999, Professional Builder Magazine called BayHomes "New Urbanism with a View."

BayHomes are single family detached homes set within townhome zoning, thus, they are in association-maintained environments. They were first implemented in 1998 on The Greens of Hutchinson, Minnesota, offering production housing that coordinated living spaces within the home with adjacent spaces and views, and for the first time merged planning and architecture at attainable prices. Since The Greens, there have been thousands of BayHome designs that have refined the method.

BayHomes are positioned to provide a panoramic view from the focal point, usually the kitchen, to common spaces adjacent to the home front. BayHomes hide the garages, which makes them ideal along arterial streets to create a ‘village-like’ appearance. By eliminating most of the public street right-of-ways, compared to traditional single family homes the BayHome can achieve duplex density with plenty of landscaped open space providing a lower density feel.

BayHomes serve a specific consumer who would have otherwise bought a duplex or townhome. The large scale housing market has been and will remain single family homes.

The next problem became: How to duplicate advantages of a BayHome in a single family home which must front a lot on a public street? The challenge to increase available space was solved through a design technique called coving. A rectangular lot is simple: You have few options — no side views and limited front and rear yards space — whereas ‘coving’ produces a larger, non-rectangular lot, yet still maintains the density of the rectangle.

When we looked at some traditional designs that would fit on higher density narrow lots, we saw typical floor layouts where — for example — 8.1 percent of the home was consumed by the hallway. If the home cost $200,000, then $16,000 was the cost of the hall. By merging planning and architecture, new models are more efficient within higher density single family-home neighborhoods, reducing or eliminating these common forms of waste within and around the home.

With a new era of design we can solve problems like these, as well as critical issues. The problem with increased density is the compaction of space, sacrificing livability, efficiency, curb appeal, views, and environment. Some may argue that the environment is not harmed by increased density, ignoring that while the lot and home size is reduced, streets, walks, garages, and other infrastructure elements remain the same size as larger lots. Thus, the ratio of housing footprint to paved areas serving the home increases, and ‘organic’ (landscaped) space is sacrificed.

As the home buying public becomes aware that it's possible to have a home of significantly higher value than the typical monotonous design rooted in the 1960s, and that it can be located in a neighborhood of greater character, they will demand change with their pocketbooks. They will be able to look at the streetscapes of nearby cookie cutter subdivisions, and see that neighborhoods of the same density can have a dramatic increase in function, curb appeal, views, safety, efficiency, connectivity, and perception of space. The differences will be as dramatic as comparing a dial phone of the 1960s to the iPhone of today.

Rick Harrison is President of Rick Harrison Site Design Studio and Neighborhood Innovations, LLC. He is author of Prefurbia: Reinventing The Suburbs From Disdainable To Sustainable and creator of Performance Planning System. His websites are rhsdplanning.com and performanceplanningsystem.com.

Aerial view of Transoma, a community planned on the principles of coving, from the author.

How Portland Is a Lot Like Texas

$
0
0

One theme I always hammer is that you have to look at proposed policy solutions in the context of the area where you want to apply them.

A great example of this is Portland’s Urban Growth Boundary (UGB). The UGB, a policy that limits suburban development outside of a line drawn around the Portland region, is widely admired and perhaps even seen a type of holy grail policy in terms of preventing sprawl.

Obviously restricting development outside the UGB raised demand for land inside of it and thus housing prices. Portland’s median home price multiple – that is, the median home price divided by the median household income – is 4.8. The average household in Portland would need to spend 4.8 times its annual income to buy a house there.  This compares with 2.9 in Kansas City, 3.0 in Columbus, and 3.9 in Austin.

So Portland is less affordable than many similar sized housing markets around the US.

But despite this, Portland remains the most affordable major West Coast metro area.  That’s because housing prices in other major coastal cities are even higher, including Seattle (5.2), Los Angeles (8.0), San Diego (8.3), the Bay Area (9.2), and Vancouver (10.6).

So even while its home prices have risen, Portland remains the cheapest major city to live apart from Sacramento (4.7).  That is, even with the UGB Portland has a big cost advantage over its regional competition. In short, it’s cheap.

In this way, the attraction of Portland is a lot like Texas. Its draw is more a cost arbitrage play for people leaving San Francisco than an upgrade to superior urbanism from the interior. As it happens, California refugees make up the bulk of the net migrants into Portland.

The Texas comparison is relevant on the tax front too. Portland is one of the rare places you have the potential for double border tax arbitrage. Washington state has no income tax and Oregon has no sales tax. While only a limited number of people can take advantage of both (you have to both live and work in Washington to avoid the income tax), being able to zero out one or more major tax categories is a win.

This is not to say that Portland is a lousy place to live. It’s fantastic as near as I can tell. The point is that Portland was able to put in place policies to create good enough urbanism to lure a certain number of San Franciscans without compromising its competitive position because it was in a high cost neighborhood.

The story would be very different for a place like Oklahoma City or Columbus. These cities are in low cost regions, and if they undertook policies that raised their housing prices, they’d rapidly find themselves the most expensive market in their area.

Cloning Portland’s UGB is simply not a viable policy for most interior cities, even if they had the political alignment to make it happen.

There are many policies that can be broadly implemented across cities. The general principle is to first understand why a policy worked in the original context, then ask whether it is applicable to the target context, and if so how to implement it most successfully.

Aaron M. Renn is a senior fellow at the Manhattan Institute and a Contributing Editor at City Journal. He writes at The Urbanophile, where this piece originally appeared.

Jerry Brown’s Insufferable Green Piety

$
0
0

At the site of real and immediate tragedy, an old man comes, wielding not a sword to protect civilization from ghastly present threats but to preach the sanctity of California’s green religion. The Paris Climate Change Conference offers a moment of triumph for the 77-year-old Jerry Brown, the apogee of his odd public odyssey.

Jerry Brown has always been essentially two people—one the calculating, Machiavellian politician, the other the dour former Jesuit who publically dismisses worldly pleasures for austere dogma. Like a modern-day Torquemada, he is warning the masses that if they fail to adhere in all ways of the new faith or face, as he suggested recently humanity’s “extinction.”

Brown is important because many other green cheerleaders like Al Gore grate on the public, in part because of rampant greed and a penchant for unsupportablepredictions. In contrast, Brown presents, with some justification, the very model of enlightened leadership and smart management, certainly in comparison with the ideologues and public employee pawns who dominate his party, and the blatant wealthy hypocrites who rule the green universe.

Increasingly, Brown has become the patron saint of climate change, while at the same time exposing the effort’s flaws and contradictions most clearly. Railing against the satanic greenhouse gases, Brown, one supposes unwittingly, seems unconcerned he is waging what amounts to a war against the state’s own middle and working classes. His intolerance of dissent—albeit less extreme than some—reflects the current trajectory of environmentalism, which increasingly seeks to silence and even criminalize those who dispute their analyses and prescriptions.

Like the Spanish father of the Inquisition, Brown has it in for anyone who dissents from his “God is not mocked,” as he suggested recently, attacking critics of his policies as “falsifying the scientific record,” something climate change advocates have also been caught doing on more than one occasion. Brown dismisses allclimate skeptics, even those who admit some carbon-caused warming,  as “a well funded cult.”

Like a religious adept, Brown shows his need to link everything to one sin—greenhouse gas emissions—to explain virtually everything from wildfires to the current drought on climate change, although with little support from scientists who study such things. As was common in the worst aspects of the medieval Catholic Church, one increasingly cannot dissent in any way from revealed doctrine without being essentially evil.

Between Image and Reality

In Paris, Brown hopes to present himself as the great green success story, leader of an economy that has thrived despite some of the world’s most draconian climate change measures. And he has something of a case since California, after suffering greatly in the recession, has finally recovered its lost jobs and has bolstered its critical role as the dominant technology power on the planet.

For many progressives, California represents “a beacon of hope.” Its “comeback” has been dutifully noted and applauded by left-wing economist Paul Krugman, and Michael Kinsley and the Washington Post’s Chris Cilizza have even suggested that Brown should run for president—at the ripe age of 77.

These fans miss a big part of the reality. Outsiders think of California as a prosperous place that mints billionaires, but overall the state’s economic recovery has done little for many, if not most, state residents. Even with the boom in Silicon Valley, roughly one in three Californians live check to check, the state hashigher rate of poverty than Mississippi, as well as one-third of the nation’s welfare recipients. Among the emerging Latino majority, a prime Brown constituency, the state’s cost-adjusted poverty rate is more than 33 percent, compared to just 22.7 percent in Texas, a state often derided as unenlightened and cruel.

During this “boom,” most California blue-collar workers in farming, fishing, and forestry have experienced actual average wage decreases. Employment in fields such as construction and manufacturing remain well below their 2007 levels. Much of this has to do with environmental regulation, which has raised energy costs almost twice those of nearby competitors and also helped raise housing prices to an unsustainable level.

Once the beacon of opportunity, California is becoming a graveyard of middle-class aspiration, particularly for the young. In a recent survey of states where “the middle class is dying,” based on earning trajectories for middle-income cohorts, Business Insider ranked California first, with shrinking middle-class earnings and the third-highest proportion of wealth concentrated in the top 20 percent.

Most hurt, though, are the poor. California is home to a remarkable 77 of the country’s  297 most “economically challenged,” cities based on levels of poverty and employment, according to a recent USC study; altogether these cities have a population of more than 12 million. Some stressed cities exist cheek-to-jowl with the state’s uber-rich—Oakland, Los Angeles, as well as Coachella, near Palm Springs. Most others are in the poorer, more heavily Latino interior, places like Riverside, Stockton, and Vallejo. Journalists who come to California to praise the governor may think it’s still “California Dreamin’” but for all too many, particularly away from the coast (PDF), it’s more like The Grapes of Wrath.

The Making of a Modern Medievalist

Of course, there’s a long history of such bifurcated society, where people tend to stay in their class and the poor depend largely on handouts from their spiritual “betters.” It’s called feudalism.

In many ways, Jerry Brown is a perfect medievalist—the son of a self-made man, a person who largely inherited his position. Without the legacy of his father, Edmund G. “Pat” Brown, a natural politician and arguably the greatest governor in the state’s history, it’s unlikely the shy, awkward, although unquestionably bright kid would have been elected the first time in his mid-thirties.

Brown came to politics bathed not in the practicum of politics but in theology. As a seminarian, he imbibed the Jesuitical approach—highly intellectualized, hierarchical, and accepting of class distinctions. Although he occasionally dabbled in populist politics, particularly in his presidential runs, Brown’s achievement has been to undermine not just the Reaganite regime but also the pro-growth progressive structure left behind by his father and earlier California governors.

Brown’s acuity has often been on target, as, for example, when he took on the encrusted bureaucracy at the University of California and inside state government. But Brown’s maverick approach also revealed a streak that reflected a harshness toward those who were weaker, including the poor. In his first term, Brown’s callous treatment of the mentally ill left 30,000 mental patients in worsening conditions in inadequate nursing facilities. As the Los Angeles director of mental health told me at the time, under Reagan there was “genuine concern for people,” while under Brown he didn’t “see much concern for people at all.”

He came into office, recalled top aide Tom Quinn, “questioning the values of the Democratic Party” and rejecting the “build, build, build thing” of his father. Like the 15th century Florentine Catholic monk Girolamo Savonarola, he came to Sacramento, in part, to rid it of suberbia and luxuria. Most important, he did not restart the infrastructure building, most portentously for water storage, that marked his father’s regime; the severity of the drought and the awful condition of the state’s roads are, to some extent, his legacy.

Brown’s initial politics were built around three principles—“serve the people, save the earth, and explore the universe.” Some, such as farmworkers, owe him much. But the biggest winners under Brown were the well-financed green lobby and public employee unions have become so powerful that that replaced the coalition of developers, farmers, and industrialists who had accepted, and often bankrolled, his father.

In recent years, Brown, after being praised for his moderation in his first four years as second time governor, has become more “crotchety,” according to the Los Angeles Times’ George Skelton. He has insisted on funding his favorite project, the much maligned “bullet train,” even though many on the left, including Mother Jones, have identified it not as an environmental benefit but a colossal waste of time and money.

In contrast, on most everything else, Brown leans toward austerity—he even reveals a fondness for the ration cards used during World War II. Yet surprisingly, Brown, the supposed ascetic, appears increasingly comfortable with his own wealth. He has speculated freely in Bay Area real estate and stocks, essentially creating a multimillion-dollar estate that, as the San Jose Mercury put it kindly, “belie [the] monastic image.” Recently he shocked his own green supporters by having a state agency perform a detailed analysis of the oil, gas, and mineralresources on his family’s 2,700-acre Northern California ranch, a service not readily available to other mere mortals.

As for the poor left behind in California’s recovery, this, Brown insists, is not due to policy failure but because the state is an irresistible “magnet” for the masses.

The High Priest of the Oligarchy

Early on Brown cleverly cultivated the emerging tech oligarchy in Silicon Valley. This has created a new class of major donors who, along with the unions and Hollywood, have financed his political re-ascendency.

The oligarchs seem kindred souls for Brown, with little patience for less advanced beings. He also knew that their success has allowed him to show economic gains without having to concede to the regulatory concerns of more traditional industries. In the new Silicon Valley, most of the “dirty work” is shoved off to other more benighted states, or abroad; regulatory overreach poses only limited problems. For his part, Brown sees the oligarchs as the state’s economic foundation. “We’ve got a few problems, we have lots of little burdens and regulations and taxes,” he said recently, “but smart people figure out how to make it.”

Brown’s Bay Area connection is helped by the fact that the venture and tech firm oligarchy often share his climate concerns. He has further tightened this alliance by lavishing enormous subsidies for often dodgy, expensive renewable energy schemes backed by companies such as Google and by many among the venture capitalist elite.

Ironically, none of Brown’s moves will, by themselves, have any demonstrable impact on climate. California is too small, too temperate, and, at this stage, too de-industrialized to make a difference. Indeed, as one recent study found, California could literally disappear tomorrow with virtually no effect on the climate. Perhaps less recognized, its efforts to reduce emissions have accounted for naught, since so much industry and so many people—some 2 million in the last decade—have taken their carbon footprint elsewhere, usually to places where climate and less stringent regulation allow for greater emissions. Some states, rather than embrace Brown’s formula and seeing an opportunity to score, have detached themselves from renewable mandates entirely.

And now the world

So why the dogged insistence on draconian policies? It’s very much for the same reason people take priestly vows, or why penitents whip themselves: moral posturing before the rest of the world and, for politicians, the prospect of attracting the adoring masses (or at least the media). President Obama looks to California policies for his future climate policies. On this issue Brown is the rock star, and will be in Paris, cool again after all these years.

Brown’s green religion now has a most powerful ally, the leading Jesuit on the planet, Pope Francis. This alliance offers something of a religious redemption for Brown, a former seminarian who has rejected most traditional Catholic teachings on such things as gay marriage, abortion, population control, and, most recently,euthanasia.

In Paris, Brown’s claims of economic infallibility should be questioned particularly among leaders of developing countries. Some 3 billion people suffer from pollution created by burning wood, coal, or dung. Some 4.3 million die annually from the resultant indoor pollution compared to 250,000 deaths that might be assigned to climate change by 2050. For many, fossil fuels represent a lifesaver today. To offer these people expensive and inefficient solar panels instead of basic necessities, as economist Bjorn Lonborg has suggested, represents nothing more than “inexcusable self-indulgence.”

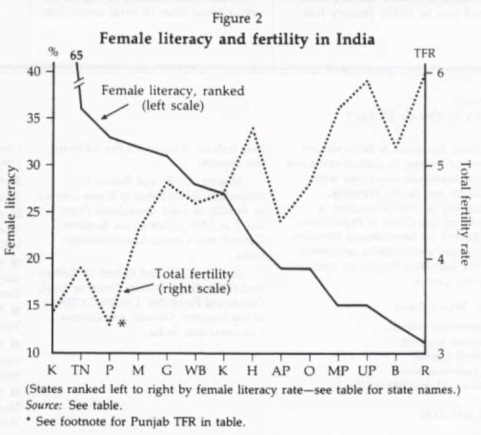
Some developing countries are making their intentions clear. Indian Prime Minister Narendra Modi has thrown out Greenpeace for agitating against coal mines in his energy-starved country. China, whose world-leading emissions are now almost twice those of the U.S., recently admitted to burning 17 percent more coal than previously estimated. No doubt they will happily wink and nod their assent to a vague green agreement while Western countries, following Brown, Obama, and the Pope, adopt ever stricter regulations. By the time we get to 2030, when China might begin reducing emissions, the West itself may be so weakenedeconomically that it won’t be able to question anything Beijing wants to do anyway.

Russia and virtually the entire Middle East also are not likely to give up on fossil fuels, which is the only thing that makes the world pay attention to them. Rather than use our energy boom to create leverage against these autocracies, Brown and his confederates are pushing policies that consequently make them more influential, also allowing them to finance and arm terrorists, whether ISIS, al Qaeda, or theocratic Iran and their satraps.

A decade from now, the futility and wasted economic potential of this posturing will be clear. What could have been accomplished, at least initially, by replacing coal with natural gas and the careful expansion of nuclear power, will instead lead to a lower quality of life for all but the rich in the West, with perhaps worse ill-effects elsewhere. But by then Brown will likely have faded from the scene, although he may manage to get his wife, former Gap attorney Ann Gust Brown, elected to succeed him.

What will be Brown’s main legacy? A more environmentally pure but severely bifurcated California and, if he and his compatriots have their way, an accelerating decline of the Western world and arguably the stagnation of the entire world economy. But Brown and his crony capitalist and priestly friends will be happy. They may have messed up the world, but they will always have Paris.

Photo: Troy Holden

White House Economist Links Land Use Regulations: Housing Affordability and Inequality

$
0
0

There is a growing body of research on the consequences of excessive land use regulation. The connection between excessive land use regulation and losses in housing affordability, has been linked to  the doubling or tripling of house prices relative to incomes in places as diverse as Hong Kong, the United States, Canada, Australia, New Zealand and the United Kingdom.

More recently, research has identified serious consequences to national economies, beyond the fact that many households cannot afford to live, much less buy a home in the metropolitan areas with excessive land use regulation. Because residents such area have less income to spend due to the higher house costs, job creation and economic growth are hobbled. Rising inequality is also being cited as a consequence of excessive land use regulation.

The White House Economic Chairman’s Address

The issue has caught the attention of the White House (See: “Why White House Economists Worry about Land Use Regulations”). The Chairman of the White House Council of Economic Advisers, Jason Furman delivered an address on the subject to a conference hosted by the Urban Institute and Core Logic in Washington on November 20 (See: Barriers to Shared Growth: The Case of Land Use Regulation and Economic Rents).

Furman starts with the fundamentals: “Basic economic theory predicts—and many empirical studies confirm—that housing markets in which supply cannot keep up with demand will see housing prices rise.”

Furman cites research by Christopher Mayer of the University of Pennsylvania and C. Tsuriel Somerville of the University of British Columbia who “conclude that land use regulation and levels of new housing construction are inversely correlated, with the ability of housing supply to expand to meet greater demand being much lower in the most heavily regulated metro areas.” (see Note 1.)

The Association with Deteriorating Housing Affordability

Furman told the conference that: “While land use regulations sometimes serve reasonable and legitimate purposes, they can also give extranormal returns to entrenched interests at the expense of everyone else.” He suggested that: “There can be compelling environmental reasons in some localities to limit high-density or multi-use development. Similarly, health and safety concerns—such as an area’s air traffic patterns, viability of its water supply, or its geologic stability—may merit height and lot size restrictions.”

But, according to Furman, excessive land use regulation can severely impact the housing market:

"…zoning regulations and other local barriers to housing development allow a small number of individuals to capture the economic benefits of living in a community, thus limiting diversity and mobility. The artificial upward pressure that zoning places on house prices—primarily by functioning as a supply constraint—also may undermine the market forces that would otherwise determine how much housing to build, where to build, and what type to build, leading to a mismatch between the types of housing that households want, what they can afford, and what is available to buy or rent."

In effect, excessive land use restrictions feed upon themselves to exacerbate the losses in housing affordability (Note 2):

"… some individuals are priced out of the market entirely, and homes in highly zoned areas also become even more attractive to wealthy buyers. Thus, in addition to constraining supply, zoning shifts demand outward, exerting further upward pressure on prices…"

Broader Consequences: Rising Inequality and Labor Mobility Stagnation

But the impacts go well beyond housing affordability losses. Furman expresses concern that the housing affordability losses in some cities make it difficult for households to move from elsewhere to take advantage of higher paying positions. He notes the impact of artificial constraints on housing supply as hindering mobility and suggesting that:

"Zoning and other land use regulations, by restricting the supply of housing and so increasing its cost, may make it difficult for individuals to move to areas with better-paying jobs and higher-quality schools. Barriers to geographic mobility reduce the productive use of our resources and entrench economic inequality."

He elaborated on this point:

"Reduced labor mobility may be a contributing factor to both increased inequality and lower productivity growth in the United States. This reduction in mobility has manifested itself in a wide variety of ways, including the fact that individuals are less likely to change jobs, to switch occupations or industries, or to move within States or across State lines. Businesses are creating and destroying jobs at a lower rate and fewer new businesses are being formed, both of which could be causes or consequences of a decline in labor mobility."

Part of the key to improving economic growth is greater job mobility.

"…increasing mobility 'is going to be an important part of the solution of increasing incomes and increasing incomes across generations,'"

The greater restrictions imposed on mobility by excessive land use regulation particularly injures middle income and lower income households.

"But when zoning restricts the supply of housing and renders housing more expensive—even relative to the higher wages in the high productivity cities—then workers are less able to move, particularly those who are low income to begin with and who would benefit most from moving. As a result, existing income inequality across cities remains entrenched and may even be exacerbated, while productivity does not grow as fast it normally would."

Economic Growth and Distributional Consequences of Excessive Regulation

Mr. Furman cited ground-breaking research on the economic and distributional effects of excessive land use regulation. This includes:

Research by Raven Saks of the Federal Reserve Board, which “shows that an increase in labor demand in high regulation cities leads to a smaller increase in the housing stock, greater house price appreciation, and lower employment growth than in low regulation cities.”

Research by Peter Ganong and Daniel Shoag of Harvard University finding that the historic convergence of incomes between higher and lower income areas of the US has declined substantially. Furman said “One story for this lack of any convergence is that only high-income workers can afford to relocate to the high-productivity cities that have tight land use regulations, which reinforces existing inequality.”

Research by Chang-Tai Hseih of the University of Illinois, Chicago and Enrico Moretti of the University of California, Berkeley estimating a nearly 10 percent loss in national output from the reduced job mobility (Furman characterizes this modeled estimate as “tentative.”) Furman reported that the researchers attributed most of this loss to restrictions on housing supply.

Furman also expresses concern about intergenerational equity losses and the fact that over the past four decades land use regulations, along with larger income gains for the more affluent: “have worked toward pricing middle- and lower-income families out of the communities with the best schools.” In fact, in the major metropolitan areas, excessive land use regulations started four decades ago in California and Oregon, but with effects generally similar to what Furman suggests.

Toward Relief for Future Generations

The answer, according to Furman is better policies:

"Thus, within the broader context of declining migration rates, divergence across labor markets, and worsening housing affordability, pursuing more prudent zoning policies could also reduce inequality that is entrenched across generations."

Furman also notes the importance of studying restrictions, such as excessive land regulation because such an effort can: “…make the economy more competitive by artificial barriers, thus improving both the distribution of income and the productive capacity of the economy.”

Such improvements are genuine concerns. A year ago, the G-20 group of nations, meeting in Brisbane, adopted a communiqué declaring “better living standards” as their highest priority. They also committed to eradicating poverty. However, since last year, economic growth has been disappointing, as the post-Great Recession recovery appears stalled in second gear, at best. Yet despite the weak economy, housing affordability has deteriorated even more sharply in G-20 member states Australia, Canada, China and the United Kingdom.

As the US research indicates, real household income growth can be severely hobbled if much or all of the modestly rising incomes is consumed by extraordinarily rising housing costs. This also does nothing to reduce, much less eradicate poverty. Governments from Sacramento and Olympia to Sydney and London should strive to improve the situation by reforming counterproductive and economically destructive land use regulations.

Note 1: The academic references in this article are detailed in longer discussions in our new reports, A Question of Values: Middle-Income Housing Affordability and Urban Containment Policy, and Putting People First: An Alternative Perspective with an Evaluation of the NCE Cities “Trillion Dollar” Report.

Note 2: In a footnote to the speech transcript, Furman notes that housing housing affordability requires comparison to incomes rather than simple house price comparisons: “Yet, affordability measures are relative to wages in an area not levels of house prices across cities.” This required nexus to income is not always evident in research on housing affordability.

Wendell Cox is Chair, Housing Affordability and Municipal Policy for the Frontier Centre for Public Policy (Canada), is a Senior Fellow of the Center for Opportunity Urbanism (US), a member of the Board of Advisors of the Center for Demographics and Policy at Chapman University (California) and principal of Demographia, an international public policy and demographics firm.He is co-author of the "Demographia International Housing Affordability Survey" and author of "Demographia World Urban Areas" and "War on the Dream: How Anti-Sprawl Policy Threatens the Quality of Life." He was appointed to three terms on the Los Angeles County Transportation Commission, where he served with the leading city and county leadership as the only non-elected member. He served as a visiting professor at the Conservatoire National des Arts et Metiers, a national university in Paris.

Photo: Entering Oregon sign

Fostering a Climate of Intolerance

$
0
0

The Paris Climate Conference, convening this week, takes place in the very place where, arguably, the most dangerous exemplar of hysteria, the Islamic jihadi movement, has left its bloody mark. Yet the think tank mavens, academics, corporate shills and endless processions of bureaucrats gather in the City of Light not to confront the immediate deadly threat, but to ramp up their own grisly scenarios and Draconian solutions.

Welcome to the age of hysteria, where friends and foes, and even those who blissfully talk past each other, whip themselves into an emotional frenzy that bears no discussion, debate or nuance. Rather than entering a technological age of reason, we seem to lurching towards a high-tech middle ages, where warring bands – greens, jihadis, libertarians, social conservatives, nationalists – immerse themselves not in intellectual competition but, inflating their own individual outrage. In this environment, exaggeration and hysteria are weapons of recruitment, while opposition is met with demeaning attacks, potential imprisonment and, at the worst, vicious acts of violence.

Establishment’s hysteria

Amid the recent carnage in Paris – not to mention bloodshed in the Sinai, Beirut and Mali – one would expect the world’s economic and political leadership to focus on that clear and present danger presented by Islamic extremism. But for years, much of the world’s power structure, particularly on the Left, has convinced itself that climate change represents the greatest challenge to mankind, rather than more immediate threats such as terrorism, poverty, deforestation and stagnating global economies.

For some, climate change has become the default cause of virtually everything, even the Syrian civil war. However much dry conditions may have contributed to the crisis, this assertion ignores the fact that people have been killing each other in the Middle East from time immemorial and that droughts have been a constant threat in that region, as here in California, since before biblical times.

Read the entire piece at The Orange County Register.

Joel Kotkin is executive editor of NewGeography.com and Roger Hobbs Distinguished Fellow in Urban Studies at Chapman University, and a member of the editorial board of the Orange County Register. He is also executive director of the Houston-based Center for Opportunity Urbanism. His newest book, The New Class Conflict is now available at Amazon and Telos Press. He is also author of The City: A Global History and The Next Hundred Million: America in 2050. He lives in Orange County, CA.

Photo: Entrance to Le Bourget UN climate Conference COP21 by Flickr user Takver

Deindustrialization, Depopulation, and the Refugee Crisis

$
0
0

The refugee crisis facing Western nations has begun to peak both demographically and politically.  The United Nations has reported that more than 6.5 million Syrians have fled to neighboring countries and Europe, and even nations that until recently welcomed refugees are frantically trying to change immigration policy or protect borders. In contrast, as migration has swelled the population in some places, in others, like the Rust Belt of the United States, depopulation undermines future economic development.  Some have begun to ask whether population trends can or should determine policy. The answer is yes.

To understand the significance of depopulation in the Rust Belt, imagine that a plague hit the Midwest and four million people had vanished. What would be the economic consequences for the region, its institutions and for individuals?  Deindustrialization has operated much like a plague, and just as with a plague, the long term social and economic costs are substantial. The region can’t “just get over it.”  Deindustrialization, and the depopulation associated with it, continues to be a drag on the region both economically and socially.

For example, in Youngstown, Ohio, steel mills began closing almost 40 years ago.  The city’s population is now around 62,000, a decline of more than 50 percent since the 1970s.  A community once known at the “City of Homes” now has more than 4000 vacant properties. Youngstown’s economic redevelopment program has largely failed. Attempts at economic redevelopment around prisons, fracking, 3-D printing and casinos have had only limited success, at best. They seem more like examples of the economics of desperation than serious efforts to revitalize the local economy. Appeals by business and government leaders to redefine this as a  “shrinking city” and exhortations for the community to exhibit “adaptive resilience” have proven shallow.  With little economic growth, such approaches feel too much like cruel optimism.

Youngstown mayor John McNally has said that his most important task is to stop the depopulation.  A city like Youngstown needs to stop the hemorrhaging and get an infusion of energy.  Would the city gain by encouraging refugees to move to Youngstown? Other communities have tried this approach, encouraging immigrants to move to depopulated areas and gaining new economic activity in the process. Weather-challenged Winnipeg, the capital of Manitoba, has taken advantage of the Manitoba Provincial Nominee Program, which “selects applicants who demonstrate they have the potential and the desire to immigrate and settle themselves and their families in the Canadian province of Manitoba.” Immigrants may apply through different categories such as General, Family Support, International Student, Employer, Strategic Initiative, or Business Immigration. An Economic Development study reports that Winnipeg’s metropolitan population has grown to 780,000, 100,000 higher than earlier projections. The population increase includes about 85,000 immigrants. Between 2009-2014, the local economy stabilized with unemployment below the national average and higher labor force participation and wage growth. In 2014, the city was touted by KPMG as the No. 1 low cost manufacturing location in aerospace, chemical, electronics assembly, pharmaceuticals and telecommunications equipment in North America.

On a smaller scale, some locations have also stemmed depopulation through the employment of existing ethnic enclaves as portal communities. Even in places like deindustrialized metro Detroit, depopulation was offset by an influx of Mexican and Middle Eastern immigrants into existing enclaves, transforming areas that were thought of as ghost towns. While traditional immigrant/refugee communities, like those in the Detroit Metro region were quite large, much of the new resettlement has been more geographically diverse and dispersed than it once was. For example, over 70,000 Bosnian refugees have resettled in St. Louis within the region over the last 20 years.

The New York Times reported in 2014 that new immigrants are more often to be found in midsize cities, like Dayton, Ohio than in New York, Chicago, and other large cities.   Like Youngstown, Dayton had lost over 40% of its population.  But city officials embraced immigration by establishing a “Welcoming Dayton” plan in 2011. The plan encouraged new immigrants and refugees to relocate in this Southwestern Ohio community and developed support groups to help newcomers adjust to their new community.  Most of the new growth in Dayton has been the result of the relocations and the city is in the process of accelerating the plan.

Another example is Utica, New York. In 2002, this deindustrialized city established the Mohawk Valley Resource Center for Refugees (MVRCR). Over 10,000 immigrants, largely from Bosnia and Vietnam, relocated to the Utica Area.  The 2012 U.S. census reports that 17.6 percent of Utica’s population was foreign born and 26.6 could speak a language other than English. NPR reported that the resettlement succeeded in part because Utica had low housing costs and many low-skilled jobs that were unfilled as result of depopulation. Refugees found jobs as meat cutters, greenhouse workers, and nursing home attendants. Some saved enough money to go into business themselves. They bought low-priced homes and rehabbed them, began to pay taxes, and purchased goods and services. No doubt, the refugees initially generated costs to taxpayers in terms of housing subsidies, Medicaid, Welfare, and education, but over time, repopulation stemmed depopulation and provided a glimmer of hope for economic revitalization.

Winnipeg, Dayton, and Utica are examples of small-scale attempts at repopulation using relatively small-scale government initiatives and ethnic portal communities. But the scale of today’s refugee crisis suggests the need for larger scale efforts, including, perhaps, a national program.  For example, the German government has developed an administrative formula that distributes refugees and asylum seekers among the 16 German states.  According to Thomas Greven, a political scientist at the Free University of Berlin, the distribution plan is based primarily on population and economic data, with the most refugees assigned to the depopulated parts of East Germany. The hope is that these new arrivals will develop their own micro-economies that will contribute to the revitalization of the region.

No doubt, the surge in refugees in Germany has caused resentment toward the policy and government in the short term.  Yet the German government has announced its willingness to accept 800,000 new refugees largely from the Syrian war, promised greater economic aid to state and local communities, and enlisted German companies to cope with the influx of refugees. While the German efforts reflect ethical and moral commitment, there is more to the story. The German population has been dropping for some time. Its population has become older and new birth rates are among the lowest in the world.  The German government and business leaders understand that “demographics are destiny,” and if it is to be a leader in economic growth it needs not only more people but also younger people – like the refugees.

Will any large immigration/refugee repopulation policy be considered in the US? It does not appear so given some recent attempts – by localities, states, and even the U.S. Congress -- to discourage immigration and refugees. But the Federal government has final authority over immigration policy matters. If the US were to follow Germany’s approach and offer relocation incentives, Rust Belt communities have the infrastructure and housing to accommodate many refugees. In turn, the new immigrants could establish microeconomic communities, compliment established markets, invest earnings and consume in the local economy and become a source for new tax revenue.

No doubt, this will be a political challenge given the current zeitgeist. But such a policy would be moral and ethical and in the best traditions of America. It could also help boost the economies of cities that are still struggling to recover from deindustrialization.  One thing that is for certain, if St. Louis can resettle 70,000 Bosnians in a15 year period, the US can certainly accommodate more than the 10,000 Syrian refugees currently slated for resettlement, especially in the deindustrialized and depopulated in the Rust Belt.

John Russo is a visiting fellow at Kalmanovitz Initiative for Labor and Working Poor at Georgetown University and at the Metropolitan Institute at Virginia Tech. He is the co-author with Sherry Linkon of Steeltown U.S.A.: Work and Memory in Youngstown (8th printing).


How Many People Will Live in Africa in 2050 and 2100?

$
0
0

Large declines in fertility will depend on raising female literacy above 80%.

Every few years, the United Nations Population Division releases demographic projections for the entire world and for every country, region and continent. Although the UN’s database is the most used source on demographics, the data is not equally reliable for all countries.

Countries in the developed world conduct regular censuses and produce detailed numbers that are considered reliable. Less developed countries conduct censuses on an irregular basis or are completely unable to conduct them and have instead to rely on demographic sampling. In the poorest countries of the world, most of which are in sub-Saharan Africa, censuses are infrequent or nonexistent and even sampling can be irregular and unreliable.

This poses a problem today because the biggest population growth by far is expected to take place in these same poor countries. In order to get a fair picture of the world population in the 21st century, we need to get reliable data from the fastest growing region.

François Pelletier who heads the UN’s Population Estimates and Projections Section told populyst that he considers the data for the next 35 years, that is the projections for the years 2015-2050, to be fairly reliable, with greater confidence in the near years than in the later years. The further the horizon of the projections, the greater the uncertainty. In this regard, Pelletier suggested that the projections beyond 2075, especially those focusing on the median trajectory at the country level, be treated with some degree of caution.

This makes perfect sense because a small change in the assumptions for child mortality and total fertility ratios (TFR = average children per woman) will have a relatively small impact in the near years and a cumulatively larger impact in the later years.

For example, if we assume for sub-Saharan Africa a low variant fertility ratio of 4.02 children per woman in 2020-2025 instead of a medium variant closer to 4.42, the cumulative impact of this change adds up to a difference in population size of ‘only’ 80 million people after ten years, a 5% deviation, but of as many as 600 million after fifty years, a 20% deviation.

Another source of demographic projections is the Vienna-based Wittgenstein Centre and it has cast doubt on the UN’s projections for world and Africa populations. In a note written by Samir KC, the Centre argues that the UN’s projections are too high because the fertility ratio in Africa is likely to fall faster than the UN predicts.

The Centre’s rationale is reached through analogy with the Asian fertility decline between 1970 and 1990 which was steeper than is predicted by the UN for Africa. Samir KC writes (our emphasis):

Once countries urbanize and citizens become wealthier, fertility declines everywhere.

The most important factor is women’s education. Already today, an Ethiopian woman with secondary education has on average only 1.6 children, compared to a woman with no education who has 6 children.

This relationship is true across Africa (see figure).

Fertility-rate

We know that access to education is expanding across Africa. There is even talk of an education dividend.

Once all girls go to school and stay there longer, they will have fewer children, especially as they will also be exposed to a more modern lifestyle, be it through TV, the cell phone and the fact that Africa is urbanizing rapidly.

This has also been the experience in Asia. It took about 20 years in Asia for its fertility to decline from more than 5 children per woman during early 1970s to less than 3 children per woman in early 1990s.

Similarly, India took about 20 years for its fertility to decline from 4.7 children per woman in early 1980s to 3.1 by early 2000s.

With new development and the plans for the better future in the making, it won’t be a surprise if the average African family would have only three children as soon as 2035.

If that assumption bears out, then Africa cannot reach 4 billion — and the world would peak this century at below 10 billion.

So who is right, the UN or the Wittgenstein Centre?

First, let us look at what each party is projecting. Second, let us examine in greater depth the correlation between fertility ratios and female literacy. Finally, let us see if the Wittgenstein Centre’s use of the Asian precedent makes sense for Africa.

Running the Numbers

Screen Shot 2015-11-17 at 8.16.19 PM

The adjoining tables (click to enlarge) show the UN’s projections for its low and medium variants. We ignore the high variant and other variants for now because our main purpose is to discuss whether the medium variant is too high, as alleged by the Wittgenstein Centre.

If we look at the two variants for the year 2050 in the table below, we can see that the difference in population size in sub-Saharan Africa is about 200 million or approximately 10% of the total, a non negligible deviation but one that does not fundamentally alter one’s view of the future. Looking further out to 2100, the difference is much more significant at nearly 1.2 billion or about 30% of the total.

Going through the same comparison for the whole world, the difference is 1 billion in 2050 and a big 4 billion in 2100, respectively 10% and 50% of the total. Also highlighted are figures for India, another high growth country.

Screen Shot 2015-11-17 at 8.15.20 PM

The Wittgenstein forecast is a bit lower than the UN’s low variant and assumes a sub-Saharan fertility ratio of 3.0 instead of 3.25 for the UN. Its population estimates for Africa in 2100 is 2.6 billion people, marginally lower than the UN’s low variant which is at 3 billion. We say “marginally” only in the sense that this difference looks large but it results from a small change in assumptions starting now 85 years earlier.

Female literacy and Fertility Ratios

Looking at women’s education, it is clear that female literacy, the cornerstone of Wittgenstein projections, is further behind in sub-Saharan Africa than in any other region of the world. The Indian subcontinent and the Middle East/North Africa also lag the rest of the world. Table 1 below shows that the lag in female literacy has been most pronounced in Southern Asia, Africa and the Middle East (Western Asia). Encouragingly, table 2 shows that the lag is significantly narrower among younger people.

Screen Shot 2015-11-21 at 6.29.19 AM

Screen Shot 2015-11-21 at 6.29.11 AM

It is clear that literacy is improving in Africa. The Oxford economist Max Roser compiled this map from UNESCO data and published it on his site Our World in Data. Click on the map to use the interactive feature.

Screen Shot 2015-11-20 at 12.10.37 PM (2)

The data shows solid progress in the literacy rate for youth aged 15-24, compared to older groups. For example, 66% of Nigeria’s youth (15-24) are literate, compared to 51% for the overall adult population (defined as 15+ here) and only 22% for the elderly population (65+). Other sub-Saharan countries show a similar progression.

The countries with the highest literacy rate among the youth group are also the ones with the lowest fertility ratios. Botswana and South Africa have youth literacy rates of 95% and 99% and TFRs of 2.9 and 2.4, respectively.

One surprising data point is Kenya with a literacy rate of 82% and a TFR of 4.4. Though lower than the 5.1 sub-Saharan average, Kenya’s TFR is still quite high, suggesting that the biggest decline in fertility may occur at a literacy rate that is higher than 80% or 85%. It may be that the TFR falls slowly as literacy rises from 50% to 85% and falls rapidly as it rises from 85% to 100%.

In order to examine this hypothesis, we compiled the following tables and charts.

The table shows rates of female literacy for all sub-Saharan countries (except Congo, Somalia and South Sudan). Many of these figures may not be reliable but the trend is clear that female literacy is improving all over the African subcontinent.

Screen Shot 2015-11-23 at 11.25.32 AM (2)

Plotting these figures, we reach the most important conclusion which is that the biggest decline in total fertility takes place after female literacy rises over 80%. Under 80%, the fall in TFRs and correlation with literacy is very weak. Excluding all countries with female adult literacy over 80%, the regression has an r-squared of only 0.29 (0.21 if the outlier Niger is also removed). Data from Burundi, Equatorial Guinea and Uganda look somewhat suspect with literacy over 80% and TFRs at 6.5, 4.97 and 6.1.

Screen Shot 2015-11-23 at 11.19.09 AMVersion 2


There may be cultural factors that may slow down this dynamic. In order to get a fuller picture, we looked for data on gender inequality. The United Nations Development Programme ranks countries by gender inequality. As shown in the table below, sub-Saharan African countries dominate the bottom of the ranking. It is not surprising that countries ranked lowest on the Gender Inequality Index also have the lowest female literacy and highest fertility ratios. Niger, Mali, Chad, DR Congo, Mozambique, Liberia, CAR all still have youth female literacy well below or barely above 50%. Niger looks especially challenging with a TFR of 7.7 and very low female literacy.

Screen Shot 2015-11-19 at 2.03.39 PM (2)


Non-African countries among the bottom 30 include lowest-ranked Yemen (152nd), Afghanistan (149th), Papua New Guinea (135th), Haiti (132nd), Egypt (130th), Pakistan (127th), India (127th) and Syria (125th). Nigeria and a number of others were not ranked in the latest data.

Analogy with Asia 1970-1990

Finally, does the Wittgenstein’s use of the precedent of Asia in 1970-1990 make sense for Africa now? We can see in the tables above that the fertility ratio in Asia fell from 5 in 1970 to 3 in 1990.

We can also see that China played a big role in this decline with its own TFR falling from 5 to 2. The one-child policy contributed to this accelerated decline but a big leap in literacy from about 50% to well over 90% was also a big contributor. Our hypothesis that fertility falls modestly under 80% female literacy, and collapses precipitously above 80% is supported by the Chinese experience. Literacy rose in the 1950s and 1960s but the TFR was still at 6.3 children per woman in 1965-70, very close to the 1950-55 TFR of 6.11. But twenty years later in 1985-90, female youth literacy exceeded 90% and the TFR fell to 2.75.

India is following a similar path with its female youth literacy ratio rising from 67.7 in 2001 to 87.2 in 2015 and its TFR falling from 3.3 in 2001 to 2.48 now. In the case of India however, the decline appears more gradual and is not obviously faster above the 80% literacy threshold. The table and graph below show that in the case of India the correlation holds well for literacy rates that are well below 80%.

Screen Shot 2015-11-23 at 4.11.32 PM (2)Screen Shot 2015-11-23 at 4.11.55 PM (1)


Other considerations

Another way to gauge the validity of the Asia analogy is to see whether Asia was more or less developed in 1970 than sub-Saharan Africa is today. If Asia was more developed, then the analogy may not be valid and the decline in African TFR will likely be slower. In order to answer this question, we look at electricity consumption per capita as a proxy for development.

According to the World Bank, electricity consumption per capita in 1970 was 150 kilowatt hour (kWh) in China and 95 kWh in India. Below are the figures for the most populous countries in sub-Saharan Africa.

Screen Shot 2015-11-19 at 1.20.03 PM (2)


Per capita electricity consumption in Kenya and Nigeria in 2012 (most recent World Bank data) looked roughly in line with China in 1970, while DR Congo and Tanzania in 2012 looked closer to India’s consumption in 1970. In the absence of a more robust method, we could say that the TFR in Kenya and Nigeria could decline like China’s in 1970-90, while the TFR in DR Congo and Tanzania could decline like India’s, and the TFR in Ethiopia and Uganda could decline even more slowly.

Under this scenario, the TFR for Kenya and Nigeria would fall to 2 by 2035, while in DR Congo and Tanzania, it would fall to only around 4, and in Ethiopia and Uganda to a still higher level.

In a similar vein, we could look at urbanization since people living in urban areas tend to have fewer children. With the exception of Uganda, all the countries in the table appear more urbanized than China was in 1970. The percentages shown for DR Congo (42%) and Nigeria (46.9%) look suspect because they are not far below China’s current percentage of urbanization 54.4%. It looks like definitions of urbanization differ across countries and we may fall back on electricity consumption as a more reliable indicator.

Version 2


Conclusion

All in, the answer to how fast African TFRs will decline remains elusive. We can however draw the following conclusions:

  • Demographics are not on automatic pilot. Proactive intervention to raise female literacy, to invest in infrastructure and to improve governance will all have a significant impact on future fertility rates. Absent these measures, it should not be assumed that TFRs will decline in Africa as fast as they did in Asia. They may remain high or they may decline for other reasons such as food or water scarcity.
  • The correlation between female literacy and fertility ratios is neither linear nor gradual. In the case of sub-Saharan Africa, TFRs seem to decline rapidly above 80% female literacy. Below 80%, the correlation is negligible or nonexistent.
  • The recent history of Asian fertility may or may not be a reliable precedent for Africa. China’s evolution in particular was greatly impacted by government policy, including the one-child policy, the literacy campaigns and the expansion of global trade.
  • Data from Africa and other less developed countries is generally unreliable. For example, it is possible that literacy rates and/or fertility rates for some African countries are inflated. It is also possible as a consequence that the relationship between literacy and fertility is in fact quite linear, as seen in the case of India.

Sami Karam is the founder and editor of populyst.net and the creator of the populyst index™. populyst is about innovation, demography and society. Before populyst, he was the founder and manager of the Seven Global funds and a fund manager at leading asset managers in Boston and New York. In addition to a finance MBA from the Wharton School, he holds a Master's in Civil Engineering from Cornell and a Bachelor of Architecture from UT Austin.

Some sources used in this article:

UNESCO Institute for Statistics: ADULT AND YOUTH LITERACY: National, regional and global trends, 1985-2015

UNESCO Institute for Statistics: ADULT AND YOUTH LITERACY: Global Trends in Gender Parity

Population Institute: How Female Literacy Affects Fertility: The Case of India

Sreemarti Chakrabarti: Women and Adult Literacy in China

World image by BigStockPhoto.com.

Traffic: Rome's Not-So-Smart Car Squeeze

$
0
0

Who would have thought that city planners in Oklahoma City would be more bike and pedestrian friendly, and better at taming car traffic, than those in Rome? In Oklahoma City, Mayor Mick Cornett has reordered the city’s transportation priorities away from cars, and toward exercise and fitness. Speaking of OKC's car-centric era, the mayor said “We had built an incredible quality of life, if you happen to be a car. But if you have to be a person, you are combatting the car seemingly at every turn.” By contrast, Rome remains wedded to the automobile, to the point that it’s turning into the Eternal Parking Lot.

Cornett has added sidewalks and bike lanes, and even put in some kayak parks downtown, leading OKC residents through a collective weight loss campaign that he estimates to have totaled one million pounds. Rome, meanwhile, must rank with Moscow, Dubai, and Lagos as one of the most automobile-dominated cities in the world.

What madness possessed me to take a bicycle into Rome? I had biked from Florence to Siena, across the heart of Tuscan wine country, and was simply continuing on two wheels. The reason I know: I went there on a bike.

Outside the classical city I could skirt cobblestones and ride in bus lanes (Rome has a few bike paths, but they begin and end nowhere, a bit like the country's politics).

Once inside the famed city gates, slick cobblestones made biking feel like a ride on a roller-coaster off the rails. As I headed into central Rome I knew the cobblestones and the taxi drivers might make it a rough journey, but I had forgotten the extent to which Rome is the world capital of lane-changing, that frantic need to get around every slow or parked car.

Knowing Rome fairly well I switched to back alleys and one-way streets, where I discovered that not only does the city's traffic have aspects of colliding atoms, but that the emergence of economical Smart Cars and small electric vehicles has made it possible for many more Romans to squeeze their motorized vehicles into the city’s historic corners.

No matter which historic piazza I crossed or which road I took I came face-to-face with one of the motorized creatures — some the size of golf carts — that Romans drive literally everywhere.

If Caesar’s assassins were now to stalk him near the Forum, I am sure they would do so in tiny Fiats and, while stabbing him, park on the sidewalk with their emergency lights flashing.

Everywhere I went in Rome, cars were littered. There were cars all around the Vatican, in the small squares of Trastevere, around the Colosseum, and up against the Forum.

Not only is Rome the empire of errant cars, its sidewalks — perhaps laid out to confuse invading Huns — have to be the worst in Europe. Walking two abreast is impossible. Instead, between the cars careening around medieval piazzas or parked against doorways, pedestrians must walk single-file, like a retreating army.

The solution to Rome’s clogged arteries is to ban (during the waking hours) cars, trucks, motor scooters, tour buses, four-by-fours, and Harleys from the historic downtown, and to return the small cobblestoned streets to their rightful owners: classical architecture and pedestrians.

For traveling through and outside the original city center, Rome has an underground metro, trams, and many buses which could stick to the main avenues. It might inconvenience some, but for the majority, and that includes the global heirs of the Roman republic, the city would again be a delight.

Venice solved the problem of burdensome traffic by filling its streets with water. Other European cities — the old town of Dubrovnik, Orleans in France, and Copenhagen come to mind — have successfully put pedestrians and bicycles first.

If its cars were evicted, Rome would become one of the world’s great open air museums, on a par with the old city of Jerusalem, parts of Marrakech, and with some sidewalk areas in Paris, although I doubt Rome will ever break with the automobile.

Rome is sinking under the weight of its exhaust pipes not only because of its traffic. The city shares the nation's political problems: one hundred and fifty years after its independence, Italy is still best understood as a fragmented state, the Yugoslavia of the European Union, with a dysfunctional judiciary, parliament, executive branch, and treasury, and the fear that the center will not hold.

To understand the level of executive and parliamentary incompetence, consider that, since the Fascist government was toppled in World War II, about forty-three men have served as prime minister, and the parliament has had more than sixty changes to its governing coalition. Only one government in this period has served out its five-year term.

The biggest reason for Italy’s political stalemate is that the country’s north-south divide has remained unresolved, some would say since Garibaldi marched on Rome in 1862.

Northern Italy has a prosperous manufacturing base, a balanced budget, low debt to its GDP, dynamic cities (Milan, Turin, Venice, Bologna), and strong tourist and export revenue. The south, which includes Naples and Sicily, is a huge consumer of government subsidies, heavily reliant on inefficient agricultural systems, and has less manufacturing than the North. Rome is a nether world between the two blocs.

Youth unemployment in Naples is said to be 50 percent, and GDP per capita is some $40,000 less in the south than in the north. Sicily today may have less to fear from the mafia, but greater danger from joblessness.

The specter of Italy dividing along its north-south seam — as if after an earthquake in the Apennines — is, I believe, the reason that no one wants a strong federal government in Rome. Little government is thought to be less offensive to most than at even some degree of functional government would be.

Rome is the symbol of this fragmented state, with its allure of past and future greatness, and its present vanishing under a layer of soot, corruption, and waste.

David Gilmour ends his excellent history, The Pursuit of Italy, with, “Yet the millennia of [the Italians] past and the vulnerability of their placement have made it impossible for them to create a successful nation-state.”

In Oklahoma City, my favorite mayor can expand the sidewalks and lay down more bike lanes, much as he can argue for a balanced budget. In Rome, however, no one can take on the car lobby because no one, politically, is out strolling arm-in-arm. For one thing, the sidewalks don’t allow it.

Matthew Stevenson, a contributing editor of Harper’s Magazine, is the author most recently of Remembering the Twentieth Century Limited, a collection of historical travel essays, and Whistle-Stopping America. His next book, Reading the Rails, will be published in 2016. He lives in Switzerland.

Flickr photo by Andrew Moore: Parking, Italian Style -- A Fiat 500 in Rome

Paris and the Politics of Climate

$
0
0

To some, particularly in the green movement, this month’s Paris climate change summit represents something like the great synods of the early Christian era, where truth and policy, for example, on pastoral celibacy, were determined by the princes of the church. Some others, largely marginalized on the fringes of the Right, insist the whole extravaganza is part of a vast left-wing conspiracy to delude people into accepting a world government.

Lost in translation is that the Paris conference is largely a sideshow camouflaging a potentially epic struggle among national, regional and economic interests. This mundane reality is often lost amid the apocalyptic rhetoric, such as employed by Gov. Jerry Brown, that insists draconian action is necessary to avoid the species’ imminent “extinction.”

In the real world, everything boils down to the winners and, arguably, the many more losers from the relentless drive to “decarbonize” the economy. Economist Bjorn Lonborg suggests that, by 2100, climate change policies will cost about a $1 trillion each year. Although scientists, bureaucrats, nonprofits and connected corporatists might actually benefit from decarbonizing quickly, it’s hard to see how most people will benefit from such an upheaval.

Not surprisingly, a growing number of people in key countries have become increasingly less interested in sacrificing their lives for some impending but not-yet-occurring catastrophe. In fact, a recent BBC poll covering some 20 countries found a decreasing interest in the climate agenda in all but three – Russia, Turkey and Spain. In many countries, including the United Kingdom, despite almost incessant media coverage, the public has become more skeptical about paying for far-reaching climate policies.

Read the entire piece at The Orange County Register.

Joel Kotkin is executive editor of NewGeography.com and Roger Hobbs Distinguished Fellow in Urban Studies at Chapman University, and a member of the editorial board of the Orange County Register. He is also executive director of the Houston-based Center for Opportunity Urbanism. His newest book, The New Class Conflict is now available at Amazon and Telos Press. He is also author of The City: A Global History and The Next Hundred Million: America in 2050. He lives in Orange County, CA.

Photo by Flickr user presidenciamx.

How Oklahoma City Decided to Change Its Image

$
0
0

I was in Oklahoma City for the first time earlier this year. I got to see a lot of the things I’d heard about, such as the in-progress Project 180, a $175 million plan to rethink and rebuild every downtown street.

OKC is not yet where it needs to be in a number of respects. Very little of the side has sidewalks, for example. But they are pedaling in the right direction, and making some smart choices about what to do – and equally as importantly, how to pay for it. If you visit you’ll also get a sense of the city’s ambitions for more.

I have a short piece in the most recent City Journal about OKC, which is now available online.  Here’s an excerpt:

In 1991, Oklahoma City lost out to Indianapolis in the competition for a United Airlines maintenance base. Mayor Ron Norick wanted to know why. He was certain that Oklahoma City had put the most compelling financial deal on the table for United. The company answered that its decision had nothing to do with the subsidy package. Rather, United simply couldn’t imagine its employees living in a place as bleak as Oklahoma City. “The quality of life had sunk so low we couldn’t buy someone’s attention,” as current mayor Mick Cornett puts it. “No matter how many incentive dollars we put in place, corporate America wasn’t interested in us.”

Click through to read the whole thing.

Aaron M. Renn is a senior fellow at the Manhattan Institute and a Contributing Editor at City Journal. He writes at The Urbanophile, where this piece originally appeared.

Los Angeles: City Of Losers?

$
0
0

When I arrived in Los Angeles four decades ago, it was clearly a city on the rise, practicing its lines on the way to becoming the dominant metropolis in North America. Today, the City of Angels and much of Southern California lag behind not only a resurgent New York City, but also L.A.’s longtime regional rival, San Francisco, both demographically and economically.

Forty years ago, San Francisco was a quirky, backward-looking town, a haven for the gilded rich and hippies, a quaint but increasingly insignificant town. The Dodgers and the Lakers ruled the California sporting world.

Today things couldn’t be more different. San Francisco and its much bigger southerly neighbor, Silicon Valley, have morphed into the global epicenter of the technology industry, with 25 tech companies on the Fortune 500. In contrast, Los Angeles County, which has almost twice as many people, is home to only 15 Fortune 500 firms total.

Meanwhile, the Giants and the Golden State Warriors have become consistent winners while the Dodgers, Angels and Clippers disappoint and the Lakers are painfully unwatchable.

Although there is a desire to repeat L.A.’s success with the 1984 Olympics and bring football back to town, that would only put a happy veneer over the city’s core problem: the long-term decline of its business sector. In 1984, the city had a strong and highly motivated business elite highlighted by 12 Fortune 500 companies, who could help sponsor the games and provide management expertise. Now there are only three within city limits, with the departure of major corporations such as Lockheed, Northrop Grumman, Occidental Petroleum and Toyota, and the loss of hundreds of thousands of manufacturing jobs.

In contrast, the Bay Area is full of thriving companies and successful entrepreneurs, many of them astoundingly young. Of the 30 richest people in the country, five live in the Bay Area; Southern California has only one, the Irvine Company visionary Chairman Donald Bren, and he’s in his eighties. The Bay Area accounts for the vast majority of American billionaires under 40; if not for Snapchat’s founders, Evan Spiegel and Bobby Murphy, as well Elon Musk, who lives in L.A. but spends much of his time working in Northern California, where Tesla and Solar City are located, L.A. would be off the list.

This unfavorable contrast with the Bay Area, sadly, is not just a recent development. Since 1990 Los Angeles County has added a paltry 34,000 jobs while its population has grown 1.2 million. In contrast, the Bay Area, which added roughly the same number of people during the same time, gained a net 500,000 jobs, mostly in the suburbs. In 1990 Los Angeles had around the same number of private-sector jobs per person as the Bay Area, roughly 410 per 1,000; today Los Angeles’ private-sector jobs to population ratio has dropped to 364 per 1,000 while the Bay Area’s has grown to 415. Worse yet, while the Bay Area has increased its share of high-wage jobs to 33 percent since 1990, Los Angeles percentage fell to 27.7 percent.

How L.A. Blew It In Technology

As recently as the 1970s, as UCLA’s Michael Storper has pointed out, L.A. stood on the cutting edge not only in hardware, but also software. Computer Sciences Corp. was the first software company to be listed on a national stock exchange. In 1969, UCLA’s Leonard Kleinrock invented the digital packet switch, one of the keys to the Internet.

In 1970, IT’s share of the economy in greater Los Angeles and in the Bay Area was about the same (in absolute terms it was bigger in L.A.). By 2010, IT’s share was four times bigger in the north than in the south.

Storper links the decline in large part to the strategies of the biggest high-tech companies in the L.A. area: Lockheed Martin, Rockwell and TRW focused on defense and space, essentially becoming dependent on government spending. In contrast, the Bay Area technology community, although also initially tied to Washington, began to move into more commercial applications. In the process they also developed a huge network of venture capitalists who would continue to help found and finance fledgling firms.

Today the San Jose area enjoys the highest percentage of workers in STEM (science technology engineering and mathematics-related jobs) in the country, over three times the national average. San Francisco and its immediate environs, largely as a result of the social media boom, now has a location quotient for STEM jobs of 1.75, meaning it has 75% more tech jobs per capita than the national average. In contrast, the Los Angeles area barely makes it to the national average.

Southern California remains an attractive to place to live, but it’s hard to imagine it as the next Silicon Valley. L.A. had its chance, and, sadly, it blew it.

The Growing Demographic Crisis

Storper and other critics suggest that Los Angeles failed in part because it tried to maintain high-wage blue collar industries while the Bay Area focused on information and biotechnology. The problem now, however, are the factors in L.A. that drive industry away, such as ultra-high electricity prices and a high level of regulation. Even amidst the recent industrial boom in many other parts of the country, Los Angeles has continued to lose manufacturing jobs; Los Angeles’ industrial job count stands at 363,900, still the largest number in the nation, but down sharply from 900,000 just a decade ago.

This decline places L.A in a demographic dilemma. Like the Midwestern states that lured African-American to fill industrial jobs during the Great Migration, L.A. attracted a large number of largely poorly educated immigrants, mostly from Mexico and Central America. These people came for jobs in factories, logistics and home-building, but now find themselves stranded in an economy with little place for them outside low-end services.

Although inequality and racial disparities also exist in the Bay Area, the issue is far more relevant in Southern California. The Bay Area’s population is increasingly dominated by well-educated Anglos and Asians. San Francisco’s population is 22 percent black or Hispanic; in Los Angeles, this percentage approaches 60 percent.

Poverty and lack of upward mobility are the biggest threats to the region. In Los Angeles, a recent United Way study found 35 percent of households were “struggling,” essentially living check to check, compared to 24 percent for the Bay Area.

recent study by the Public Policy Institute of California and the Stanford Center on Poverty and Inequality found that, once adjusted for cost of living, Los Angeles has the highest level of poverty in the state, 26.1 percent. Rents are out of control for many people who are struggling in an increasingly low-wage dominated economy. In fact, Los Angeles now is the least affordable city for renters, based on income, according to a recent UCLA paper.

Is There A Way Out?

Despite these myriad challenges, Los Angeles, and indeed all of Southern California, is far from a hopeless case. It is unlikely to become the next Detroit and is better positioned by natural and human resources than it’s similarly troubled big city competitor Chicago. It still enjoys arguably the best climate of any major city in the world, remains the home of Hollywood, the nation’s dominant ports and a still impressive array of hospitals and universities.

At least some of the city’s leadership has begun to recognize the challenges facing the region. “The city where the future once came to happen,” a devastating blue ribbon report recently intoned, “is living the past and leaving tomorrow to sort itself out.”

This recognition might be the first step toward a turnaround, but the area really has increasingly little control over its own fate. Today San Francisco and its immediate environs, despite its much smaller population, is home to virtually every powerful politician in the state: both its U.S. Senators, the Governor, the Lieutenant Governor and the Attorney General. Not surprisingly, state policies on everything from greenhouse gases, urban density and transit to social issues follows lines that originate in, and largely benefit, San Francisco.

Most troubling of all, the local leadership seems clueless about how to resuscitate the economy, or even how this vast region actually operates. Neither another Olympics nor getting a football team or two will make a difference. Even worse is the effort by Mayor Eric Garcetti to densify the city to resemble a sun-baked version of New York.

This has been part of the agenda for developers, greens and most local academics for the better part of 30 years. But the problem remains: Los Angeles, and even more so its surrounding region, is notNew York, nor can it ever be. It is, and will remain, a car-dominated, multi-polar city for the foreseeable future. After all the vast majority of Southern California’s population growth — roughly 75 percent — came after the Second World War and the demise of the Red Cars, L.A.’s  much lamented pre-war transit system.

Some outside observers such as progressive blogger Matt Yglesias now envision L.A. as “the next great transit city.” Yet in reality, despite spending $10 billion on new transit projects, the share of transit commuters has actually dropped since 1990; today nearly 31 percent of New York area commuters take public transportation, while 6.9 percent do so in Los Angeles-Orange County.

People take cars because, for most, it’s the quickest way to work. Few transit trips take less time, door to door than traveling by car, not to mention the convenience of working at home. The average transit rider in Los Angeles spends 48 minutes getting to work, compared to people driving alone, at 27 minutes.

This reflects L.A.’s great dispersion of employment, which is not compatible with a transit-driven culture. In greater New York, 20 percent of the workforce labors in the central core; in San Francisco, the percentage is roughly 10 percent. But barely 2 percent do so in Los Angeles. The current, much ballyhooed revival of downtown Los Angeles then is less a reflection of economic forces, than the preferences of a relatively small portion of population for a more urban lifestyle and as market for Asian flight capital. Its population of 50,000 is about the same as Sherman Oaks or the recently minted city of Eastvale in the Inland Empire.

Rather than seek to become someplace else, Los Angeles has to confront its key problems, like its woeful infrastructure, particularly roads, among the worst in the country, and a miserable education system. These are among the likely reasons why people with children are leaving Los Angeles faster than any major region of the country.

Yet Los Angeles is not without allure. Overall Los Angeles-Orange has grown its ranks of new educated workers between 25 and 34 since 2011 as much as New York and San Francisco and much more than Portland.

Perhaps most promising is the region’s status as the number one producer of engineers in the country, almost 3,000 annually. This raw material is now being somewhat wasted, with as many as 70 percent leaving town to find work.

What Los Angeles needs to do is to provide the entrepreneurial opportunities to keep its young at home, particularly the tech oriented. As the Bay Area has shown, it is possible to reshape an economy based on pre-existing strength. For L.A. the best regional strategy would be based on a remarkably diverse economy dominated by smaller firms, a population that, for the most part, seeks out quiet residential neighborhoods and often prefers working closer to home than battling their way to what remains a still unexceptional downtown.

One place where Los Angeles could shine is in melding the arts and technology. Unlike New York, which has relatively few engineers, Los Angeles still has the largest supply in the country. The Bay Area may be more appealing to nerddom, but is unexceptional in the arts. This revival will not come from the remaining suits in L.A.; roughly half of workers in the arts are self-employed, according to the economic forecasting firm EMSI.

This entrepreneurial trend will continue since, with the studio system clearly in decline, as large productions go elsewhere, digital players such as Netflix, Amazon, Apple as well as Los Angeles based Hulu have become more important. Los Angeles could expand its arts-related niche by supplying the content that these expanding digital pipelines require.

Given the corporate exodus, and the difficult California business climate, overall L.A.’s recovery must come from the bottom up, and be dispersed throughout the region. According to Kauffman Foundation research, the L.A. area already has the second highest number of entrepreneurs per 100 people in the country, just slightly behind the Bay Area.

The next L.A. can succeed, but not by trying to duplicate New York or San Francisco. Instead there’s a need for greater appreciation why so many millions migrated here in the first place: great weather, beaches, suburban-like living and entrepreneurial opportunities. Only when the local leadership rediscovers the uniqueness of L.A.’s DNA can the region undergo the renaissance of this most naturally blessed of places.

This article first appeared at Forbes.

Joel Kotkin is executive editor of NewGeography.com and Roger Hobbs Distinguished Fellow in Urban Studies at Chapman University, and a member of the editorial board of the Orange County Register. He is also executive director of the Houston-based Center for Opportunity Urbanism. His newest book, The New Class Conflict is now available at Amazon and Telos Press. He is also author of The City: A Global History and The Next Hundred Million: America in 2050. He lives in Orange County, CA.

Photo: Downtown Los Angeles toward the Hollywood Hills and the San Fernando Valley (by Wendell Cox)

Viewing all 3794 articles
Browse latest View live


Latest Images