Quantcast
Channel: Newgeography.com - Economic, demographic, and political commentary about places
Viewing all 3794 articles
Browse latest View live

Revisiting Two Forces of Modern Urban Transformation

$
0
0

Few factors have had a greater impact on recent urban growth than communications technology (ICT) and property investment strategies. The evolution of both is transforming space and social interaction at an unprecedented pace and depth, with mixed results. As these maturing forces are increasingly taken for granted, the next generation of urban growth should accommodate them in ways that preserve urban vitality and citizen livelihoods.

The jetpack that wasn’t

The impacts of ICT on urban life have been examined primarily in two realms: government operations and citizen-user lifestyles. With several decades of modern technology absorbed into urban life, it is now possible to longitudinally examine the impacts of ICT in both its functional and social dimensions.

In the mid-20th century, simple technologies supported the minutiae of city operations in ways that now seem mundane: stoplight sequencing, emergency response, utilities management, etc. After decades of innovation, technology is now a broader and more integral part of urban governance, from design to operations. For example, ICT’s value in aiding growth projection continues to be explored through highly sophisticated systems such as UrbanSim, which is being used by several cities around the world. What was once the concern only of technocrats – and the muse of Popular Science magazine – is now the recipient of large budget appropriations and a common topic for discussions about inter-urban competitiveness.   

Beyond operations, ICT has also restructured urban social interaction in both planned and unexpected ways; these are expressed in particular through changes in the physical environment. One example is the book retail industry, for which virtual markets have caused catastrophic impacts. For example, Barnes and Noble provided proxy community gathering spaces where people of varying ages and interests interacted. Aimless and leisurely perusing created a shared atmosphere of curiosity and exploration. However, many such stores are now bankrupt, replaced by an online shopping medium that eliminates the need for face-to-face interaction. A vestige of community life may have perished as a result.

Urban planners should be concerned about the socio-physical impacts of these transformations. As society withdraws into virtual realms, ICT exerts both convergent and divergent effects. The former allows people in dispersed locations to rally around a common interest, political cause, or commercial pursuit. It bridges cultures and geographies, and “flattens” the world in ways already amply studied. At the same time, ICT can splinter interests and fragment shared identities. There is little consensus about this matter, with some studies arguing that online media diminishes social skills and increases isolation, and others arguing that it has a positive correlation with “civic engagement” and tightens familial ties. Regardless, as social and commercial activity is virtualized there remains the chance that that place-based affinities – expressed, for example, by patronage of local enterprises – will gradually erode. Despite their virtues, “online communities” are still fundamentally a-spatial constructs. What is begun there often must be executed in person, underscoring the continued relevance of public space.

The long-term transformative effects of ICT cannot yet be fully appraised in part because technology uptake is rapid and unpredictable. Nevertheless, in one aspect – urban design – a synergy has emerged between bricks-and-mortar merchants and planners, in reaction to virtualization. Their complementary efforts, when successful, imbue commercial space with interaction-based vitality. The human instinct for sociability further supports these efforts, evidence that there is no substitute for many of the benefits cities offer. Lives are arguably better in proximity, a point supported by decades of agglomeration and anthropological research. The challenge for planners, therefore, is to create space for meaningful experiences inimitable in the virtual realm.

The masters of the neighborhood

Modernized property investment models predate ICT, but have imposed similarly transformative impacts on urban growth. 20th century efforts to generate vibrant commercial and residential spaces have a chequered history: suburban malls of the 1960s, festival marketplaces of the 1980s, and live-work-play new urbanist developments of the pre-recession 2000s. These development strategies exhibit the prevailing commercial and social trends of the time: white-flight suburbanization, urban core revitalization, and densified brownfield redevelopment.

More importantly, property development in its various forms is a product of the global investment climate. Susan Fainstein argues that emotion, shoddy research, and availability of (other people’s) money have fuelled unsuccessful investments that ultimately destabilised property markets. Development capital – particularly for large projects that can redefine an entire urban core – is increasingly sourced from institutional investors who arguably have little stake beyond financial returns. For example, Turkey has recently announced plans to facilitate international investment in its domestic property markets, and investment in Indian property by private equity firms has risen sharply in 2015. These types of developments range from business and technology parks to vast urban retail and residential complexes.

Additionally, the behavior of investors can influence the nature of such development. Stock investment strategies increasingly favor the short-run – “in and out quickly” – over the long-run (“blue-chips”). Translated into property investment, this strategy attracts capital to projects with quick returns but poor long-run viability. The immediacy of funding is commercially alluring, but rapid flight of capital can be devastating for neighborhoods. For example, the mortgage crisis illustrated the risk of designing property investment models like those for intangible (and liquid) assets such as stocks. Rapid divestment of investment shares and properties – in panicked response to market signals – elevates natural cycles into manic booms and catastrophic busts.

Cases like this illustrate how urban growth is impacted not only by the characteristics of financial institutions, but also by the eminently human irrationalities that distort their function. The city becomes less a product of local market demand than of the financial ambitions and risk preferences of absentee investors. These global prospectors often have little contextual knowledge of projects and even less interest in their social impacts. This investment approach may work for stocks, but not for property developments – particularly those that support urban growth and generate economically sustainable neighborhoods.

Citizens as social investors

Both technology and investment patterns have been enablers of growth strategies that serve interests beyond local livelihoods. This tension tests the power and will of urban governments to interpret global trends – including those of ICT and capital markets – in ways that enhance local livability and equity. It is therefore incumbent on planners to reconcile the vicissitudes of technological and financial change with the exigencies of authentic and inclusive urban growth. Moreover, a city is not merely a product of planning; it is the embodiment of resident priorities.

Authentic urban transformation relies more on citizen initiative than the influence of global capital, and may be facilitated by ICT but not defined by it; this can be seen in the quiet regeneration of urban neighborhoods. Global capital may underwrite loans for acquiring properties and developing land, decisions in such neighborhoods are often made locally and in the type of fragmented manner that generates a bricolage of uses and styles. Examples in the United States include East Nashville, Kansas City’s Crossroads district, and Oakland’s foodie Temescal and KoNo districts. None displays the architectural shock-and-awe of emerging global mega-cities, but each embodies a citizen-level developmental determinism that shapes their design and atmosphere. They are literal incarnations of the unique priorities of citizens at that time and place, independent of global trends that often result in regression to an aesthetic mean.

If cities balance opportunism with judiciousness in absorbing these forces, citizens ultimately should be the ones to demand it. Examples of facilitative policies are inclusive zoning, public space requirements, mixed-use zoning that reserves space for local enterprises. From the current vantage point, ICT and global investment appear poised to maintain their role in development; however, this no defeat for citizen livelihoods. Among their many responsibilities, planners should embrace their role as public-private intermediaries, creatively channelling external forces to de-commodify space and preserve vernacular authenticity. This is only possible by balancing stakeholder influence.

Kris Hartley is a visiting researcher at the Center for Government Competitiveness at Seoul National University, and a PhD Candidate at the National University of Singapore, Lee Kuan Yew School of Public Policy.


The Evolving Urban Form: Sprawling Boston

$
0
0

Few terms are more misunderstood than "urban sprawl." Generally, it refers to the spatial expansion (dispersion) of cities and has been use to describe urbanization from the most dense (least sprawling) in the world (Dhaka, Bangladesh), the most dense in the United States (Los Angeles) and also the least dense in the world (such as Atlanta and Charlotte, low density world champions in their population categories).

The discussion of density and dispersion is often confused, a prisoner of pre-conceived notions about various urban areas.  Boston is in a class by itself in this regard. Boston certainly deserves its reputation for a high density urban core and a strong CBD. Yet, Boston itself represents only a small part of the urbanization in its commute shed, which is a combined statistical area (CSA) or stand-alone metropolitan area (Note 2). The CSA is the largest labor market definition and combines adjacent metropolitan areas with strong commuting ties. The city of Boston had only 8% of the Boston-Worcester-Providence CSA population in 2010.

Much of the Boston CSA is made up of extensive, low density suburbanization more akin to Atlanta or Charlotte than to Los Angeles, which has the densest suburbs.

The Boston Combined Statistical Area

In contrast to its reputation for compactness, the Boston CSA is massive in its geography, covering more than 9,700 square miles (25,000 square kilometers). It is larger than Slovenia or Israel. The CSA stretches across parts of four states, including the eastern half of Massachusetts, all of Rhode Island, a large southeastern corner of New Hampshire and the northeastern corner of Connecticut. It includes the Boston, Providence, Worcester, Manchester and Barnstable Town metropolitan areas and the Concord (NH) and Laconia (NH) micropolitan areas.

Boston is the only CSA in the nation that includes three state capitals, Boston (Massachusetts), Providence (Rhode Island) and Concord (New Hampshire). It is the only CSA in the nation that contains the largest municipalities in three states, Boston, Providence and Manchester (New Hampshire).

The Boston CSA also includes multiple CBDs, from the fifth largest in the nation, Boston, to much smaller, but historically significant Providence, Worcester, and Manchester.

Consider this: The Boston CSA is more than 200 miles (320 kilometers) from the southernmost point, Westerly, Rhode Island to the northernmost point, on the shores of Lake Winnipesaukee, north of Laconia, New Hampshire and more than a third the way to Montréal. Westerly itself is less than 50 miles (80 kilometers) from the New York combined statistical area, which begins at Madison, Connecticut across the New Haven County line. From Boston's easternmost point near Provincetown, at the end of Cape Cod, it is more than 225 miles (360 kilometers) to Lake Winnipesaukee. From Provincetown to Athol, Massachusetts, to the west is more than 180 miles (290 kilometers).

Urbanization in the Boston CSA

But perhaps the most remarkable feature of this "Greater Greater Boston" is the extent of its urbanization (Note 3). The urban areas within the Boston CSA cover 3,640 square miles (9,400 square kilometers). This includes the dominant urban area of Boston (4.2 million), Providence (1.1 million), Worcester (0.5 million), which have largely grown together and a number of other urban areas. The urbanization is illustrated in the photograph above, which superimposes a Census Bureau maps of Boston's urbanization and the Boston CSA, both on a Google Earth image. The CSA is a "reddish" color, while the urban areas are more "pinkish," and completely enclosed in the CSA.

If all of Boston's urbanization were a single urban area, it would be the third most expansive in the world (Figure 1), following the combined urban area of New York-Bridgeport-New Haven (4,500 square miles or 11,600 square kilometers) and Tokyo-Yokohama (3,300 square miles or 8,500 square kilometers).

There is a big difference, however, in the intensity of development between the urbanization in these labor markets. The urban population of the Boston CSA is 7.1 million (Figure 2). The urbanization of the New York CSA has more than three times as many people (23 million), but covers only about 1.5 times the land area. Tokyo, with a tenth less land area, has more than five times the population (38 million). With a density of 1,941 per square mile (750 per square kilometer), the urbanization of Boston is 60% less dense (Figure 3) than the urbanization of the Los Angeles CSA (5,020 per square mile or 1,940 per square kilometer), which includes the Inland Empire urban area of Riverside-San Bernardino.

Pre-World War II Boston is largely confined within the Route 128 semi-circumferential highway (most of it now called Interstate 95), had a 2010 population of approximately 1.9 million, with a population density of 6,300 per square mile (2,400 per square kilometer). The core city of Boston is among the most dense in the United States, with a 2014 density of 13,300 per square mile (5,200 per square kilometer). It is also very successful, having experienced a strong population turnaround, after falling from 801,000 residents in 1950 to 562,000 in 1980 (a 30% loss). By 2014, the city had recovered nearly 40% of its former population, rising to 656,000.

Suburban Densities

But once you get outside of 128, Boston's urban population density fall steeply. If the denser urbanization inside Route 128 and the historic, dense municipalities of Providence, Worcester and Manchester are excluded, the remainder of Boston's urbanization has a population density of 1,435 per square mile (550 per square kilometer). This is less dense than Atlanta's urbanization outside the city of Atlanta. Overall, the Atlanta urban area is the least dense in the world with more than 2.5 million population. Approximately two-thirds of the Boston CSA urban population lives in these sparsely settled suburbs (Figure 4).

If the Boston CSA were as dense as  the Los Angeles urban form, the population would be 18.3 million, not 7.1 million, more than 2.5 times as -people as now reside there. 

In many ways, Boston is the epitome of the dispersed urban development that followed World War II. Once one of the nation's densest urban areas, it has evolved into one of the least. What distinguishes Boston from other low density urban areas, like Atlanta, Charlotte or Birmingham (Alabama) is that is core well reflects the urban form built for the pre-automobile age.

Employment Dispersion

As would be expected, Boston's highly dispersed urbanization has been accompanied by highly dispersed employment. Despite having the fifth largest CBD in the nation, Boston's "hub" accounts for only 6% of the CSA employment. In the 1950s and 1960s, Route 128 became the nation's first high-tech corridor and has been referred to as the birthplace of the modern industrial park. But most people work outside 128.

Despite Boston's huge urban expanse the average trip travel time is only 29 minutes. This is slightly above the US average of 26 minutes and 18 minutes shorter than Hong Kong, the high-income world's densest urban area. Hong Kong's urban density is more than 30 times that of Boston's urbanization.

One of the World's Most Prosperous Metropolitan Areas

Highly dispersed Boston has emerged as one of the world's most affluent areas. According to the Brookings Global Metro Monitor, the Boston metropolitan area has the fourth largest GDP per capita, purchasing power parity, in the world. Boston trailed only Macau, nearby Hartford and San Jose, the world's leading technology hub. Two other Boston CSA metropolitan areas were successful enough to be included in the top 100 in the Brookings data. The Providence and Worcester metropolitan areas ranked in the top 100 (like 65 other US metropolitan areas), at about the same level as Vienna, while leading Brussels and Tokyo. Overall, Boston has to rank as one of the country’s – and the world’s most successful labor markets. It has done so while not being denser but while combining the virtues of both a successful core city and a large, expansive periphery.

Note 1: Cites have two generic forms, physical and economic (or functional). The physical form is the continuously built-up area, called the urban area or the urban agglomerations. This is the area that would be outlined by the lights of the city from a high flying airplane at night. The economic form is the labor market (metropolitan area or combined statistical area), which includes the urban area but stretches to include rural areas and other areas from which commuters are drawn. There is considerable confusion about urban terms, especially when applied to municipalities when called "cities," Municipalities are not themselves generic cities, but are usually parts of generic cities. Some municipalities may be larger than their corresponding generic cities (principally in China).

Note 2: "Commute sheds" encompass core based statistical areas, as defined by the Office of Management and Budget. including combined statistical areas, as well as metropolitan and micropolitan areas that are not a part of combined statistical areas), Combined statistical areas themselves are formed by strong commuting patterns between adjacent metropolitan and micropolitan areas. A table of all 569 commuter sheds is posted to demographia.com.

Note 3: Combined statistical areas (and metropolitan areas) often have more than one urban area. This article combines all of the urban areas in the Boston CSA, rather than focusing only on the principal urban area, Boston. Comparisons are made to the total urbanization (not the principal urban areas) of other CSAs in the United States.

Wendell Cox is Chair, Housing Affordability and Municipal Policy for the Frontier Centre for Public Policy (Canada), is a Senior Fellow of the Center for Opportunity Urbanism (US), a member of the Board of Advisors of the Center for Demographics and Policy at Chapman University (California) and principal of Demographia, an international public policy and demographics firm.

He is co-author of the "Demographia International Housing Affordability Survey" and author of "Demographia World Urban Areas" and "War on the Dream: How Anti-Sprawl Policy Threatens the Quality of Life." He was appointed to three terms on the Los Angeles County Transportation Commission, where he served with the leading city and county leadership as the only non-elected member. He served as a visiting professor at theConservatoire National des Arts et Metiers,a national university in Paris. 

Photo:  Second largest geographical expanse of labor market urbanization in the world (Boston). US Census Bureau maps superimposed on Google Earth.

Chicago’s Great Financial Fire

$
0
0

My latest piece is online in City Journal and is called “Chicago’s Financial Fire.” It’s a look at the ongoing financial crisis in that city, which has all of a sudden gotten very real thanks to a downgrade of the city’s credit rating to junk by Moody’s. Here’s an excerpt:

While some sort of refinancing may be required, the proposed debt issue contains maneuvers similar to those that helped get Chicago into trouble in the first place—including more scoop and toss deferrals, $75 million for police back pay, $62 million to pay a judgment related to the city’s lakefront parking-garage lease, and $35 million to pay debt on the acquisition of the former Michael Reese Hospital site (an architecturally significant complex Daley acquired and razed for an ill-fated Olympic bid). The debt-issue proposal also includes $170 million in so-called “capitalized interest” for the first two years. That is, Chicago is actually borrowing the money to pay the first two years of interest payments on these bonds. In true Chicago style, the proposal passed the city council on a 45-3 vote. Hey, at least the city is getting out of the swaps business.

Even with no further gimmicks, Emanuel will be six years into his mayoralty before the city can stop borrowing just to pay the interest on its debt. And without accounting for pensions, it will take the full eight years of both his terms to get the city to a balanced budget, where it can pay for the regular debt it has already accumulated.

Click through to read the whole thing.

Rahm donned a sweater during his reelection campaign and told the public he recognized he needed to change his ways, saying that he knows he “can rub people the wrong way.” The title of that ad was “Chicago’s Future.”

I decided to take him up on his new approach. When I was working on this piece, I tried to get some information of the mayor’s press office. I asked them such extremely hard hitting questions as, “Is there a consolidated location where all of the mayor’s most recent financial proposals can be seen in their current form?” I emailed them and got no response. So I followed up with a phone call. I was put on hold for a while then told the person I needed to talk to was away from her desk, but I should email her at a XYZ address. So I did. No response. This is the same pattern all previous inquiries I’ve made have followed, though I believe on occasion I’ve been put through to a voice mail from which I got no callback. Now, it’s not like I try to get stuff from these guys every day, but the message is pretty clear. I gather that this experience is not at all unusual when dealing with Rahm.

Having his press office simply refuse to respond at all to even basic inquiries from (the apparently many) people on his blacklist is naught put pettiness. Rahm takes people who could be friends and does his best to turn them into enemies. No wonder the Sun-Times titled a recent about him, “Rahm’s troubles plentiful, allies scarce.”

Thus it is that Chicago, a city of grand and expansive history and ambition, a city so big it overflows the page, comes to have a mayor with a certain smallness of spirit.

Aaron M. Renn is a senior fellow at the Manhattan Institute and a Contributing Editor at City Journal. He writes at The Urbanophile, where this piece first appeared.

Chicago photo by Bigstock.

The Cities Creating The Most White-Collar Jobs

$
0
0

In our modern economy, the biggest wellspring of new jobs isn’t the information sector, as hype might lead some to think, but the somewhat nebulous category of business services. Over the past decade, business services has emerged as easily the largest high-wage sector in the United States, employing 19.1 million people. These are the white-collar jobs that most people believe offer a ladder into the middle class. Dominated by administrative services and management jobs, the sector also includes critical skilled workers in legal services, design services, scientific research , and even a piece of the tech sector with computer systems and design. Since 2004, while the number of manufacturing and information jobs in the U.S. has fallen, the business services sector has grown 21%, adding 3.4 million positions.

Given these facts, mapping the geography of business services employment growth is crucial to getting a grip on the emerging shape of regional economies. And because business services cover such a wide spectrum of activities, there is no one kind of area that does best. Business services thrive in a host of often different environments, far more so than the more narrow patterns we see in manufacturing or information. To generate our rankings of the best places for business services jobs, we looked at employment growth in the 366 metropolitan statistical areas for which BLS has complete data going back to 2003, weighting growth over the short-, medium- and long-term in that span, and factoring in momentum — whether growth is slowing or accelerating. (For a detailed description of our methodology, click here.)

Tech-Service Hubs

Increasingly much of what we call tech is really about business services. Companies that primarily use technology to sell a product generally require many ancillary services, from accounting and public relations to market research. Apple, Google, and Facebook clearly demand many services, and that’s one reason why San Jose-Sunnyvale-Santa Clara ranks first on our big metro areas list (those with at least 450,000 jobs). Since 2009, business service employment has expanded 34.7% in the area; just last year the sector expanded 7.9%. The Bay Area’s other tech rich region, San Francisco-Redwood City-South San Francisco, ranks second.

This linkage of tech with business services can be seen in other information-oriented parts of the country. Both third-ranked Raleigh, N.C., and No. 5 Austin, Texas, are also tech hubs, and boast rapidly expanding business service sectors. They are also much less expensive places to do business, which may suggest these areas will be well positioned to capture more service jobs if bubble-licious stock and real estate prices undermine some of the economic logic that has driven business in the Bay Area.

The key here may also be cultural. Workers in business services tend to be well educated, and younger employees may well share the lifestyle preferences that have led workers to the Bay Area, as well as such moderately hip places as Austin. Their higher wages help defray the spiraling costs of living in these desired locations and millennials’ and, at least until their 30s, keep them closer to the urban core.

Sun Belt Service Boom Towns

The balance of our top 10 business service locations are all in the Sun Belt. For the most part, these are lower cost places that have enough amenities and transportation links to attract and nurture business service firms. The strongest example is Nashville, ranked fourth on our list, where business service employment has soared 41.4% over the past five years. Much of this growth is tied to health services, entertainment and staffing services.

The re-emergence of No. 10 Atlanta-Sandy Springs-Roswell is particularly marked, as we saw in our overall rankings. Business service growth has led economist Marci Rossell to predict a net gain of 140,000 jobs for the metro area this year, which would be the first time it has netted more than 100,000 since 1999.

The Traditional Big Players

Business services have long clustered in the largest American cities. But with the exception of the Bay Area, greater Dallas and Atlanta, few of our biggest metro areas did particularly well on our list. Indeed of those areas with over 2 million business service jobs, the next highest ranking belongs to No. 21 Houston, which has seen a healthy 27.8% growth in this sector since 2009.

Other mega-regions have not done nearly as well. The largest business service economy, that of New York City, with over 4.1 million jobs in this sector, ranks 29th, with good but not spectacular 20.5% growth over the past five years. But New York, as we have seen on our overall list of The Best Cities For Jobs, consistently outpaces its major rivals. Chicago lags on our business services list in 42nd place, with 18.1% growth over the past five years, and Los Angeles, which once saw itself as a serious challenger to New York, ranks 44th, with 17.4% job growth over that span.

Perhaps the biggest surprise has been the relatively weak record of the capital area. A major beneficiary of the stimulus, it appears now to be slipping in ways no one could have anticipated. The Washington- Arlington- Alexandria MSA, with over 2.5 million business service jobs, ranked 65th out of the 70 largest metro areas; neighboring Silver Spring-Frederick- Rockville won the dubious distinction of coming in dead last, the only large metro area to actually lose business service jobs. Washington’s “beltway bandits” have long thrived during periods of government growth. But after a boom during the early stimulus, Republican controls on spending have filtered into the business service economy. “D.C.,” noted the Washington City Paper, “went from the star of the recession to the runt of the recovery.”

Potential Rising Stars

Some might type-cast business service jobs as the domain of large metropolitan regions, clustered particularly in well-developed downtowns. Yet growth also is occurring in small and mid-sized cities, which often enjoy lower costs than their big city cousins. These are clearly some advantages to being in a big urban center in terms of amenities and face-to-face connections, but smaller cities are generally more attractive to middle class families, particularly to middle managers who might not be able to live decently in the hyper-expensive areas.

One prime example is our fastest growing mid-sized region, Provo-Orem, Utah, where business service employment has surged 46.5% since 2009 to 29,600 jobs. Located south of Salt Lake City, and home to Brigham Young University, the area has long attracted manufacturers and tech firms, who provide a base for business service providers. Indeed small and mid-sized college towns have seen some of the most rapid growth. This includes our No. 1 small and overall metro area, Auburn-Opelika Ala., which has posted 66.7% growth in business services employment since 2009 (albeit off a small base – total employment in the metro area is just 60,700). Just behind is Tuscaloosa, Ala., another small town built around a big university (“Roll Tide”) and some smaller colleges. (For our overall top 10 list, click here.)

But, as we have seen elsewhere, business service growth also tends to be strongest in areas with expanding other industries. For example, Fayetteville-Springdale-Rogers, Ark., ranked fourth on our mid-sized metro area list, is also home to Walmart, a company that provides opportunities for local business service firms. Overall 11 of the top 12 areas for business service job growth are small and one, Provo-Orem, is midsized.

These rapidly growing service regions could prove big winners in the years ahead. As telecommunication technology consistently destroys the tyranny of distance, more service firms may find it less expensive, and convenient, to locate their activities elsewhere. Just as manufacturing shifted out of the bigger cities, we could soon see a movement of business service providers as well, which would be a great boom to hundreds of small and medium-size regions.

Joel Kotkin is executive editor of NewGeography.com and Roger Hobbs Distinguished Fellow in Urban Studies at Chapman University, and a member of the editorial board of the Orange County Register. He is also executive director of the Houston-based Center for Opportunity Urbanism. His newest book, The New Class Conflict is now available at Amazon and Telos Press. He is also author of The City: A Global History and The Next Hundred Million: America in 2050. He lives in Orange County, CA.

Michael Shires, Ph.D. is a professor at Pepperdine University School of Public Policy.

Big Tiger Paw" by Josh Hallett - originally posted to Flickr as Big Tiger Paw. Licensed under CC BY 2.0 via Wikimedia Commons.

LA’s Tale of Two Cities

$
0
0

It’s the best of times and the worst of times in Los Angeles.

Los Angeles is now attracting notice as a so-called “global city,” one of the world’s elite metropolises. It is ranked #6 in the world by AT Kearney and tied for 10th in a report by the Singapore Civil Service College that I contributed to.  Yet it also has among the highest big city poverty rates in the nation, and was found to be one of the worst places in America for upward mobility among the poor. Newspaper columns are starting to refer to LA as a “third world city.”

Though the Bay Area gets the headlines, the LA region likes to boast it’s coming on strong in tech.  With a diverse set of marquee names including Snapchat, Tinder, Oculus, and SpaceX, LA’s startup scene continues to grow. But tech growth overall has been middling, ranking 28th out of the country’s sixty-six largest region in information job growth, according to a recent Forbes survey.

More disturbing, job growth has also been slow, ranking 35th overall, at a time when it’s long time rivals in the Bay Area occupy the top job and tech rankings. Some of this reflects the loss of a key industry, aerospace, but also the departure of major corporations such as Lockheed,  Northrup Grumman, Occidental Petroleum, and Toyota, which has left LA’s once vaunted corporate community but is a shell of its former self.

Yet LA’s glitz factor remains potent. The fashion industry has gained considerable recognition.  Tom Ford set up shop and brought his runway show to the city. Locally grown brands like Rodarte have a major following.   LA also is increasingly a global center of gravity in the art world.

Yet behind the glitz, in the city of Los Angeles, aging water mains regularly erupt and the streets and sidewalks decay, with the city’s own report estimating it has an $8.1 billion infrastructure repair backlog.

One report chronicles the flight of cash-strapped New York creatives fleeing to sunny, liberating, and less expensive LA.  Another how high prices and the Southern California grind are sending those same creatives packing.

What’s going on here?

What we are witnessing is LA changing in the context of the two tier world ---divided between rich and poor --- that we live in. This has been made worse by a city that has excessively focused on glamour at the expense of broad based opportunity creation.

Los Angeles may be a creative capital and a great place to live as a creative worker, but it was always much more than that. It was also a great place to build the middle class American Dream or run a business that employed people at scale. For example, it was and still today remains the largest manufacturing center in the United States.  Yet it has lost half of its manufacturing job base since 1990.  That’s over half a million manufacturing jobs lost in the region since then, with over 300,000 of those just since 2000. Unlike Detroit, Houston, Nashville and even Portland, the region has not benefited at all from the resurgence of US manufacturing since 2009.

Manufacturing decline, of course, is hardly unique to LA, but the city’s problems are particularly acute because region is so huge and diverse, being both the second largest metro area in the country, and the most diverse major region in America.  LA has a higher share of Hispanic population than any major metro apart from San Antonio – one twice as high as the Bay Area.  The LA/Inland Empire’s 8.4 million Hispanics would by themselves be the fourth largest metro area in the country, and are more than the total number of people living in the Bay Area. The area also has over a million black residents.

With their heavily well-educated populations the Bay Area and Boston can perhaps get away with operating as sort of luxury boutiques for upscale whites and Asians, however dubious a decision that may be. Not so LA.

The problem is that LA and California more broadly have adopted the luxury boutique mindset.  Policies are made in ways that favor the glamorous industries like Hollywood, high tech, and the arts – industries that don’t employ a lot of aspiring middle class people, particularly Hispanics or blacks.  

These policies include strongly anti-growth land use and environmental policies designed to produce the kind pristine playgrounds favored by glamour industries and creative elite. But they have rendered the region increasingly unaffordable to all but the highly affluent or those who were lucky enough to buy in long ago. 

Tech firms and entertainment companies can afford to pay their key workers whatever they need to live in LA.  That’s tougher for more workaday businesses. Ditto for business regulations, where many industries don’t have the margins to spend on things like a phalanx of compliance attorneys.

Now that high prices are starting to hurt younger hipsters who want to join the creative industries, this is starting to get attention. But if it’s a problem for young, educated Millennials, it’s a disaster for the working class. 

LA does deserve credit for potentially opportunity expanding investments in transit. But if transit can be seen as a potential winner, most political  leaders seem more concerned with finding ways to simply attempt to politically reallocate some money to those being squeezed by their policies, all at the expense of growth. The $15 minimum wage is Exhibit A. Like rent control, a high minimum wage benefits a few lucky winners while harming others and making it harder to justify business investment that would create more jobs and entry level opportunities onto the ladder of success, while raising consumer prices. The fact that nearly half of LA’s workers might be covered by the new minimum is a damning testament to the erosion of the region’s middle class job base.

The real measure of success for LA is not how many runway shows, startups, and elite rankings it can achieve, but whether it can recover its role as an engine of opportunity for its large and diverse population to achieve their American Dream. Local leaders would be better served looking for policies that will expand opportunity instead of the ones they are following that actually reduce it.

Aaron M. Renn is a Senior Fellow at the Manhattan Institute for Policy Research and a Contributing Editor at its magazine City Journal.

Special Report: The Laissez Faire New Orleans Rebuilding Strategy Was Exactly That

$
0
0

Urban risk may be understood as a function of hazard, exposure, and vulnerability.1 In metro New Orleans, Katrina-like storm surges constitute the premier hazard (threat); the exposure variable entails human occupancy of hazard-prone spaces; and vulnerability implies the ability to respond resiliently and adaptively—which itself is a function of education, income, age, social capital, and other factors—after having been exposed to the hazard.

This essay measures the extent to which, after the catastrophic deluge triggered by Hurricane Katrina in 2005, residents of metro New Orleans have shifted their settlement patterns and how these movements may affect future urban risk.2 What comes to light is that, at least in terms of residential settlement geographies, the laissez faire rebuilding strategy for flooded neighborhoods proved to be exactly that.

“The Great Footprint Debate” of 2005-2006

An intense debate arose in late 2005 over whether low-lying subdivisions heavily damaged by Katrina’s floodwaters should be expropriated and converted to greenspace. Most citizens and nearly all elected officials decried that residents had a right to return to all neighborhoods. Planners and experts countered by explaining that a population living in higher density on higher ground and surrounded by a buffer of surge-absorbing wetlands would be less exposed to future storms, and would achieve a new level of long-term sustainability.

Despite its geophysical rationality, “shrinking the urban footprint” proved to be socially divisive, politically volatile, and ultimately unfunded. Officials thus had little choice but to abrogate the spatial oversight of the rebuilding effort to individual homeowners, who would return and rebuild where they wished based on their judgment of a neighborhood’s viability.

Federal programs nudged homeowners to return to status quo settlement patterns. Updated flood-zone maps from FEMA’s National Flood Insurance Program, for example, would provide actuarial encouragement to resettle in prediluvial spaces, while the federally funded, state-administered Louisiana Road Home Program’s “Option 1”—to rebuild in place, by far the most popular of the three options—provided grant money to do exactly that.

“Shrinking the urban footprint” became heresy; “greenspacing” took on sinister connotations; and rebuilding in flooded areas came to be valorized as a heroic civic statement. Actor Brad Pitt’s much-celebrated Make It Right Foundation, for example, pointedly positioned its housing initiative along a surge-prone canal, below sea level and immediately adjacent to the single worst Katrina levee breach, to illustrate that if a nonprofit “could build safe, sustainable homes in the most devastated part of New Orleans, [then it] would prove that high-quality, green housing could be built affordably everywhere.”3 Ignoring topography and hydrology gained currency in the discourse of community sustainability even as it flew in the face of environmental sustainability.

A Brief History of New Orleans’ Residential Settlement Patterns, 1718-2005

Topography and hydrology have played fundamental roles in determining where New Orleanians settled since the city’s founding in 1718. The entire region, lying at the heart of the   dynamic deltaic plain of the Mississippi River, originally lay above sea level, ranging from a few inches along the marshy perimeter, to a few feet along an interior ridge system, to 8 to 12 feet along the natural levee abutting the Mississippi River.

From the 1700s to the early 1900s, the vast majority of New Orleanians lived on the higher ground closer to the Mississippi. Uninhabited low-lying backswamps, while reviled for their (largely apocryphal) association with disease, nonetheless provided a valuable ecological service for city dwellers, by storing excess river or rain water and safeguarding the city from storm surges. Even the worst of the Mississippi River floods, in 1816, 1849, and 1871, mostly accumulated harmlessly in empty swamplands and, in hindsight, bore more benefits than costs. New Orleanians during the 1700s-1900s were less exposed to the hazard of flooding because the limitations of their technology forced them to live on higher ground.4

Circumstances changed in the 1890s, when engineers began designing and installing a sophisticated municipal drainage system to enable urbanization to finally spread across the backswamp to the Gulf-connected brackish bay known as Lake Pontchartrain. A resounding success from a developmental standpoint, the system came with a largely unforeseen cost. As the pumps removed a major component of the local soil body—water— it  opened up cavities, which in turn allowed organic matter (peat) to oxidize, shrink, and open up more cavities. Into those spaces settled finely textured clay, silt, and sand particles; the soil body thus compacted and dropped below sea level. Over the course of the twentieth century, former swamps and marshes in places like Lakeview, Gentilly, and New Orleans East sunk by 6-10 feet, while interior basins such as Broadmoor dropped to 5 feet below sea level. New levees were built along the lakefront, and later along the lateral flanks, were all that prevented outside water from pouring into the increasingly bowl-shaped metropolis.

Nevertheless, convinced that the natural factors constraining their residential options had now been neutralized, New Orleanians migrated enthusiastically out of older, higher neighborhoods and into lower, modern subdivisions. Between 1920 and 1930, nearly every lakeside census tract at least doubled in population; low-lying Lakeview increased by 350 percent, while parts of equally low Gentilly grew by 636 percent. Older neighborhoods on higher ground, meanwhile, lost residents: Tremé and Marigny dropped by 10 to 15 percent, and the French Quarter declined by one-quarter. The high-elevation Lee Circle area lost 43 percent of its residents, while low-elevation Gerttown increased by a whopping 1,512 percent.5

The 1960 census recorded the city’s peak of 627,525 residents, double the population from the beginning of the twentieth century. But while nearly all New Orleanians lived above sea level in 1900, only 48 percent remained there by 1960; fully 321,000 New Orleanians had vertically migrated from higher to lower ground, away from the Mississippi River and northwardly toward the lake as well as into the suburban parishes to the west, east, and south.6

Subsequent years saw additional tens of thousands of New Orleanians migrate in this pattern, motivated at first by school integration and later by a broader array of social and economic impetuses. By 2000, the Crescent City’s population had dropped by 23 percent since 1960, representing a net loss of 143,000 mostly middle-class white families to adjacent parishes. Of those that remained, only 38 percent lived above sea level.7

Meanwhile, beyond the metropolis, coastal wetlands eroded at a pace that would reach 10-35 square miles per year, due largely to two main factors: (1) the excavation through delicate marshes of thousands of miles of erosion-prone, salt-water-intruding navigation and oil-and-gas extraction canals, and (2) the leveeing of the Mississippi River, which prevented springtime floods but also starved the delta of new fresh water and vital sediment. Gulf waters crept closer to the metropolis’ floodwalls and levees, while inside that artificial perimeter of protection, land surfaces that once sloped gradually to the level of the sea now formed a series of topographic bowls straddling sea level.

When those floodwalls and levees breached on August 29, 2005, sea water poured in and became impounded within those topographic bowls, a deadly reminder that topography still mattered. Satellite images of the flood eerily matched the shape of the undeveloped backswamp in nineteenth-century maps, while those higher areas that were home to the historical city, quite naturally, remained dry.

But the stark geo-topographical history lesson could only go so far in convincing flood victims to move accordingly; after all, they still owned their low-lying properties, and real estate on higher terrain was anything but cheap and abundant. Besides, New Orleanians in general rightfully felt that they had been scandalously wronged by federal engineering failures, and anything short of full metropolitan reconstitution came to be seen as defeatist and unacceptable. Most post-Katrina advocacy thus focused on reinforcing the preexisting technological solutions that kept water out of the lowlands, rather than nudging people toward higher ground. “Shrink the urban footprint” got yelled off the table; “Make Levees, Not War” and “Category-5 Levees Now!” became popular bumper-sticker slogans; and “The Great Footprint Debate” became a bad memory.

Resettlement in Vertical Space

The early repopulation of post-Katrina New Orleans defied easy measure. Residents living “between” places as they rebuilt, plus temporarily broken-up families, peripatetic workers, and transient populations all conspired to make the city’s 2006-2009 demographics difficult to estimate, much less map. The 2010 Census finally provided a precise number: 343,829. By 2014, over 384,000 people lived in Orleans Parish, or eighty percent   of the pre-Katrina figure. Of course, not all were here prior; one survey determined roughly 10 percent of the city’s postdiluvian population had not lived here before 2005.8

How had the new population resettled in terms of topographic elevation? We won’t know precisely until 2020, because only the decennial census provides actual headcounts aggregated at sufficiently high spatial resolution (the block level) for this sort of analysis; annual estimates from the American Community Survey do not suffice. Thus we must make do with the 2010 Census. While much has changed during 2010-2015, the macroscopic settlement geographies under investigation here had largely had fallen into place by 2010.


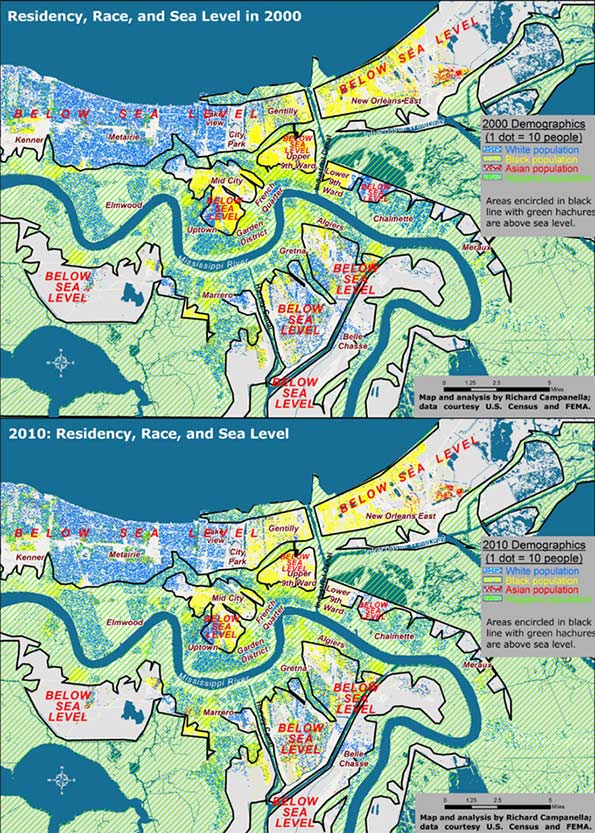
Figure 1. Residential settlement above and below sea level, 2000 and 2010; analysis and maps by Richard Campanella.

When intersected with high-resolution LIDAR-based digital elevation models, the 2010 Census data show that residents of metro New Orleans shifted to higher ground by only 1 percent compared to 2000 (Figure 1). Whereas 38 percent of metro-area residents lived above sea level in 2000, 39 percent did so by 2010, and that differentiation generally held true for each racial and ethnic group. Whites shifted from 42 to 44 percent living above sea level; African Americans 33 to 34 percent, Hispanics from 30 to 29 percent, and Asians 20 to 22 percent.

Clearly, elevation did not exercise much influence in resettlement decisions, and people distributed themselves in vertical space in roughly the same proportions as before the flood. Yet there is one noteworthy angle to the fact that the above-sea-level percentage has risen, albeit barely (38 to 39 percent): it marked the first time in New Orleans history that the percent of people living below sea level has actually dropped.

What impact did the experience of flooding have on resettlement patterns? Whereas people shifted only slightly out of low-lying areas regardless of flooding, they moved significantly out of areas that actually flooded, regardless of elevation. Inundated areas lost 37 percent of their population between 2000 and 2010, with the vast majority departing after 2005. They lost 37 percent of their white populations, 40 percent of their black populations, and 10 percent of their Asian populations. Only Hispanics increased in the flooded zone, by 10 percent, in part because this population had grown dramatically region-wide, and because members of this population sometimes settled in neighborhoods they themselves helped rebuild.

The differing figures suggest that while low-lying elevation theoretically exposes residents to the hazard of flooding, the trauma of actually flooding proved to be, sadly, much more convincing.

Resettlement in Horizontal Space

Contrasting before-and-after residential patterns in horizontal space may be done through traditional methods such as comparative maps and demographic tables. What this investigation offers is a more singular and synoptical depiction of spatial shifts: by computing and comparing spatial central tendencies, or centroids.  

A centroid is a theoretical center of balance of a given spatial distribution. A population centroid is that point around which people within a delimited area are evenly distributed.9

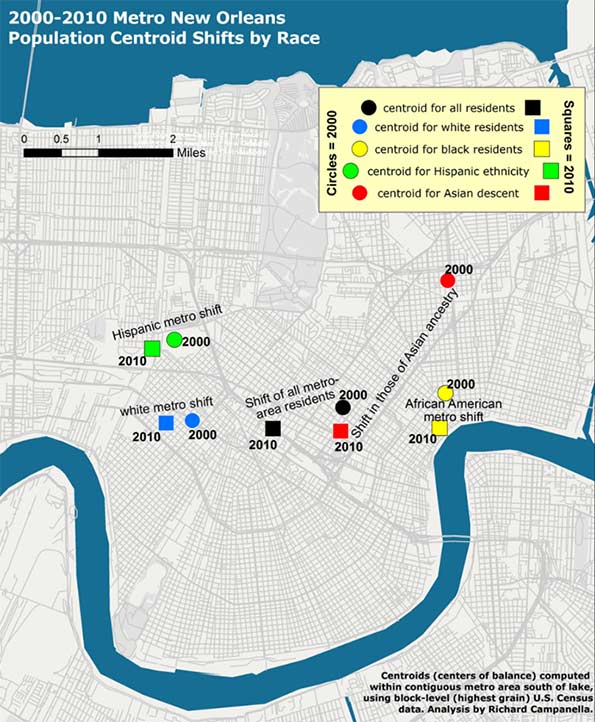
Centroids capture complex shifts of millions of data with a single point. But they do not tell the entire story. A centroid for a high-risk coastal area, for example, may shift inland not because people have moved away from the seashore, but because previous residents decided not to return there. It’s also worth noting it takes a lot to move a centroid, as micro-scale shifts in one area are usually offset by countervailing shifts elsewhere. Thus, apparent minor centroid movements can actually be significant. Following are the centroid shifts for metro New Orleans broken down by racial and ethnic groups (Figures 2 and 3).

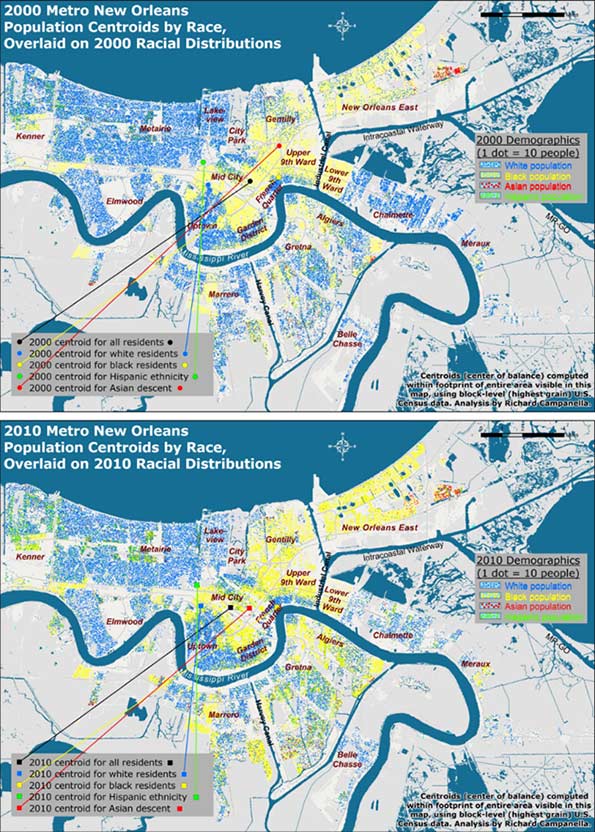
In 2000, five years before the flood, there were 1,006,783 people living within the metro area as delineated for this particular study, of whom 512,696 identified their race as white; 435,353 as black; 25,941 as Asian; and 50,451 as Hispanic in ethnicity. Five years after the flood, these figures had changed to 817,748 total population, of whom 416,232 were white; 327,972 were black; 27,562 were Asian, and 75,397 were Hispanic.10 When their centroids are plotted, they show that metro residents as a whole, and each racial/ethnic sub-group, shifted westward and southward between 2000 and 2010, away from the location of most of the flooding and away from the source of most of the surge, which generally penetrated the eastern and northern (lakeside) flanks of the metropolis.

Did populations proactively move away from risk? Not quite. What accounts for these shifts is the fact that the eastern half of the metropolis bore the brunt of the Katrina flooding, and the ensuing destruction meant populations here were less likely to reconstitute by 2010, which thus nudged centroids westward. Additionally, flooding from Lake Pontchartrain through ruptures in two of the three outfalls (drainage) canals disproportionally damaged the northern tier of the city, namely Lakeview and Gentilly. Combined with robust return rates in the older, higher historical neighborhoods along the Mississippi, as well as the unflooded West Bank (which sit to the south and west of the worst-damaged areas), they abetted a southwestward shift of the centroids. In a purely empirical sense, this change means more people now live in less-exposed areas. But, as we saw with the vertical shifts, the movements are more a reflection of passive responses to flood damage than active decisions to avoid future flooding.


Figure 2. Population centroids by race and ethnicity for metro New Orleans, 2000-2010; see next figure for detailed view. Analysis and maps by Richard Campanella.


Figure 3. A closer look at the metro-area population centroid shifts by race and ethnicity, 2000-2010; analysis and map by Richard Campanella.

Reflections

Resettlement patterns in metro New Orleans have only marginally reduced residential exposure to the hazard of storm surge. In the vertical dimension, metro-area residents today occupy below-sea-level areas at only a slightly lower rate than before the deluge, 61 percent as opposed to 62 percent, although that change represents the first-ever reverse (decline) of the century-long drift into below-sea-level areas. Likewise, residents’ horizontal shifts, which were in southwestward directions, seemed to suggest a movement away from hazard, but these shifts were more a product of passive than active processes .

Metro New Orleans, it is important to note, has substantially reduced its overall risk—but mostly thanks to its new and improved federal Hurricane & Storm Damage Risk Reduction System (HSDRRS) rather than shifts in residences. No longer called a “protection” system, the Risk Reduction System is a $14.5 billion integrated network of raised levees, strengthened floodwalls, barriers, gates, and pumps built by the U.S. Army Corps of Engineers and its contractors to protect the metropolis from the surges accompanying storms with a 1-percent chance of occurring in any given year.11 The HSDRRD, which worked well during Hurricane Isaac’s surprisingly strong surge in 2012, has given the metropolis a new lease on life, at least for the next few decades. But all other risk drivers—the condition of the coastal wetlands, subsidence and sea level rise, social vulnerability, and, as evidenced in this paper, exposure—have either slightly worsened, only marginally improved, or generally remained constant.

The exposure-related patterns reported here reflect who won the “Great Footprint Debate” ten years ago.12 Months after Katrina, when it became clear that no neighborhoods would be closed and the urban footprint would persist, decisions driving resettlement patterns in the flooded region effectively transferred from leaders to homeowners. Rather inevitably, the laissez faire rebuilding strategy proved to be exactly that, and people generally repopulated areas they had previously occupied, though at markedly varied densities.

Ten years later, the resulting patterns are a veritable Rorschach Test. Some observers look to the 75-90 percent repopulation rates of certain flooded neighborhoods and view them as heroically high, proof of New Orleanians’ resilience and love-of-place. Others point to the 25-50 percent rates of other areas and call them scandalously low, evidence of corruption and ineptitude. Still others might point to the thousands of scattered blighted properties and weedy lots and concede—as St. Bernard Parish President David Peralta admitted on the ninth anniversary of Hurricane Katrina—that “we probably should have shrunk the footprint of the parish at the very beginning.”13

As for the HSDRRS, continual subsidence and erosion vis-à-vis rising seas, coupled with costly and as-yet undetermined maintenance and certification responsibilities, will gradually diminish the safety dividend provided by this remarkable system. The nation’s willingness to pay for continued upkeep, meanwhile, may grow tenuous; indeed, it’s not even a safe bet locally. Voters in St. Bernard Parish, which suffered near-total inundation from Katrina, defeated not once but twice a tax to pay for drainage and levee maintenance, a move that may well increase flood insurance rates.14

Residents throughout the metropolis appear to be repeating the same mistakes they made during the twentieth century: of dismissing the importance of natural elevation, of over-relying on engineering solutions, of under-maintaining these structures in a milieu of scarce funds, and of developing a false sense of security about flood “protection.”

We need to recognize the limits of our ability to neutralize hazards—that is, to presume that levees will completely protect us from storm surges—while appreciating the benefits of reducing our exposure to them. Beyond the metropolis, this means aggressive coastal restoration using every means available as soon as possible, an effort that may well require some expropriations. Within the metropolis, it means living on higher ground or otherwise mitigating risk. In the words of University of New Orleans disaster expert Dr. Shirley Laska, “mitigation, primarily elevating houses, is [one] way to achieve the affordable flood insurance…. It is possible to remain in moderately at-risk areas using engineered mitigation efforts, combined with land use planning that restricts development in high-risk areas.”15

Planning that restricts development in high-risk areas: this was the same reasoning behind the “shrink the urban footprint” argument of late 2005—and anything but the laissez faire strategy that ensued.

Bio

Richard Campanella, a geographer with the Tulane School of Architecture, is the author of “Bienville’s Dilemma,” “Geographies of New Orleans,” “Delta Urbanism,” “Bourbon Street: A History,” and other books. His articles may be read at http://richcampanella.com , and he may be reached at rcampane@tulane.edu or @nolacampanella on Twitter.

Acknowledgements

The author wishes to thank Gulf of Mexico Program Officer Kristin Tracz of the Walton Family Foundation, Dr. Shirley Laska, and the Gulf Coast Restoration Fund at New Venture Fund, and Tulane School of Architecture, as well as Garry Cecchine, David Johnson, and Mark Davis for their reviews.

1 David Crichton, “The Risk Triangle,” in Natural Disaster Management, edited by J. Ingleton (Tudor Rose, London, 1999), pp. 102-103.

2 In this paper, “metro New Orleans” means the conurbation (contiguous urbanized area shown in the maps) of Orleans, Jefferson, western St. Bernard, and upper Plaquemines on the West Bank (Belle Chasse); it excludes the outlying rural areas of these parishes, such as Lake Catherine, Grand Island, and Hopedale, and does not include the North Shore or the river parishes.

3 Brad Pitt, as cited in “Make It Right—History,” http://makeitright.org/about/history/, visited February 13, 2015.

4 Richard Campanella, Bienville’s Dilemma: A Historical Geography of New Orleans and Geographies of New Orleans (University of Louisiana Press, 2006, 2008); R. Campanella, Delta Urbanism: New Orleans (American Planning Association, 2010); R. Campanella, “The Katrina of the 1800s Was Called Sauve’s Crevasse,” Times-Picayune, June 13, 2014, and other prior works by the author.

5 H. W. Gilmore, Some Basic Census Tract Maps of New Orleans (New Orleans, 1937), map book stored at Tulane University Special Collections, C5-D10-F6.

6 Richard Campanella, Bienville’s Dilemma: A Historical Geography of New Orleans (University of Louisiana Press, 2008) and other prior works by the author.

7 Coincidently, 38 percent of all residents of the contiguous metropolis south of Lake Pontchartrain also lived above sea level in 2000. Thus, at both the city and metropolitan level, three out of every eight residents lived above sea level and the other five resided below sea level. All figures calculated by author using highest-grain available historical demographic data, usually from the U.S. Census, and LIDAR-based high-resolution elevation data captured in 1999-2000 by FEMA and the State of Louisiana.

8 Henry J. Kaiser Family Foundation, “New Orleans Five Years After the Storm: A New Disaster Amid Recovery” (2010), http://kaiserfamilyfoundation.files.wordpress.com/2013/02/8089.pdf

9 Defining the study area is essential when reporting centroids. New Orleans proper, the contiguous metro area, and the Metropolitan Statistical Area, which includes St. Tammany and other outlying parishes, would all have different population centroids. This study uses the metro area south of the lake shown in the accompanying maps. It is also important to use the finest-grain—that is, highest spatial resolution—demographic data to compute centroids, as coarsely aggregated data carries with it a wider margin of error. This study uses block-level data from the decennial U.S. Census, the finest available.

10 Figures do not sum to totals because some people chose two or more racial categories while others declined the question, and because Hispanicism is viewed by the Census Bureau as an ethnicity and not a race.

12 Richard Campanella, Bienville’s Dilemma: A Historical Geography of New Orleans (University of Louisiana Press, 2008), pp. 344-355.

13 David Peralta, as quoted by Benjamin Alexander-Bloch, “Hurricane Katrina +9: Smaller St. Bernard Parish Grappling with Costs of Coming Back,” Times-Picayune/NOLA.COM, August 29, 2014.

14 Mark Schleifstein, “St. Bernard Tax Defeat Means Higher Flood Risk, Flood Insurance Rates, Levee Leaders Warn,” Times-Picayune/NOLA.COM, May 4, 2015, http://www.nola.com/environment/index.ssf/2015/05/st_bernard_tax_defeat_means_hi.html ; see also Richard Campanella, “The Great Footprint Debate, Updated,” Times-Picayune/NOLA.COM, May 31, 2015.

15 Shirley Laska, email communication with author, April 12, 2015.

Presidential Candidate Jim Webb is an Old-time Democrat

$
0
0

Will Rogers famously stated, “I am not a member of any organized political party. I am a Democrat.” And he was not so far from the truth. The old Democratic Party was a motley collection of selected plutocrats, labor bosses, Southern segregationists, smaller farmers, urban liberals and, as early as the 1930s, racial minorities. It was no doubt a clunky coalition but delivered big time: winning World War II, pushing back the Soviet Union and making it to the moon while aiding tens of millions of Americans to ascend into the middle class.

Only one Democratic candidate in the 2016 presidential race, James Webb, represents this old coalition. A decorated combat veteran, onetime Reagan Navy secretary and former U.S. senator from Virginia, Webb, 69, combines patriotism with a call for expansive economic policies to help the middle class. He speaks most directly to white working-class voters, particularly in places like Appalachia, the South and in rural hamlets and exurbs across the country, precisely where Democrats are now regularly thrashed in elections.

Webb, notes the National Journal, combines “Elizabeth Warren’s passion for economic justice with Rand Paul’s itch to reinvent foreign policy.” After all, the former soldier was one of the harshest critics of George W. Bush’s disastrous Iraq invasion.

Yet, so far, his candidacy is attracting little to no mention in the media. Part of the problem may lie with the fact that he most identifies with an America – white, rural or suburban – disdained or ignored by the official press. Many current Democrats not only dislike these constituencies, but don’t even want to deal with them, counting, instead, on their coalition of the affluent, minorities and millennials to carry the day.

Read the entire piece at The Orange County Register.

Joel Kotkin is executive editor of NewGeography.com and Roger Hobbs Distinguished Fellow in Urban Studies at Chapman University, and a member of the editorial board of the Orange County Register. He is also executive director of the Houston-based Center for Opportunity Urbanism. His newest book, The New Class Conflict is now available at Amazon and Telos Press. He is also author of The City: A Global History and The Next Hundred Million: America in 2050. He lives in Orange County, CA.

Jim Webb photo by flickr user kalexnova.

Blaming Foreigners for Unaffordable Housing

$
0
0

In a number of Western world cities, there is rising concern about foreign housing purchases which may be driving up prices for local residents. Much of the attention is aimed at mainland Chinese buyers in metropolitan areas where housing is already pricier than elsewhere. The concern about housing affordability is legitimate. However, blaming foreigners misses the point, which is that the rising prices are to a large degree the result of urban containment policies implemented by governments.

London and the United Kingdom              

The Daily Mail reports that London being deluged with foreign house buyers, who are buying not only expensive properties but also "starter homes," driving prices up. The Mail singles out Russian and Chinese buyers, many of whom pay cash for their purchases. Paula Higgins of the Home Owners Alliance lamented the fact that many foreign buyers are paying cash.  She questions the appropriateness of foreign investment in "family homes." David King, of Priced Out, said: "Foreign investment is driving up prices, making it even harder for ordinary people to get a decent place to live."

Real estate firms headquartered in Russia are steering their clients to less expensive locations, outside London, such as to the north of England and Wales. A London real estate firm said that only 15% of its sales were to buyers from the UK. There is pressure for the government to protect local home buyers

Certainly these investors are stepping into an already pricey market. The 11th Annual Demographia International Housing Affordability Survey found London house prices to be a severely unaffordable 8.5 times household incomes in 2014. London has the seventh worst housing affordability out of the 86 major markets rated in nine nations. The outside-the-greenbelt exurbs of London have house prices 6.9 times incomes.

Vancouver

Vancouver is a city of immigrants. According to data compiled by University of British Columbia (UBC) Geography Professor David Ley, nearly 90 percent of metropolitan Vancouver's growth over the past two decades has been from foreign immigration (this article contains a graph with the numbers). Yet, there is significant concern about home purchases in the Vancouver area by mainland Chinese. UBC Professor Henry Yu's history class described the issue in a video (Blaming the Mainlander).

The Demographia International Housing Affordability Survey found Vancouver house prices to be a severely unaffordable 10.6 times household incomes in 2014. Vancouver has the second worst housing affordability out of the 86 major metropolitan areas rated in nine nations. Hong Kong has the worst housing affordability, with a median multiple of 17.0.

California and New York

Ilya Marritz of Public Broadcasting Systems (PBS) radio station WNYC remarked on how foreign investment is driving up prices in the New York and San Francisco bay areas: "There’s this relatively new trend of people buying properties in the city and not actually spending a lot of time living here." The Demographia International Housing Affordability Survey found New York metropolitan area housing to cost 6.1 times incomes, a 65% increase since before the housing bubble.

The Diplomat, which specializes in Asia-Pacific affairs, commented that “there’s no doubt that China’s presence in the Bay Area market is driving up prices. The Diplomat quoted real estate executive Mark McLaughlin; “it’s added a demographic of buyers who, generally, take a long-term view. They’re not sellers in the next five to seven years.” Chinese buyers are sitting on much of this property as housing in the Bay Area becomes increasingly scarce, causing its value to skyrocket."

The Demographia International Housing Affordability Survey places both San Francisco and San Jose metropolitan area house prices at 9.2 times incomes, tied for fourth least affordable in the 9 nations.

The Los Angeles Times reports strong mainland Chinese purchasing activity in the suburbs of Los Angeles, from the San Gabriel Valley to Orange County, particularly Irvine as well as in Riverside-San Bernardino (the Inland Empire).

The Demographia International Housing Affordability Survey found house prices to be 8.0 times incomes in Los Angeles, the 10th least affordable major metropolitan area in the Survey. Nearby San Diego prices are even higher, at 8.3 times incomes, earning it the 8th least affordable major metropolitan area in the 9 nation Survey.

New Zealand

Things have become more heated in New Zealand. The Labour Party opposition housing spokesperson Phil Twyford blamed foreign investors for driving up house prices in Auckland, New Zealand's only metropolitan area with more than 1,000,000 population.

"Kiwi families who are struggling to buy their own home want to know the impact offshore speculators are having on skyrocketing Auckland house prices. They are sick and tired of losing homes at auction to higher bidders down the end of a telephone line in another country."

This evoked considerable criticism for ethnic insensitivity not only among New Zealand's large Chinese minority, but also ordinary citizens. Radio New Zealand opined: "For a party that has diligently and deliberately courted the ethnic vote, including the Chinese community in Auckland, this was a risky strategy." The Economics Minister accused Labour of playing "the race card." There was predictable reaction in China, which is New Zealand's largest goods export partner. The Shanghai Daily headlined: "New Zealand housing market debate descends into race row. "Meanwhile, the National Party government continues its difficult task of trying to reverse the consequences of urban containment policy in Auckland.

The Demographia International Housing Affordability Survey found Auckland house prices to be a severely unaffordable at 8.2 times household incomes in 2014. Auckland has the ninth worst housing affordability out of the 86 major metropolitan areas rated in nine nations.

Australia

In Sydney, the Party for Freedom produced a brochure "blaming Chinese property buyers for pushing up home prices, 'ethnically cleansing' Australian families from their suburbs and creating a new 'stolen generation,'" according to The Sydney Morning Herald (" Race hate flyer distributed in Sydney's north shore and inner city"). The brochure also referred to foreign purchasers as "greedy foreign invaders," and charged them with "pricing locals out of the market." A You-Tube video was posted in which the party chairman burns the flags of China, the Australian ruling Liberal Party, the Labor Party and the Greens and images of Australia's Prime Minister and the New South Wales Premier.

Predictably, this brought a sharp reaction from public officials, such as Lane Cove mayor David Brooks-Horn, whose affluent North Shore community was targeted for distribution of the brochures.

Despite this "vile attack," as New South Wales Multiculturalism Minister characterized it, there remains serious concern in Australia about rising house prices, which many blame on foreign investors aalthough avoiding the extremes indicated above.

The Demographia International Housing Affordability Survey found Sydney house prices to be a severely unaffordable 9.8 times household incomes in 2014. This is the third most unaffordable market among the 86 major metropolitan areas rated in nine nations.  Today, The Australian Financial Review reported that the median house price in Sydney has reached $1,000,000 for the first time. This is a 23% increase in just one year.

Melbourne, with prices 8.7 times incomes is sixth least affordable.

"Supply, Supply, Supply"

There is a common theme among those who are blaming foreigners for the escalation in their local house prices: foreign buyers have driven up demand, thus increasing prices and driving local purchasers out of the market. That might be a plausible theory if demand by itself raised prices. But, all else equal, demand results in higher prices only when there is a shortage of supply. And a shortage of supply is exactly what has been produced by government policies in each of the metropolitan areas described above.

The problem lies largely with the blunt policy instrument of urban containment, which makes it virtually impossible to build on wide swaths of suburban greenfield land. Urban containment policy's most destructive strategies are urban growth boundaries or greenbelts, which often prohibit development on virtually all greenfield sites and other regulations that deny planning permission on the majority of parcels suitable for housing on and beyond the urban fringe. The shortage of supply so important to the price increases has been produced by government policies in each of the metropolitan areas described above (Figure).

The problem is that urban containment policy "creates its own weather." Investors are disproportionately drawn to markets where there are shortages. Sir Peter Hall and his colleagues pointed out that development plans provide a guide for developers of where to buy within the metropolitan area (in The Containment of Urban England).

A Canary Wharf buyer in London told The Wall Street Journal: “If I could afford it I’d buy as many as I could”... “Flats [in London] are a great investment. I can’t see that changing." Nor will it so long as the "sure thing" of extraordinary house price increases supported by planning policy continues. San Francisco Bay Area public officials may as well have hung a "Welcome Speculators" banner from the Golden Gate Bridge.

James Laurenceson, Deputy Director of the Australia-China Relations Institute at the University of Technology in Sydney, told The Sydney Morning Herald.:

"Housing affordability is a real problem. The real reasons are right in front of our eyes - limited land releases, zoning regulations, development charges, record low interest rates and tax breaks to property investors. There’s not a Chinese buyer amongst them."

Indeed, most of the cities above became severely unaffordable well before an affluent middle-class was enabled by China's economic reforms.

New South Wales Premier Mike Baird characterized the solution as "supply, supply, supply," which he sees as "the principal lever" for improving housing affordability. Housing affordability proposals that do not start with the supply shortage are little more than empty rhetoric. Attempts to blame the prices primarily on foreigners are not only misleading, but also diverts the public from the more important role played by limiting supply.

Wendell Cox is Chair, Housing Affordability and Municipal Policy for the Frontier Centre for Public Policy (Canada), is a Senior Fellow of the Center for Opportunity Urbanism (US), a member of the Board of Advisors of the Center for Demographics and Policy at Chapman University (California) and principal of Demographia, an international public policy and demographics firm.

He is co-author of the "Demographia International Housing Affordability Survey" and author of "Demographia World Urban Areas" and "War on the Dream: How Anti-Sprawl Policy Threatens the Quality of Life." He was appointed to three terms on the Los Angeles County Transportation Commission, where he served with the leading city and county leadership as the only non-elected member. He served as a visiting professor at the Conservatoire National des Arts et Metiers, a national university in Paris. 

Photograph: Opera House, Sydney (by author).


The Cities Leading A U.S. Manufacturing Revival

$
0
0

Manufacturing may no longer drive the U.S. economy, but industrial growth remains a powerful force in many regions of the country. Industrial employment has surged over the past five years, with the sector adding some 855,000 new jobs, a 7.5% expansion.

Several factors are driving this trend, including rising wages in China, the energy boom and a growing need to respond more quickly to local customer demand and the changing marketplace.

To generate our rankings of the best places for manufacturing jobs, we evaluated the 373 metropolitan statistical areas for which the U.S. Bureau of Labor Statistics has complete data over the past decade. Our rankings factor in manufacturing employment growth over the long term (2003-14), medium term (2009-14) and the last two years, as well as momentum.

The Rust Belt Is Back

No part of America suffered more from the de-industrialization of the past 40 years than the Great Lakes states. Yet as manufacturing  has come back, particularly the auto industry, many of the region’s economies have begun to resurge. Despite all the fashionable chatter over the question of whether we’ve reached “peak car,” the auto industry has enjoyed six straight years of increased sales, driven by low interest rates, the need to replace older cars and rising consumer confidence.

The epicenter of this trend is exactly where the industrial decline hit hardest: Michigan, which sweeps the top three places on our list of the big cities generating the most new manufacturing jobs. The state has now recovered about 40% of the manufacturing jobs it lost during the recession. The Detroit-Dearborn-Livonia metropolitan area ranks No. 1 among the country’s 70 largest metropolitan areas for manufacturing employment growth over the time period for our study. Since 2009 the Detroit area has seen a remarkable 31.3% rebound to 89,300 industrial jobs, including a 9.8% expansion last year. This growth has helped begin to reverse a long-standing decline in employment overall—still down 12.3% since 2003—with overall employment up 5.9% since 2009.

Detroit’s recovery is not just a matter of inertia, but reflects a unique combination of circumstances. The area is home not only to many skilled workers, but boasts the second largest concentration of engineers among the country’s 85 largest metro areas, behind only Silicon Valley.

In second place is Warren-Troy-Farmington, in the Detroit suburbs, where manufacturing employment is up 38.8% since 2009. In third place is Grand Rapids-Wyoming, a longtime furniture-making hub where an uncommonly high share of jobs is in manufacturing, one in five; the metro area has seen industrial employment rebound 27.9% since 2009.

Another Midwest hotspot has been Toledo, Ohio, only 60 miles from Detroit, which ranks first among the mid-sized cities we evaluated, with a 17.4% jump in industrial employment since 2009.

Southern Cooking

The other big cluster of industrial hotspots is in the Southeast. Manufacturing has been heading to the region for several decades, recently primed by  major investments from German and Japanese companies, among others. A prime example is Nashville-Davidson-Murfreesboro, Tenn., No. 4 on our list, where manufacturing employment has jumped 23.9% since 2009. Japan’s Nissan and Bridgestone have establishing manufacturing plants in Central Tennessee, which has also created opportunities for small domestic parts companies in the region. Nissan also relocated its U.S. headquarters to the area in 2006 from Southern California. And domestic auto makers are have become major players in the Southeast—Ford employs some 14,000 in the Louisville, Ky., area, which checks in at No. 7 among our largest MSAs. The South, notes a recent Brookings study, now has the highest number of workers in the country employed in “advanced industries,” which tend to be the higher paying, more technically oriented parts of the factory economy.

Other areas that have become primary places for new industrial investment include such Deep South locations as Savannah, Ga., No. 2 on our mid-sized list, as well as No. 8 Columbia, S.C., a major center for German car companies, and No. 10 Charleston, S.C., which has benefited from the expansion of Boeing and aerospace suppliers there. These areas missed much of the  industrial revolution a century ago but are playing an impressive game of catch-up. Each has seen their industrial workforces grow over 20% since 2009. Other southern stars include Cape Coral-Ft Meyers, Fla., No. 4 on our mid-sized city list. Our small cities list also turns up Southern outperformers:  No. 2 Naples-Immokalee-Marco Island and No. 3 Sebastian-Vero-Beach, Fla.

The Energy Belt

Falling oil prices may be causing the oil and gas industry to rein in exploration and drilling budgets, but it provides an enormous boon for downstream industries such as refining and petrochemicals. This could keep industrial job growth going in two of our top MSAs that are in the oil patch.  Oklahoma City, where manufacturing job growth has soared 23.1% since 2009, ranks sixth, and  Houston, where the industrial workforce has expanded 19.8% over the same time  span, ranks ninth. Houston now is home to 257,300 manufacturing jobs, the third largest concentration in the country.

As in Detroit, Houston’s industrial rise is powered by more than by brawn. The area ranks sixth among the nation’s major metros in number of engineers per capita. If the Bay Area is master of the digital economy, Houston ranks as the technological leader of the material one; it is the capital for the energy-driven revival of U.S. industry.

Smaller energy-rich areas that have also experienced rapid industrial growth. These include two Louisiana metro areas, No. 3 Baton Rouge and No. 7 Lafayette, third and seventh, respectively on our mid-sized metro area list, as well as Midland, Texas, fifth on our small areas list. Perhaps most surprising, given its location in anti-carbon California, has been the steady growth in Bakersfield,  which stands fifth on the mid-sized list and is home to some of the nation’s largest oil fields. With 20.3% industrial growth since 2009, the area, sometimes known as “little Texas,” is the only metro area in the Golden State to make it to the top 10 in either the large or mid-sized list.

A Shift To Smaller Cities

Once American industry was identified predominately with big cities: New York in 1950, according to economic historian Fernand Braudel, had the largest industrial economy in the world, employing a million workers, mostly at small manufacturers. In the 1970s and 1980s, the industrial zeitgeist moved increasingly to Los Angeles, which vied with Chicago as the largest center for factory jobs.

Today this pattern is changing dramatically. Besides the move toward the south and energy hotbeds, industry has been expanding in smaller cities as well as suburban areas beyond the core cities, says University of Washington geographer Richard Morrill. This is not unique to the United States; Germany, which has perhaps the most admired industrial sector in the world, also has dispersed its industrial base, largely to smaller cities.

The reasons for this shift vary, from strict environmental laws in Northern cities, as well as stronger unions, and cheaper land elsewhere.

For example, although the New York state capital Albany ranks fifth on our big metro area list, driven in large part by semiconductor manufacturing, New York City stands at a weak 62nd out of 70. Since 2009, New York has lost 3.3% of its manufacturing jobs; the city’s industrial workforce now stands at a paltry 74,700, a dramatic decline from some 400,000 as recently as the early 1980s.

Yet with its powerful array of media, business service and hospitality businesses, New York appears to be able to withstand deindustrialization more than the two largest industrial MSAs, Chicago and Los Angeles. The one-time “city of big shoulders“ and its environs has also lost industrial jobs since 2009, down to 278,000 from 286,500 in 2011, and a far cry from the 461,600 it had in 2000.

The decline has been, if anything, more rapid in 59th place Los Angeles. This process began with the loss of more than 90,000 aerospace jobs since the end of the Cold War. Los Angeles’ industrial job count stands at 363,900 — still the largest in the nations but down sharply from 900,000 just a decade ago.

Does Industrial Growth Still Matter?

Clearly deindustrialization has a bigger impact in some areas than others. Cities like San Francisco and New York appear better positioned for the post-industrial transition than Chicago or Los Angeles, where manufacturing lingered longer and the elite service or tech industries are not nearly as predominant. Yet the impact of industrial decline — or resurgence — may be more important in the future than many suppose.

This is particularly critical for blue-collar workers, for whom industrial jobs tend to pay more. Welders and other skilled workers are increasingly in short supply, particularly as baby boomers begin to leave the workforce. Many of the cities which did well in our rankings are among the best in building new training partnerships with their industrial employers—these are skills that are decreasingly taught in the modern secondary and college curricula. In some places, vocational skills have recently been commanding higher post-graduation salaries than traditional college degrees.

Industrial growth also provides an opportunity for emerging cities, particularly in the South and the energy belt, to add to their employment base and, in some cases, their connections with international markets. Over-dependence on manufacturing, as the Rust Belt experience showed, can be dangerous, and the need to diversify employmentremains critical. Threats to future growth include the strong dollar, the decline in the energy sector and economic weakness abroad reducing exports.

But factory jobs remain an important asset for many regions. They may not be the central force they once were, but these jobs seem likely to continue making a big difference in the fates of many economies, both big and small.

Joel Kotkin is executive editor of NewGeography.com and Roger Hobbs Distinguished Fellow in Urban Studies at Chapman University, and a member of the editorial board of the Orange County Register. He is also executive director of the Houston-based Center for Opportunity Urbanism. His newest book, The New Class Conflict is now available at Amazon and Telos Press. He is also author of The City: A Global History and The Next Hundred Million: America in 2050. He lives in Orange County, CA.

Michael Shires, Ph.D. is a professor at Pepperdine University School of Public Policy.

Auto manufacturing photo by BigStockPhoto.com.

In Comparing Metro Areas, the Devil is in the Details

$
0
0

Frequently I see examples of metro areas comparing themselves to other, more successful metro areas.  Metro area movers and shakers take a deep dive into the intricacies of what makes a "good" place tick, and try to implement the takeaways in their metro.  This is a reasonable action, but I believe it misses the point.  There is more to examine by taking a deep dive within your own metro than looking at another.

Surely there are physical scale, density and economic differences between metro areas that are worth exploring.  But those differences can be overstated.  Milwaukee, for example, will never be the Silicon Valley, for a host of reasons. Just as importantly, the reverse is true. 

When I see that, say, Kansas City wants to do what Portland's doing, or Grand Rapids wants to do what Nashville's doing (totally fabricated examples, I might add), I cringe for three reasons -- 1) distinctiveness, not homogeneity, should be the hallmark of cities and metro areas; 2) metro areas are already far more alike than different, in terms of their built environment and even their economies; and 3) there is more inequality that is evident within metro areas than between them.

Why is it that, when looking at the marketplace of metros, they try to emulate successes rather than striking out for distinctiveness?  This generally stands in opposition to what happens in business, where firms seek to deliver a product that is of better quality, or less expensive, or offers more options, in order to stand out in the marketplace. 

Unfortunately we end up having metro areas chasing advantages they will never be able to attain.  The Bay Area's combination of entrepreneurship and top-tier education, leading to the R&D work that supports Silicon Valley, is only tangentially replicable in a handful of metros nationwide.  The low-tax, low-cost advantage that many interior metro areas enjoy over their coastal brethren is not something that can be done in the high-tax, high-cost coastal metros.

Addressing the third point will lead to greater city and metro growth than trying to replicate what any other metro area purports to be doing at a metro scale.

Let me offer one example.  Below you'll see a table that shows the top 25 metro areas from 2010, organized by median household income.  The data is from the Census Bureau's American Community Survey in 2011 (although there is more recent data available, the reason for using this dataset will become clearer below):


Median household income for the top 25 metro areas falls within a fairly narrow range.  Together, the metros have a median of medians, if you will, of $57,783, with a standard deviation of about $7,300.  The Tampa/St. Petersburg metro area comes in at the lowest ($46,890), while San Francisco/Oakland comes in as the highest ($76,911). 

At the metro level, there are easy answers to explain why some metro areas are where they are -- the supercharged, tech-driven or eds-and-meds economies lift San Francisco and Boston, while the presence of larger numbers of retirees in some Sun Belt metros, and deindustrialization that saw jobs move away, depresses incomes in Tampa, Miami, Pittsburgh or Detroit. 

It's data like this that reinforces the simple tropes that drive our understanding of metro areas.

But what if we look within a metro area?

I have a dataset that has 2011 American Community Survey data for 283 municipalities within the Chicago metro area, as well as the 55 zip codes that comprise the city of Chicago.  This data covers about 8.5 million of the 9.5 million within the broader metro area, excluding a handful of outlying exurban counties in Illinois as well as a few counties in Indiana and Wisconsin.  By looking at finer grained data that examines municipalities, and breaks down the behemoth that is the region's core city of Chicago, we can see how there are greater differences within the a metro area than between them.

Median household income falls within a far broader range within the Chicago area than in the top 25 MSA dataset.  In 2011, the median of median household incomes for the 338 places identified was $68,325, which is completely understandable when one considers higher income suburban municipalities being over-represented in the dataset.  The range, however, is what stands out -- the highest median household income was in North Shore Kenilworth ($242,188) while the lowest was in Chicago's 60621 zip code, which corresponds with the city's Englewood neighborhood ($19,692).  What's crazy, though, is that the standard deviation for median household income in the Chicago area in 2011 ($32,700) is nearly double the actual number for the 60621 zip code. 

There were 68 municipalities and city zip codes that had median incomes below $50,000 in 2011; there were 54 municipalities and city zip codes above $100,000.  One group presently drives metro area economic policymaking, while another remains largely ignored.

There is greater variation within metros than there is between them.  This idea should inform our urban policymaking.  (Note: I use Chicago only because I have the data for it.  I imagine other metros, particularly large ones, will have similarly large ranges; the range likely decreases as metros get smaller, but remains to some extent.)

For decades economic developers have relied on two economic strategies to improve conditions that influence data points like median household income -- 1) attract more skilled businesses and workers, and 2) work like hell to retain skilled businesses and workers. The first strategy works in metros that have relied on migration for growth; the second works almost nowhere.

As I see it, there is an opportunity for dramatic metro area improvement by those that focus on talent development, rather than talent attraction or retention.  When metro areas focus on the successes of our nation's metro area "winners", and try to implement a talent attraction/retention strategy, they relegate themselves to the whims of a select group who, for a variety of reasons, can choose to be anywhere.  Developing talent -- investing in early, secondary and higher education, forging strong links between higher education and the business community, supporting entrepreneurship and investment -- can pay dividends.  At some point, metros that become proficient at talent development will find that that activity evolves into talent attraction, creating the vibrant economic environment that all metros desire.

Pete Saunders is a Detroit native who has worked as a public and private sector urban planner in the Chicago area for more than twenty years.  He is also the author of "The Corner Side Yard," an urban planning blog that focuses on the redevelopment and revitalization of Rust Belt cities.

Lead photo: View of the Life Sciences Complex, UB School of Medicine at the University at Buffalo, with downtown Buffalo, NY in the background.  Panoramas such as this can make any place look fantastic, but the devil is in the details.  Source: medicine.buffalo.edu.

The Geography of Ideology Ultra R, Ultra D and 50 to 50

$
0
0

Recently I grouped all US counties into several categories, from True Believers R and D, R and D leaning groups, and also those areas that are more equally divided. In anticipating the 2016 election, I take here a brief look at a small number of counties (2012 data) that are extreme cases of R voting (over 90%, 28 counties), of D voting (over 80%, 26 counties), and of 50:50 voting (39 counties from 49.7 to 50.3 D vote). These are also shown on the maps. Note that the D counties in blue don’t look impressive, as they are small in area, but big in votes. How do these three sets differ in geography and in character?

Set 1: Ultra Republican

The extreme R counties are an amazing set. Ten of the 28 (8 in Utah, 2 in Idaho) are dominantly Mormon. The non-Mormon counties include 17 scattered across the high plains from Montana, 1, Nebraska, 3, Kansas, 1, Oklahoma 1, and 11 in Texas, with one outlier in eastern Kentucky. Only one is east of the 100th Meridian, famous for dividing east and west in the US. All these counties are basically conservative on social issues.

Overall densities are far lower and rural shares far higher than for the other sets. They are overwhelmingly white (92%) and less than 1% black on average. They have the highest shares of husband-wife families, with and without children, and the lowest shares of single parent families, roommates and singles. For example the black population is essentially 0 in half the counties. Husband-wife and children households ae exceptionally high in 5 counties: Franklin, ID; and Duchesne, Morgan, Sevier, and Uintah Utah—all Mormon. The roommate share is under 2 percent in 7 counties, compared to a national average of almost 5.

Male labor force participation averages a high 73% and unemployment a low 3.8%. As expected for these locations, farming is a frequent occupation in these counties, exceeding 10% in 8 counties, as in MT, NE, and TX. Finally church attendance is far higher than in the other sets, averaging 71% compared to 48% in the set 2 counties.  

The Mormon counties exhibit some variation in size and settlement. Five are all rural, four are rural and small town (micropolitan), but one is a small metropolis, Utah county (Provo, with Brigham Young University), perhaps the heart of Mormon orthodoxy. The 18 non-Mormon counties include 13 small rural counties and 5 counties (all in Texas) with small cities.

Since the total vote in these counties was only 234,000 (76,000 without Utah county!) and 92% R, it is probably not worth a Democrat candidate spending much effort in these locales. Yet it is possible that without the “negativity” of race, an Anglo woman at the top of Democratic ticket should do better in conservative white settings. 

Set 2: Ultra Democratic   

The extreme D counties are similarly an amazing set, just in different dimensions. The dominant characteristic is the very high minority share – in all 26 counties – and correlated with that high shares of single parent families, unemployment, and general and especially child poverty. The minority share averages 81%, with 43% black. Thirteen have high black shares: mostly southern and rural, in AL, GA, MS, but also Washington, DC, Baltimore, and Prince George, MD. Four have high Hispanic shares: TX, NM, three Native American (ND, SD, WI), and six are more racially mixed: San Francisco and Alameda, CA, Philadelphia, and 4 New York city boroughs.

The second distinguishing feature is dense urban character and sheer size, but only for a subset of 12 counties, as 9 are rural or small town minority counties. The large urban counties include San Francisco, Alameda, Washington DC, Orleans, Prince George, Baltimore, St. Louis, Bronx, Kings, New York, Queens, and Philadelphia. These set 2 metropolitan counties are mainly coastal (plus St. Louis and Orleans),   while rural minority counties are mainly in the northern plains, (Native American) or the southern “Black belt”.

The small city minority counties are Macon, AL (Tuskegee), Hancock, GA, Taos, NM, Starr and  Zavala, TX,  Claiborne, Holmes and Jefferson, MS, and Shannon, SD, leaving only 3 totally rural counties, Greene, AL, Sioux, ND and Menominee, WI. 

These highest D counties also have the highest share of people 18-44, of singles and of roommate households, and the lowest in families, as well as being lowest in labor force participation and church attendance but highest in poverty and unemployment.

Even though highly Democratic, with a 2012 D vote of 4,000,000 to 700,000 R, the total vote is so large that it may be worth a fair Republican campaign effort simply to reduce the giant D margin, which was key to the 2008 and 2012 D wins. Without the dominance of race, Republicans might do better, if voter turnout of minorities falls.

Set 3: Balanced 50-50 counties

The set 3 counties with a 50:50 D and R split, are far more diverse and complex, as we might expect, and suggest how difficult they can be for candidates to create convincing messages!  These counties are intermediate in density and are quite high in shares of micropolitan territory, that is, independent small city counties.

Of the 39 counties, 6 are entirely rural (GA, IA, MS and WI (3)), while one (Harris-Houston) is a giant metropolitan core county with almost half the total vote of these set 3  counties. Five are suburban to large metro areas – in GA, MD, NJ, PA, and WA.  Five are small metropolitan areas, Lincoln, NE (Lancaster), Florence, SC, State College (Centre), PA, Montgomery, VA (Blacksburg), and Canton (Stark), OH. Thus 23 are small city micropolitan, with counties in AR, CA, CO, IL, IA, MD, MI, MN, MS, NC, OH, OR, SC, WA, and WI.

While the set 1 counties are all but one in the western half of the country, and the set 2 counties, coastal urban or southern rural-small town, the set 3 counties are most prevalent in the upper Midwest: IL 2, IA 5, MN 3, WI 5, MI 1, OH 1, and NE 1, almost half the counties, with another ten in the south, AR 1, MS 2, GA 2, SC 2, FL 1, NC 1, and VA, 1. The single largest cluster of these 50:50 counties is in northwestern Wisconsin, with an additional county across the state line in Minnesota.

In social and economic characteristics these counties tend to be intermediate between the set 1 and set 2 counties, for example averaging 22% minority (closer to set 1 than to set 2), but fairly high in a few counties in the south. They tend to be a little closer to the set 2 D set on the social dimension: shares of roommates, singles, and in religiosity, but closer to the set 1 R set in economic, income and job variables, as in higher labor force participation and lower poverty rates. 

Clearly these set 3 counties represent the impressive diversity of the more balanced areas of American electorate, where campaigning will be especially critical.


Table  1Differences between D, R and 50:50 Sets
Averages
VariableSet 1 RSet 2 DSet 3 50:50 
Age 18-44303933 
White923382 
Black0.74311 
Minority168122 
HW w children281120 
Single parent102916 
Singles223028 
Urbanized area35421 
UC (small city)181126 
Rural823253 
Male Labor Force Participation736269 
Unemploy3.812.27.3 
Services152217 
Farm711.7 
Churches/10041.51.8 
Poor132614.5 
Child Poor173618 


Conclusion

These counties are but a small sample of the 3,180 counties. Yet they represent the extreme drivers of a well-publicized American polarization, but also where we see a non-polarized America. The regional concentrations of the three helps illuminate the amazing differences in American cultural and political geography.

Richard Morrill is Professor Emeritus of Geography and Environmental Studies, University of Washington. His research interests include: political geography (voting behavior, redistricting, local governance), population/demography/settlement/migration, urban geography and planning, urban transportation (i.e., old fashioned generalist).

Latino Politicians Putting Climate Change Ahead of Constituents

$
0
0

Racial and economic inequality may be key issues facing America today, but the steps often pushed by progressives, including minority politicians, seem more likely to exacerbate these divisions than repair them. In a broad arc of policies affecting everything from housing to employment, the agenda being adopted serves to stunt upward mobility, self-sufficiency and property ownership.

This great betrayal has many causes, but perhaps the largest one has been the abandonment of broad-based economic growth traditionally embraced by Democrats. Instead, they have opted for a policy agenda that stresses environmental puritanism and notions of racial redress, financed in large part by the windfall profits of Silicon Valley and California’s highly taxed upper-middle class.

Nowhere in California is this agenda more clearly manifested than with state Senate President pro Tem Kevin de León, who represents impoverished East Los Angeles. De León has proclaimed addressing “climate change” as the Senate’s “top priority” and is calling for, among other things, disinvestment from fossil fuel companies. Rarely considered seem to be the actual impacts of these policies on the daily lives of millions of working- and middle-class Californians.

War on Blue Collar Jobs

Despite vastly exaggerated claims about the prospects for so-called green jobs since the passage of Assembly Bill 32, the landmark 2006 climate change law, California is adopting policies detrimental to growing the higher-wage blue-collar sector. Green policies favoring expensive alternative energy have fostered energy prices that, for industrial users, are an estimated 57 percent higher than the national average. No surprise, then, that California has produced barely half the rate of new manufacturing jobs as the rest of the nation.

Read the entire piece at the Orange County Register.

Joel Kotkin is executive editor of NewGeography.com and Roger Hobbs Distinguished Fellow in Urban Studies at Chapman University, and a member of the editorial board of the Orange County Register. He is also executive director of the Houston-based Center for Opportunity Urbanism. His newest book, The New Class Conflict is now available at Amazon and Telos Press. He is also author of The City: A Global History and The Next Hundred Million: America in 2050. He lives in Orange County, CA.

By Neon Tommy (Senator Kevin De Leon) [CC BY-SA 2.0], via Wikimedia Commons

The Evolving Urban Form: Jing-Jin-Ji (Dispersing Beijing)

$
0
0

China's cities continue to add population at a rapid rate, despite a significant slowdown in population growth. Although overall population is expected to peak around 2030, the urban population will continue growing until after 2050. China’s cities will be adding more than 250 million new residents in the next quarter century, according to United Nations projections. China's cities will add nearly as many people as live in Indonesia, the world's fourth largest country, more than live in Brazil and 10 times as many as live in Australia.

Two of China's six megacities (urban areas with more than 10 million population) are nearly adjacent, within 90 miles (150 kilometers) of one another. The urban areas of Beijing and Tianjin have a combined population of 35 million and are among the fastest growing in the world. This is an increase of nearly 60% from the 2000 population of 21 million.

The Jing-Jin-Ji Megalopolis

The faster growing of the two, Beijing, is the national capital. Beijing is encircled by five freeway standard ring roads or beltways. These are numbered 2 through 6, with the first ring road being surrounding the Forbidden City. Its population is served by a number of additional expressways and the world's longest subway. For some time there has been discussion of integrating the metropolitan areas of a much larger region. A principal purpose is dispersion --- to redistribute activities, such as government administration and manufacturing away from Beijing's congested core to peripheral locations.

Over the past year, there have been various announcements describing the process. The  megalopolis would be called Jing-Jin-Ji, and would be composed of Beijing, Tianjin and Hebei province. An alternative name would be the "Capital Economic Circle." The name, Jing-Jin-Ji is constructed of the last syllables of "Beijing" and "Tianjin," along with "ji," which is the pronunciation of the one character Mandarin abbreviation for Hebei.

The Need for Dispersal

Beijing has just become too dense and too crowded. Traffic congestion already is among the worst in the world. According to The Sydney Morning Herald, the situation has become so bad that officials intended to limit the population of the Beijing municipality (province) to 23 million, only slightly above the population that is nearing 22 million. They also intend to reduce the population of central districts by 15%.

Important steps are already being taken. Construction has begun on a new facility to house Beijing municipality functions in the suburban district ("qu") of Tongzhou. This subsidiary center is a 40 minute drive from the city center. Tongzhou borders the municipality of Tianjin and, according to the Beijing Municipality government is itself growing about one-quarter faster than the Beijing municipality itself.

There are also plans to move many of the manufacturing facilities that have located in Beijing to the other jurisdictions. The extent of the manufacturing dominance of Beijing is illustrated by the much larger "floating population," of Beijing, which consists of migrants from other parts of the country who lack local residence permission (hukou). According to data in the China Yearbook 2014, Beijing has more than double the ratio to its population of migrant workers as Tianjin and nearly 10 times the ratio of Hebei, which has more than two-thirds of the megalopolis population.

One large automobile manufacturer has already completed moving out of Beijing to Huanghua, a county level city in the Hebei municipality of Cangzhou, which borders Tianjin to the south.

Geography of Jing-Jin-Ji

The jurisdictions comprising Jing-Jin-Ji have approximately 110 million residents. The gross land area is approximately 216,000 square kilometers (83,000 square miles), approximately the land area of Romania or the US state of Idaho. No one, however, should imagine a Phoenix or Portland type sprawl of such a magnitude. As is indicated the Table, the overall population density of Jing-Jin-Ji is only 500 residents per square kilometer (1,300 per square mile).  The largest urban areas comprise only 3.5% of the land area, yet contain approximately 40% of the population. Despite the massive urbanization of Beijing and Tianjin, and the other large urban areas, Jing-Jin-Ji has a population that is 40% rural.


Components of Jing-Jin-Ji
JurisdictionTotal Population (2013)Density (per KM2)Principal Urban Area Population (2015)Urban Density (per KM2)
Beijing21.2     1,300 20.2     5,100
Tianjin14.7     1,200 10.9     5,400
Jing-Jin-Ji Core35.9     1,300 31.1     5,200
Baoding10.2        500 1.3     5,900
Langfang4.4        700 0.5     3,800
Canzhou7.2        500 0.5     3,800
Tangshan7.5        600 2.4     8,700
Zhangzhiakow4.6        100 1.2     9,200
Qinhuangdao2.9        400 1.0     6,500
Chengde3.7        100 0.1     4,300
Inner Jing-Jin-Ji40.5        300 7.0     6,600
Shijiazhuang10.4        700 3.4   17,000
Handan9.2        800 2.0   11,900
Xingtai7.1        600 0.7     6,000
Henshui4.3        500 0.4   11,800
Outer Jing-Jin-Ji31.0        600 6.5   12,500
Jng-Jin-Ji109.2        500 44.6     5,900
Population in millions.
Jurisdition population from government sources
Urban area population from Demographia World Urban Areas


The Nearby Urban Areas

In addition to Tianjin, other urban areas are expected to gain functions, jobs and residents from Beijing. Baoding, an urban area to the southwest of Beijing is expected to gain hospitals, educational institutions and government offices. Baoding has a population of 1.3 million and is a former capital Hebei, but was displaced by Shijiazhuang in 1967. Shijiazhuang, with a population of 3,4 million, is located  in the outer ring of Jing-Jin-Ji.

Langfang is unusual in being a discontinuous municipality, part of which is an enclave surrounded by Beijing and Tianjin (as is Hebei province), and the other part located to the south of both jurisdictions. Langfang is in the path of growth of both Beijing and Tianjin. The urban area of Langfang is still relatively small, with 500,000 residents. The urbanization along the Jingtang Expressway through Langfang nearly reaches the development of Beijing to the northwest and Tianjin to the southeast.

Tangshan is directly north of Tianjin and east of Beijing. Tangshan seems likely to benefit from the dispersion of functions, jobs and residences by virtue of its proximity to both of the megacities. A new high speed rail line has just been announced that would connect Tangshan with Beijing in 30 minutes. Tangshan gained international notoriety in 1976 when it was struck by a devastating earthquake (photo here) that virtually flattened the city and killed at least 240,000 people (estimates of the earthquake death toll reach 800,000). Tangshan has been completely rebuilt, with impressive modern architecture (photograph above, taken from an earthquake memorial), but not appreciated by all. One architectural critic has insensitively bloviated that the new architecture "has been more destructive to Tangshan’s urban history than the great earthquake." Today, Tangshan is an urban area of 2.4 million.

Qinhuangdao, an urban area of 1 million, lies just beyond (northeast of) Tangshan on the way to Shenyang and China's Dongbei (Manchuria). Qinhuangdao could profit from its well placed seaport.

Transportation Improvements

Important transportation improvements have been announced. There are plans to expand Beijing's subway, which already has the highest ridership in the world and is second longest (after Shanghai). New suburban train lines will be built and new high speed rail lines will connect the cities within Jing-Jin-Ji that are farther apart. There will be considerable expansion of the already comprehensive expressway system, including Beijing's seventh ring road, which is to be fully completed by 2017. Already, approximately 400 kilometers have been completed, much of it through the mountains to the west of Beijing.

Decentralizing Beijing

Jing-Jin-Ji would be China's third megalopolis, joining with the Yangtze Delta (centered on Shanghai) and Pearl River Delta (centered on an axis from Guangzhou to Shenzhen). But Jing-Jin-Ji is substantially different and not so obvious a candidate for integration. Jing-jin-ji's urban areas are located farther apart than in the Pearl or the Yangtze. Yet its concentration of development is greater, especially in the Beijing core, which provides much of the justification for decentralization.

Wendell Cox is Chair, Housing Affordability and Municipal Policy for the Frontier Centre for Public Policy (Canada), is a Senior Fellow of the Center for Opportunity Urbanism (US), a member of the Board of Advisors of the Center for Demographics and Policy at Chapman University (California) and principal of Demographia, an international public policy and demographics firm.

He is co-author of the "Demographia International Housing Affordability Survey" and author of "Demographia World Urban Areas" and "War on the Dream: How Anti-Sprawl Policy Threatens the Quality of Life." He was appointed to three terms on the Los Angeles County Transportation Commission, where he served with the leading city and county leadership as the only non-elected member. He served as a visiting professor at the Conservatoire National des Arts et Metiers, a national university in Paris. 

Photograph: Tangshan's modern architecture, from an earthquake memorial (by author)

The Incompetence Hypothesis to Explain the Great Recession

$
0
0

Seeking an understanding of the Great Recession, I am finding that most of the 2008 financial crisis and its aftermath can be explained by incompetence. In the final weeks of writing a book on the systemic failure in US capital markets, I had to re-read the Securities and Exchange Commission (SEC) Inspector General’s 2009 report on their failure to stop Bernard Madoff despite having received credible evidence of a Ponzi scheme. The inspector concluded that it did not have anything to do with the fact that an SEC assistant director was dating (and later married) Madoff’s niece; or that Madoff had held a Board seats at important financial regulators.* Despite eight substantive complaints and two academic journal research reports over 16.5 years about problems with Madoff’s investments, Madoff was never caught. In the end he turned himself in, admitting to a $64 billion Ponzi scheme. The inspector’s conclusion: incompetence.

In economics, ‘interest’ – whether it be self-interest or interest group pressure – is the ‘safe’ explanation for outcomes that are detrimental to the public. If interest group pressure (or even populism) is behind a bad policy decision, then it is not a ‘mistake.’ Rather, it is an intentional, rational decision as described by Chicago School economist and Nobel laureate George Stigler. However, if a policy decision is the result of bad judgment, then Stigler cannot explain it. Brazilian economist Luiz Carlos Bresser-Pereira suggests that the relevant variable in this case is incompetence. Incompetence is an independent explanatory variable; it cannot be explained in rational or historical terms.

Incompetence arises from three sources: 1) ignorance, 2) arrogance, or 3) fear. Policy advisors and regulators may be guilty of applying theories second-hand but with great authority and self confidence. They may be ignorant of the complexities of economic theory and they may apply abstract economic theories inappropriately to specific policy problems. For example, they allowed banks to engage in a wide range of investments under the financial theory of ‘diversification.’ That theory works for portfolios but not for businesses, which need to specialize to realize the gains from their comparative advantage. Financially derived theories like this were applied automatically, transformed into a series of clichés.

‘Diversification’ in a portfolio of financial investments lets you increase the returns while reducing the risk. But in business it means ‘splintering’ which destroys performance capacity and increases risk. Financial institutions are tools to be used in furthering the efforts of the broad economy: the more specialized financial institutions become, the greater their performance capacity. Increased productivity from specialization comes with better quality as businesses become more adept at their specific products and services. The differences in natural aptitudes and abilities produce economic benefits when tasks are matched to capabilities. The more experience a worker has at performing a task, they more efficient they become in doing the work. As management guru Peter Drucker wrote: ‘Organizations can only do damage to themselves and to society if they tackle tasks that are beyond their specialized competence.’

An example of an economic theory applied arrogantly is Washington’s constant fawning over ‘free market solutions’ when the rules, regulations and court decisions covering capital markets fill the bookshelves of law offices around the world. There is no such thing as a free market – no economist of value believes that the perfectly competitive market exists. The Wall Street Bailout is a good example of the third source of incompetence – fear. Consider this description of the exchange between Treasury Secretary Henry Paulson, Federal Reserve Chairman Ben Bernanke and the senior legislators from the House and Senate on Thursday, September 18, 2008:

Sen. CHRISTOPHER DODD: Sitting in that room with Hank Paulson saying to us in very measured tones, no hyperbole, no excessive adjectives, that, "Unless you act, the financial system of this country and the world will melt down in a matter of days. "

JOE NOCERA: Bernanke said, "If we don't do this tomorrow, we won't have an economy on Monday."

Sen. CHRISTOPHER DODD: There was literally a pause in that room where the oxygen left.

Inside the Meltdown, Frontline February 17, 2009, WGBH Educational Foundation, Boston. 

Regardless of the source of the incompetence, the visible results are 1) failure to take correct strategic policy decisions, and 2) failure to adopt well-designed reforms.

Policy decisions are the day-to-day management decisions that usually produce immediate results. In monetary policy, for example, these would be interest rate decisions. Interest rate policy decisions need to be made at the right time and to move rates in the right direction.

Reforms produce medium-term outcomes that may or may not require legislative approval. The Dodd-Frank Act, which was supposed to reform Wall Street and protect Main Street, in reality created very little change but suggested that financial regulators reform their own rules. Poor reforms may be the result of incompetent designs and not just pressure from interest groups, although this also happens.

Bresser-Pereira’s analysis offers one more alternative explanation for the cause of bad policy and reforms. Between interest and incompetence lies ‘confidence building.’ It is simply doing what is expected in an effort to gain the confidence of financial supporters. If we substitute “Goldman Sachs” for “United States” and “Wall Street” for “developed countries” in this quote from Bresser-Pereira, then his description of ‘confidence building’ is as true of Washington, D.C. as it is of Brazil:

‘They do not limit themselves to seeing the United States and, more broadly, the developed countries, as richer and more powerful nations, whose political institutions and scientific and technological development should be imitated. No, they see the elites in the developed countries both as the source of truth and as natural leaders to be followed. This subordinate internationalism ideology, already called ‘colonial inferiority complex’ and entreguismo**, is as detrimental to a country as old-time nationalism. What I am singling out as a major source of incompetent macroeconomic policies is the uncritical adoption of developed countries’ recommendations.’

If we say that bad policy decisions are always rational, motivated by interest, then we must conclude that policy-makers are ‘dishonest, protecting their own interest or those of their constituencies rather than the public interest’ (Bresser-Pereira).  If this view were always true, then the world would look more like communist Russia in 1980 than the way it does today. How would entrepreneurs and consumers have financed not only the invention but the proliferation of microchips, cell phones, and personal computers that have made the world safer and easier to navigate; how would they have discovered and made widely available artificial hearts, HIV medications and targeted cancer therapies? Since 1981, the number of poor people in the world declined for the first time in history, by 375 million. Global life expectancy was 68 in 2014, up from 61 in 1980; infant mortality is down to 49.4 per 1000 live births in 2014 from 80 in 1980. Yet as a result of the havoc wrecked upon the global economy in 2008 by incompetent regulators, policy makers and bankers, global unemployment grew from 20 to 50 million while falling incomes combined with rising food prices to raise the number of undernourished people in the world by 11%.

A solution, from this perspective, lies in cleaning house of the incompetent staff from Washington to Wall Street and improving recruiting methods to build competence for the future.

* Madoff has a seat on the Board of the International Securities Clearing Corporation, one of the predecessor organizations to the Depository Trust and Clearing Corporation, the world’s largest post-trade processing center. Madoff was also Chairman of the NASDAQ, and had seats on the Boards at the National Association of Securities Dealers (now the Financial Industry Regulatory Authority – the same organization that failed to act on a referral letter from the SEC to stop R. Allen Stanford’s Ponzi scheme.

**Brazilian Portguese roughly translated as ‘appeasement’ or ‘submission.’

For more information:

Luiz Carlos Bresser-Pereira, Latin America’s quasi-stagnation, in A Post Keynesian Perspective on 21st Century Economic Problems, Elgar, UK. http://www.bresserpereira.org.br/

The World Factbook 2013-14. Washington, DC: Central Intelligence Agency, 2013.

https://www.cia.gov/library/publications/the-world-factbook/index.html

Susanne Trimbath, Ph.D. is CEO and Chief Economist of STP Advisory Services. Dr. Trimbath’s credits include appearances on national television and radio programs and the Emmy® Award nominated Bloomberg report Phantom Shares. She appears in four documentaries on the financial crisis, including Stock Shock: the Rise of Sirius XM and Collapse of Wall Street Ethicsand the newly released Wall Street Conspiracy. Dr. Trimbath was formerly Senior Research Economist at the Milken Institute. She served as Senior Advisor on United States Agency for International Development capital markets projects in Russia, Romania and Ukraine. Dr. Trimbath teaches graduate and undergraduate finance and economics.

Special Report: Maximizing Opportunity Urbanism with Robin Hood Planning

$
0
0

This is the first section of a new report authored by Tory Gattis for the Center for Opportunity Urbanism titled Maximizing Opportunity Urbanism with Robin Hood Planning. Download the full report (pdf) here.

Across America and the developed world, we face a well-reported crisis of income stagnation, rising inequality, a declining middle class, and a general lack of broad prosperity. Yet contemporary urban planning seems disconnected from this crisis, focusing instead on pedestrian aesthetics, environmentalism, and appealing to the supposed preferences of the wealthy and the “creative class.” This approach increasingly dominates urban thinking, expressed often as New Urbanism or Smart Growth. In this perspective, dense and usually older cities like New York, Portland, and San Francisco have been held up as models. For the most part, planners see their world through the perspective of an architect – an architect of the physical form of cities. But what if they tried the perspective of an economist – an architect of opportunities for people to have a better life?

Cities matter far more than they used to as engines of opportunity and upward social mobility – the very essence of the American Dream. As the basis of the economy has shifted from industry to services, proximity to others now matters more than ever before. A factory can be anywhere and ship its products anywhere, but, generally speaking, most services need to be in-person. This is pushing more and more of the population to agglomerate around not so much cities, as defined by their political boundaries, but major metros, including numerous suburban rings, where the vast majority of the population resides. In many metros, limited housing supply has driven up home prices and rents to levels where much of the middle and working classes are either unable to buy or must pay a heavy portion of their incomes in mortgages or rents.

This is occurring as economic and technological factors have directed ever more wealth to a relatively small population of elites, whose demand for specialized services - whether personal spending or that of the corporations they control - has become a major part of the economy. Economic opportunity is driven not just by proximity to others in general, but by proximity to the very small but critically influential super-affluent class – what Citigroup research calls the “Plutonomy”. iv In some markets, such as Miami, New York and San Francisco, the locational preferences of this class - who often have several residences and many are foreign buyers - has been yet another driver of major metro agglomeration and higher housing prices, particularly where there are strong land use regulations.

Family sizes have shrunk and reduced fertility rates are leading towards destabilizing demographic implosions in Europe, Japan, and China – and the U.S. trend is moving in the same direction.vi As nations seek to improve fertility rates, one of the greatest challenges is a shortage of family-friendly housing with sufficient space. If that space is not affordable, then people do the next best alternative: shrink their family size. Whereas families used to be comfortable with multiple children per bedroom, the modern standard is one bedroom for every child – not to mention the “home office” for virtual work by the dual-income parents. With the large suburban house both regulatory out-of-favor and unaffordable in some metropolitan areas, families are forced to shrink to live in expensive density, or pay very high prices and rents for what used to be considered standard middle class homes.

The planning community generally has few answers to these dilemmas, but in practice the steps they often advocate may actually be making it worse. A dominant tenet of Smart Growth actually seeks to restrict suburban development and encourage density to contain urban expansion. Draconian regulations – and ever higher costs - are piled on any new developments. On the other side, pressure from NIMBY homeowners often limits development of any kind – including high-density. In some areas, exclusionary zoning – such as tight restrictions on multi-family housing – is used to prevent minority, disadvantaged, or lower-income populations from moving in nearby.

All in all, the net effect is a suffocating restriction on new housing supply even as demand increases, leading to skyrocketing home prices. This has the effect of making affluent NIMBY homeowners, who are disproportionately white and older, quite happy since their homes prices, sans new competition, are almost certain to increase. But the system works like a “Robin Hood in reverse” for younger, middle and working class families that lose out. This is a major driver of inequality - in fact, recent analysis indicates that homeownership completely accounts for the rise in inequality in recent decades. xii Planners have to take a hard look in the mirror and face an uncomfortable truth: whether they have been conscious of it or not, they have been direct accomplices in the rise of inequality and the decline of the middle and working class.

Download the full report (pdf) from the Center for Opportunity Urbanism.

Tory Gattis is a Founding Senior Fellow with the Center for Opportunity Urbanism, and co-authored the original Opportunity Urbanism studies. Tory writes the popular Houston Strategies blog and its twin blog at the Houston Chronicle, Opportunity Urbanist, where he discusses strategies for making Houston a better city. He is the founder of Coached Schooling, a startup to create a high-tech network of affordable private schools ($10/day) combining the best elements of eLearning, home and traditional schooling to reinvent the one-room schoolhouse for the 21st century. Tory is a McKinsey consulting alum, TEDx speaker, and holds both an MBA and BSEE from Rice University.


What Jane Jacobs Got Wrong About Cities

$
0
0

Few people have had more influence on thinking about cities than the late Jane Jacobs.

The onetime New Yorker turned Torontonian, Jacobs, who died in 2006, has become something of a patron saint for American urbanists, and the moral and economic case she made for urban revival has been cited by everyone frompundits and think tanks to developers.

However, though widely celebrated for her insights and unabashed embrace of dense urbanism, Jacobs may ultimately prove more influential than relevant. Her writing was often incisive and inspiring, particularly when she opposed planning and overdevelopment and embraced the role of middle-class families in cities. But the urban revival that has actually taken place is at variance with her own romantic version of cities and how they work.

Currently the American cities that are doing best are not those with a flourishing middle class but those have become the preferred playgrounds of the rich and famous—New York, San Francisco, even Washington, D.C. At the same time, vast portions of urban America remain cut off from society’s mainstream.

The Nature of the New Urban Revival

When Jacobs published her most important work, The Death and Life of Great American Cities,in 1961, America’s cities were clearly in trouble. Racial tensions and a massive flight to suburbia were undermining the promise of cities, and the only response of planners at the time seemed to be to expand freeway access, tear down old neighborhoods, construct massive apartment blocks, and subsidize big employers.

Jacobs rightly opposed these approaches, and constructed a far more human and enduring vision of urbanism. Her appealing perspective was based on middle-class neighborhoods, families, and grassroots economic activity. Her maxim about the best role for places remains a guiding light to those who care about upward mobility: “A metropolitan economy, if it is working well, is constantly transforming many poor people into middle-class people, many illiterates into skilled people, many greenhorns into competent citizens. … Cities don’t lure the middle class. They create it.”

Yet when cities did begin to come back—a handful in the ’80s and then again more around the time of the millennium—the revivals were in many ways the opposite of her grassroots vision. Instead of creating more family-oriented middle-class neighborhoods, the urban revival ended up being based on “luring” the affluent, the still forming young person, or the accomplished, childless professional than generating a new middle class.

Witold Rybczynski noted in 2010 that the rise of successful urban cores increasingly has little in common with Jacobs’s romantic bottom-up organic urbanism:

“The most successful urban neighborhoods have attracted not the blue-collar families that she celebrated, but the rich and the young. The urban vitality that she espoused—and correctly saw as a barometer of healthy city life—has found new expressions in planned commercial and residential developments whose scale rivals that of the urban renewal of which she was so critical. These developments are the work of real estate entrepreneurs, who were absent from the city described … but loom large today, having long ago replaced planners and our chief urban strategists.”

As Rybczynski suggests, the current rise of “urban vitality” derives not from the idiosyncratic, diverse and, if you will, democratic form that Jacobs celebrated but in a more manufactured matter that at times outdoes suburbs for conformity and boredom.

The Evisceration of the Urban Middle Class

Jacobs’s vision failed in large part because today’s cities play a different economic role than they did in the past. The economic basis of her New York—small businesses, manufacturers, business service firms employing masses of middle-class workers—has declined while the city has evolved into what Jean Gottman called the “transactional metropolis,” dependent on the most elite financial services, high-end consumption, and the all too present media industry.

This urban economy has many strengths but increasingly relies on the rich. A Citigroup study suggested that cities, particularly New York and London, have become “plutonomies”—economies driven largely by the wealthy class’s investment and spending. In this way the playground or luxury cores serve less as places of aspiration than geographies of inequality.

New York, for example, is by some measurements the most unequal of American major cities: Gotham’s 1 percent earns a third of the entire city’s personal income—almost twice the proportion for the rest of the country.

Other luxury cores exhibit similar patterns. A 2014 recent Brookings report found that virtually all the most unequal large central cities—with the exception of Atlanta and Miami—are dense, luxury-oriented cities such as San Francisco, Boston, Washington, New York, Chicago, and Los Angeles. Although high-wage jobs have increased in these metropolises, the bulk of new employment in cities like New York has been in low-wage service jobs.

As urban studies author Stephen J.K. Walters notes, these cities tend to develop highly bifurcated economies, divided between an elite sector and large service class. He notes this is “the opposite of [Jane] Jacobs’s vision of cities” that relied on “transforming” poor people into the middle-class people

Even diversity, often cited by Jacobs as a great asset of cities, has suffered. Among the most successful cities today are what analyst Aaron Renn has labeled “the white cities”—places like Boston, San Francisco, Seattle, and Portland, Oregon—which have historically been home to relatively small and now shrinking, minority populations. San Francisco’s black population is 35 percent lower than what it was in 1970. In the nation’s whitest major city, Portland, African-Americans are being driven out of the urban core by gentrification, partly supported by city funding. Similar phenomena can be seen inSeattle and Boston, where long existing black communities are rapidly shrinking.

In the more diverse big cities like Los Angeles, New York, and Chicago, gentrification takes place alongside growing concentrations of poverty. It is often forgotten, according to demographer Wendell Cox, that 80 percent of the increase in urban core population in the last decade was from poor people; overall, despite the growth of poverty in suburbs, the core poverty rate remains more than twice as high.

Nor is this situation necessarily improving. During the first 10 years of the new millennium, neighborhoods with entrenched urban poverty actually grew, increasing in numbers from 1,100 to 3,100 and in population from 2 million to 4 million. “This growing concentration of poverty,” note urban researchers Joe Cortright and Dillon Mahmoudi (PDF), “is the biggest problem confronting American cities.”

We see this in places like Brooklyn and Chicago, two much-hyped epicenters of urban gentrification. Brooklyn’s poorer sections—a quarter of the residents are onfood stamps—have become even more so, notes analyst Daniel Hertz. Incomes between 1999 and 2001, he notes, dropped overall, falling in the poorer areas even as they soared in the more gentrified neighborhood closer to Manhattan and surrounding Prospect Park.

Hertz found similar, if more extreme, phenomena in Chicago, which has also seen an unwelcome return to high crime rates, particularly in its poorer sections. Gentrification has indeed expanded into formerly working- and middle-class neighborhoods, but poverty and despair still characterize much of the city. As Chicago urban analyst Pete Saunders has put it: “Chicago may be better understood in thirds—one-third San Francisco, two-thirds Detroit.”

Here Comes the Childless City

Arguably Jacobs’s biggest miscalculation related to urban demographics. As H.G. Wells predicted well over a century ago, cities now depend in large part on affluent, childless people, living what Wells labeled a life of “luxurious extinction.” Jacobs’s contemporary, the great sociologist Herbert Gans, already identified a vast chasm between suburbanites and those who favor urban core living who he identified as “the rich, the poor, the non-white as well as the unmarried and childless middle class.”

Jacobs never got this point, perhaps because she instinctively hated where families were in fact headed: the suburbs. Like many intellectuals in the ’50s and ’60s, she saw no need for suburbs, even as they experienced explosive growth, just dense city surrounded by traditional countryside.

Perhaps nothing of Jacobs seems more dated than her assertion that “suburbs must be a difficult place to raise children.” She lovingly portrayed neighborhoods like her own West Village as ideal places where locals watched out for each other. She wrote about how “Mr. Lacey, the locksmith, bawls out one of my sons for running into the street, and then later reports the transgression to my husband as he passes the locksmith shop. Mr. Lacey, with whom we have no ties other than street propinquity, feels responsible for him to a degree.”

At best, Jacobs’s compelling portrait from 1961 is something of an anachronism. Families in urban apartments today, notes Cornell researcher Gary Evans (PDF), generally have far weaker networks of neighbors than their suburban counterparts, a generally more stressful home life, and significantly less “social support.” Toronto author Phillip Preville notes, “In the years since, all the Mr. Laceys of the world have died and gone to downtown heaven,” he notes. “We can all talk Jane’s talk, but some people are pickled in Jane’s brine.”

Certainly statistics back up Preville’s assertion. Greenwich Village today now largely consists of students, wealthy people, and pensioners. Despite the presence of many young people, children and teens between 5 and 17 account for only 6 percent of the Village’s population, far below the norms for New York City (PDF), and less than half the 13.1 percent found across the United States’s 52 largest metropolitan areas. Overall, Manhattan has among the lowest percentage of children in the country; a majority of its households are made up of singles.

This pattern holds across the country. According to census data, in 2011 children 5-14 constitute about 7 percent in core districts across the country, roughly halfthe level seen in suburbs and exurbs. By 2011 people in their 20s constitute roughly one-quarter of the residents in urban cores, but only 14 percent or fewer of those who live in suburbs, where the bulk of people go as they start to reach the point of establishing families.

Even in Toronto, generally seen as one of the world’s most livable cities and Jacobs’s chosen home, Statistics Canada notes that for every person who moved from the hinterlands to the city, 3.5 moved towards the periphery. The people most likely to move out are 25 to 44, people entering the stage of family formation. As one Torontonian, who recently moved to the suburbs, observed: “The big city has its uses. It served me well, and I served it back. Living in Toronto enabled me to transform my life in ways I dearly wanted: marriage, fatherhood, career advancement. That transformation has brought with it needs that Toronto cannot adequately provide: personal space, affordability, an emphasis on community over privacy. The intensity and the anonymity of the city now hinder my life more than they help. Simple as that. I’m outta here.”

Overall, high-density cores, whether in Canada, America, or East Asia, consistently exhibit the lowest percentages of children. The far more ultra-dense cities of East Asia—Hong Kong, Singapore, and Seoul—exhibit the lowest fertility rates on the planet (PDF), sometimes less than half the number required simply to replace the current population. Due largely to crowding and high housing prices, 45 percent of couples in Hong Kong say they have given up on having children.

In Asia people have few opportunities to move to lower-density housing. But in the United States, with abundant and often much cheaper land, super-urbanity often serves as a kind of way station in which people spend only a portion—often an exciting and career-enhancing one—of their lives. But when they grow older, and particularly when they decide to start families, they tend to leave for the periphery.

Getting Beyond Nostalgia

Nostalgia makes people feel good. Some still dream about a coming revival of diverse, child-friendly, dense city neighborhoods. They dream, in the words of oneauthor, of bringing us “back to the way we were, when most people lived in cities, did not own a car, walked or took the bus or train to work, and lived in much smaller residences.”

Wishing to return to something that last predominated a half-century ago does not mean it will occur. Just as conservatives who hearken for a return to the ’50s are sure to be disappointed, urban advocates who suggest a “return to the city” for middle-class families will be as well. Both minorities and millennials, often thought of as spearheading a “back to the city” drive, are, according to most indicators, moving out to the suburbs as they enter their 30s and start families.

Dense urbanity, of course, remains a huge contributor to the nation’s economy and culture. Urban centers are great places for the talented, the young, and childless affluent adults. But for most Americans, the central city offers at best a temporary lifestyle. It does not fit with what people can afford and where they want to live. There is a reason why 70 to 80 percent of Americans in our metropolitan areas live in suburbs, and those numbers are not likely to change appreciably in the coming decade.

Cities, as Jacobs hoped, have indeed experienced a renaissance, but not in the form she preferred. To be sure, this revival is a hell of lot better than the urban dystopia that developed in the years after Jacobs’s Death and Life of Great American Cities first appearedBut it’s time to recognize that we are not seeing a renaissance of the kind of middle-class urbanity that she loved and championed. That city has passed into myth, and, unless society changes in very radical ways, it is never going to come back.

This piece originally appeared at The Daily Beast.

Joel Kotkin is executive editor of NewGeography.com and Roger Hobbs Distinguished Fellow in Urban Studies at Chapman University, and a member of the editorial board of the Orange County Register. He is also executive director of the Houston-based Center for Opportunity Urbanism. His newest book, The New Class Conflict is now available at Amazon and Telos Press. He is also author of The City: A Global History and The Next Hundred Million: America in 2050. He lives in Orange County, CA.

By Phil Stanziola [Public domain], via Wikimedia Commons

Rethinking the Scandinavian Model

$
0
0

During a tour to Paris, Bruce Springsteen explained that his dream was for the US to adapt a Swedish style welfare state. The famous musician is far from alone in idealizing Nordic policies. The four Nordic nations (Denmark, Finland, Norway and Sweden) are often regarded as prime role-models the policies to be emulated by others. Internationally, advocates of left of centre policies view these countries as examples of how high tax social democratic systems are viable and successful. Paul Krugman, for example, has said: “Every time I read someone talking about the ‘collapsing welfare states of Europe’, I have this urge to take that person on a forced walking tour of Stockholm”.

This admiration has a long history. In the mid-1970s Time Magazine described a country that sounded much like a utopia. “It is a country whose very name has become a synonym for a materialist paradise”, the international magazine wrote and continued to report about Sweden: “No slums disfigure their cities, their air and water are largely pollution free... Neither ill‑health, unemployment nor old age pose the terror of financial hardship.” Similarly, political scientist John Logue argued in 1979: “A simple visual comparison of Scandinavian towns with American equivalents provides strong evidence that reasonably efficient welfare measures can abolish poverty as it was known in the past; economic growth alone, as the American case indicates, does not”. Logue believed that the greatest threat to the Nordic welfare states was that they were too successful; eliminating social problems to such a degree that people forgot the importance of welfare policies.

The high regard comes as no surprise. Nordic societies are uniquely successful. Not only are they characterised by high living standards, but also by other attractive features such as low crime rates, long life expectancy,  high degrees of social cohesion and even income distributions. Various international rankings conclude that they are amongst the best, if not the best, places in the world in which to live. One example is the “Better Life Index”, complied by the OECD. In the 2014 edition of the index Norway was ranked as the nation with the second highest level of well-being in the world, followed by Sweden and Denmark in third and fourth position. Finland ranked as the eighth best country.

The OECD “Better Life Index”


1. Australia

2. Norway

3. Sweden

4. Denmark

5. Canada

6. Switzerland

7. United States

8. Finland

9. Netherlands

10. New Zealand


If one disregards the importance of thinking carefully about causality, the argument for adopting a Nordic style economic policy in other nations seems obvious. The Nordic nations – in particular Sweden, which is most often used as an international role‑model – have large welfare states and are successful in a broad array of sectors. This is often seen as proof that a ”third way” policy between socialism and capitalism works well, and that other societies can reach the same favourable social outcomes simply by expanding the size of government. If one studies Nordic history and society in‑depth, however, it quickly becomes evident that the simplistic analysis is flawed.

To understand the Nordic experience one must bear in mind that the large welfare state is not the only thing that sets these countries apart from the rest of the world. The countries also have homogenous populations with non-governmental social institutions that are uniquely adapted to the modern world. High levels of trust, strong work ethic, civic participation, social cohesion, individual responsibility and family values are long-standing features of Nordic society that pre-date the welfare state. These deeper social institutions explain why Sweden, Denmark and Norway could so quickly grow from impoverished nations to wealthy ones as industrialisation and the market economy were introduced in the late 19th century. They also play an important role in Finland’s growing prosperity after the Second World War.

Take Sweden as an example. In 1870 free markets were introduced in this agrarian society. During the coming 100 years Sweden combined low taxes, liberal regulations and strong working ethics to experience an unrivalled growth rate in Europe. In 1870 Sweden’s GDP per capita was 57 per cent lower than in the UK. In 1970 it had risen to become 21 per cent higher. The shift towards high taxes and state involvement actually began   occurred around 1970, resulting in a long-lasting period of stagnation that was broken through ambitious market reforms during the 1990s and onward.

Perhaps even more interestingly, even the social progress that Nordic countries are admired for developed during the latter part of the 19th century and the first half of the 20th century, developed not under socialism but at a time when Nordic countries combined free markets and low taxes with small (and efficient) welfare states. Researchers have for example shown that it was during this period that Sweden and Denmark developed a relatively equal income distribution. Long life expectancy is another example. In the picture below I show the life expectation at birth is shown for various OECD nations in 1960 – when Nordic nations had small welfare states – and 2005 – when Nordic welfare states were at their peak. In both periods Nordic countries were characterized by relatively long life expectancy, but if anything, this was more the case when the countries had small rather than large welfare states. The reason is simply that everything is not politics, cultural attributes such as a love for nature and healthy diets explains much of Nordic citizens good health.

Similarly, it comes as no surprise that descendants of the Nordics who migrated to the US in the 19th century are still characterised by favourable social outcomes, such as a low poverty rate and high incomes. In fact, as shown below, Nordic Americans have considerably higher living standard in capitalist America than their cousins in the Nordics. This is interesting, since those Nordic citizens who migrated to the United States in large groups during the 19th and 20th centuries were anything but an elite group. Rather, it was often the poor who left for the opportunities on the other side of the Atlantic.

A key lesson from the success of Nordic society lies in what can broadly be defined as “culture matters”. We should not be surprised that it is these nations, with their historically strong work ethic and community-based social institutions, t  have had fewer adverse effects from their welfare states and are therefore used as the poster child for those wishing to extol the benefits of active welfare policies. On the other hand, Southern European countries with similar sized welfare states and size of government have had less favourable outcomes.

Paul Krugman is right in noting that a forced walking tour of Stockholm disproves the idea of the collapsing welfare states of Europe. Nordic societies have not collapsed under the weight of welfare policies, particularly since they have lately adopted by introducing market reforms, reducing the generosity of welfare programs and cutting taxes. Such a tour may perhaps also be wise for Krugman himself, in teaching that Scandinavian countries have been rather unexceptional. The normal economic rules apply: incentives, economic freedom, a strong self-sufficient culture and a regime of good governance all matter when it comes to economic success. The question that remains is whether Scandinavian countries will continue their return to the free-market roots that have historically served them so well. If so, the Nordic culture of success can in combination with sound policies allow growth, innovation and entrepreneurship to flourish.

Dr. Nima Sanandaji is a research fellow at CPS, and the author of “Scandinavian Unexceptionalism - Culture, Markets and the Failure of Third-Way Socialism”. The book, which was recently released is currently being translated to a number of different languages. The entire book is available through the Institute of Economic Affairs which has published it.

Historic Districts: The Past or The Future?

$
0
0

Preservation seems like an easy idea to support. Who would be against it? History, character, and a sense of place are what great communities are all about. They generate tourism and makes us all culturally richer. Landowners in historic districts even enjoy higher land values than nearby landowners in newer, usually blander developments. What’s not to like?

Apparently, a lot. Cities unilaterally impose ordinances from time to time, regulating building size, shape and use, and rarely are there complaints, although the changes affect everyone in the city. Here in Florida, building codes were recently stiffened, causing buildings in the entire state to become more expensive, and there were no complaints to speak of. But in the small community of Winter Park, when a proposal was floated to make obtaining historic district status less onerous, indignant protesters with cries of “property rights” were voiced. Protesters who were shy about fighting the State and the City may have finally found, in individual neighborhoods, a small enough foe to bully.

Protesters claim that they fear restraint of trade, and they’re hoping to cash in on rising land values, particularly where they have been historically low. A historic designation might make an owner think twice before knocking a house down.

There’s mirth in Cyria Underwood’s eyes as she tells us about coming here to Winter Park from Louisville, Kentucky. A tall, elegant African American woman, Underwood works at the Hannibal Square Heritage Center, and observes Winter Park’s preservation battles like this: “Black people have an oral history tradition, and it’s a good thing we do. We don’t expect our own buildings to get preserved. So here on the West Side, we hand down our oral history from mother to child, father to son. It’d be nice to see preservation taken seriously,” she muses, her eyes still smiling, “but African Americans have learned to make do without it.”

Interest rates remain low. In neighborhoods like the West Side, where Cyria works, owners feel the pressure to sell. Hannibal Square, built originally for blacks in the 1880s, today houses a mix of families, some of whom go back to the town's early days. Walkability, playgrounds and parks make this a dream community for urbanists; many residents ride the buses that travel up and down Denning Avenue, and Sunrail’s Winter Park Station is a couple of blocks away. Finally, it seems, this area has come into its own and become a hip, urban community at long last.

“However,” murmurs Cyria, her eyes twinkling, “the wolf is at the door.” She’s referring to developers who buy small houses on small lots and replace them with much larger homes, townhomes, and even multifamily clusters. West-siders have been clinging on by the skin of their teeth. Service jobs with modest incomes and part-time work (much of it a long bus ride away) have kept this neighborhood afloat. While land values all around have skyrocketed, the West Side — historically African-American — has not been rewarded with such good fortune. Property values are, to put it politely, stable.

Fairolyn Livingston moved out of the West Side in the '70s, but comes back frequently. She explains that when a West Side homeowner sells, he or she walks off counting the cash. But Livingston cites more than one seller who couldn’t replace the Winter Park lifestyle with the proceeds from his or her home, and ended up moving into poorer and even less upwardly mobile parts of town. So goes gentrification: the new buyer, often white, unwittingly banishes an African American family to a lower stratum, hardening class divisions.

Livingston is candid about the younger newcomers. Asked whether they join the neighborhood churches, she chuckles. “Oh, no. There’s no interaction with our community.” The new buyers, however, benefit from the short walk to Park Avenue’s chic restaurants and shops, and can Sunrail to happy hour downtown. The West Side’s character, meanwhile, dissolves under the homogenous new face of urban America, where everywhere resembles everywhere else.

Cyria Underwood, Fairolyn Livingston and many others are unworried about the preservation battles being waged in Winter Park right now. This is not surprising: preservation of the West Side has not been high on the City’s agenda. The same development pressures are being fought all over.

Locally, Friends of Casa Feliz, a Winter Park preservation organization, will be co-hosting a West Side History panel discussion this autumn to help keep what is left of the architecture.

It’s part of keeping a conversation going about the local urban future. Historic districts come into being in most places with a simple majority, but Winter Park’s requirement of a supermajority makes them difficult and rare. Protesters against preservation see this as just fine, and do not want property rights to change.

While he isn’t a vocal protester, realtor Mark Squires is a realist. With a Clark Gable smile and wink, he is a true denizen of Winter Park real estate. “Everyone wants historic character,” Squires offers, “but nobody wants to pay for it.” Smaller, older homes have tiny kitchens and bathrooms, and are often hard to maintain. Squires and his colleagues find that, for many young couples with kids, Winter Park’s lifestyle is in high demand. The last thing on their busy agendas is fixing cast iron pipes or repainting wood trim. Many buyers want new, as the developers, builders, realtors and lenders are well aware. Every home becomes a potential knockdown, if the price fits the formula.

Squires’ local reality is that historic preservation, while it might make everyone a little better off, makes home sales harder. Our local economy is geared towards short-term private profit, and the notion that preservation can also be profitable is rarely considered. While developers in Boston, Chicago, and elsewhere have proven that historic preservation can make money, it has yet to be seen as a both/and proposition in Central Florida. City Hall dithers over the proposed historic district ordinance while the bulldozers roll.

Underwood is philosophical about it. “Willing seller, willing buyer, you know? You can’t control what someone does after you go.” Rich or poor, the same argument applies. The individual decides whether to push the easy button and go for new, or save a little bit of quality for future generations.

The current wave of transactions, fueled by low interest rates and demand for in-town living, is recasting the character of her neighborhood, as well as of the more affluent areas of the East side. If the City Commission votes to ease historic district formation, perhaps there will be more than just oral history to remember Old Winter Park by. If not, and more bungalows succumb to the McMansion, we’ll all just have to huddle up around her chair and ask for stories about the buildings that used to be here, and the people who lived within them.

Richard Reep is an architect with VOA Associates, Inc. who has designed award-winning urban mixed-use and hospitality projects. His work has been featured domestically and internationally for the last thirty years. An Adjunct Professor for the Environmental and Growth Studies Department at Rollins College, he teaches urban design and sustainable development; he is also president of the Orlando Foundation for Architecture. Reep resides in Winter Park, Florida with his family.

Photo of Cyria Underwood by the author

Congratulations Boston!

$
0
0

Congratulations Boston! Your rejection of the "honor" of representing the US as its candidate for the 2024 Summer Olympics is an inspiring example of government performing its obligation to taxpayers and their hard earned money. Those of us who think that government has a responsibility to wisely use taxpayer money sometimes forget that Massachusetts enacted Proposition 2 1/2 not long after California's fabled Proposition 13.

In an era of routinely wasteful government spending, Boston’s decision stands out as unusual. It rivals the courage of New Jersey Governor Chris Christie who cancelled a new Hudson River rail tunnel, mid-project, because of the consultants and builders seemed sure to take advantage of the blank check that New Jersey taxpayers were required to pledge. This, of course has been the record of major infrastructure projects all over the world and most recently one of the most grotesque examples was Boston's own "Central Artery." But unlike “the Big Dig”. This time Boston didn't have speaker Tip O'Neill to bring home the bacon. Then, the federal government capped its share and Boston had to pay it all. Unsurprisingly, the bill was much higher and had to be paid by Massachusetts, along with the interest on extra debt that had to be issued.

Oxford University Professor Bent Flyvbjerg, who has become famous for his quality analysis of large infrastructure projects, especially urban rail projects, produced a report with Allison Stewart on the history of Olympics cost overruns between 1960 and 2012. The two worked under the auspices of the Said Business school of England's at Oxford. They concluded:

The data thus show that for a city and nation to decide to host the Olympic Games is to take on one of the most financially risky type of megaproject that exists, something that many cities and nations have learned to their peril.

They found that every Olympic Games, summer or winter, for which complete data is available experienced cost overruns. The most recent, in London, experienced a cost overrun of 100 percent. Flyvbjerg and Steward used a very simple model that has been applied to the previous infrastructure work. They just looked at the final bill that included all the expenses.This was compared to the amount the sponsors and their funders, the taxpayers, were it was going to cost when the application was approved by the local political process.

The principal problem was the Olympic Committee requirement that sponsors must ensure the financing of all major capital investment required and are "on the hook" for any cost overruns.

Montréal's legendary Mayor Jean Drupeau sold his city on an Olympics bid saying that "the Montréal Olympics and no more have a deficit that a man can have a baby." Well, men are not yet having babies, but Montréal gave birth to a world-class cost overrun in its 1976 summer Olympics.  According to Flyvbjerg and Stewart, the 1976 Montréal Olympics had a cost overrun of nearly 800 percent, nearly double the 1992 420 percent cost overrun of Barcelona. Montréal may have set a record for much more than the Olympics with its cost overrun.

Things have been virtually as bad in Greece. The researchers reported that "Olympic cost overruns and debt have exacerbated" the Greek economic crisis.

There has been one exception to this sorry record. Los Angeles, host of the 1984 summer Olympic Games, actually turned a profit, sending more than $300 million to the international Olympic Committee and using the local profits for the LA84 Foundation, which funds youth sports and related activities, even 30 years after the event.

I coordinated the information program for employees at the Southern California headquarters of Crocker Bank (subsequently sold to Wells Fargo), assisting employees in getting to work during what was expected to be the high traffic from the 1984 Olympics. It turns out that the advice of local officials to encourage and vacations and working at home paid off handsomely. People who commuted during the Olympic Games had unusually light traffic.

In addition, I was a member of the Los Angeles County Transportation Commission (LACTC), having been appointed by Mayor Bradley and confirmed by the Los Angeles City Council. Both the Mayor and the Council were committed to putting on the show without burdening the taxpayers – no public money. And Olympic Committee was established under the direction of Peter Ueberroth, who became a legend for his skillful management of the games.

But there was some public money lost on the Olympics. The Southern California Rapid Transit district (SCRTD), the large regional transit operator announced its intention to provide bus service to Olympic venues from all over the Los Angeles area. SCRTD claimed that it would be able to do the job without public subsidy. I believed otherwise and predicted that the service would fall far short of its ridership projections and lose about $5 million. LACTC had the authority to ban the expenditure, which I tried to do. Unfortunately I was unable to obtain the necessary votes to make that happen. In the end, the ridership fell far short of projection (the kind of thing Professor Flybvjerg usually reports on urban rail projects).

Meanwhile, the Olympics were a one-off to Los Angeles. Most infrastructure projects of this nature are financially ruinous. Maybe Massachusetts learned a lesson from the Central Artery. Boston proved itself to be a world-class city in having the courage to say "no."

Wendell Cox is Chair, Housing Affordability and Municipal Policy for the Frontier Centre for Public Policy (Canada), is a Senior Fellow of the Center for Opportunity Urbanism (US), a member of the Board of Advisors of the Center for Demographics and Policy at Chapman University (California) and principal of Demographia, an international public policy and demographics firm.

He is co-author of the "Demographia International Housing Affordability Survey" and author of "Demographia World Urban Areas" and "War on the Dream: How Anti-Sprawl Policy Threatens the Quality of Life." He was appointed to three terms on the Los Angeles County Transportation Commission, where he served with the leading city and county leadership as the only non-elected member. He served as a visiting professor at the Conservatoire National des Arts et Metiers, a national university in Paris. 

Photograph: Boston, by author

More Local Decisions Usurped by Ideological Regulators

$
0
0

In hip, and even not-so-hip, circles, markets, restaurants and cultural festivals across the country, local is in. Many embrace this ideal as an economic development tool, an environmental win and a form of resistance to ever-greater centralized big business control.

Yet when it comes to areas being able to choose their urban form and for people to cluster naturally – localism is now being constantly undermined by planners and their ideological allies, including some who superficially embrace the notion of localism.

In order to pursue their social and perceived environmental objectives, they have placed particular onus on middle- and upper-class suburbs, whose great crime appears to be that they tend to be the places people settle if they have the means to do so.

Central planning

Nothing is more basic to the American identity than leaving basic control of daily life to local communities and, as much as is practical, to individuals. The rising new regulatory regime seeks decisively to change that equation. To be sure, there is a need for some degree of regulation, notably for basic health and public safety, as well as maintaining and expanding schools, parks, bikeways and tree-planting, things done best when supported by local voters.

Read the entire piece at The Orange County Register.

City Hall photo by Flickr user OZinOH.

Viewing all 3794 articles
Browse latest View live


Latest Images