Quantcast
Channel: Newgeography.com - Economic, demographic, and political commentary about places
Viewing all 3794 articles
Browse latest View live

A Guide to China’s Rising Urban Areas

$
0
0

From a Rural to Urban Dispersion in the Middle Kingdom

China’s rise to economic prominence over the past 30 years has rested in large part to its rapid    urbanization. Prior to ‘reform and opening up’ that started in earnest during the 1970s, cities in China were viewed as pariahs by the party leadership. Millions of young urban dwellers were forced into the countryside to labor on farming communes during the Cultural Revolution. In stark contrast, today millions of rural migrants make their way to the city.

The scale at which this is happening is unprecedented. Currently, there are 85 metropolitan areas in China with more than 1 million people, compared to 51 in the US. By 2015, urban regions will account for half of China’s population and by 2025, the urban population’s share should reach about 75%.

To date, international attention has remained fixated on China’s largest cities of Beijing and Shanghai (and to a lesser extent, Guangzhou and Shenzhen). This is not without good reason, as Beijing and Shanghai are not only the respective government and financial centers of mainland China, but both were host to two of the most visible world events of the past decade: the 2008 Summer Olympics and the recently concluded World Expo.

Second and Third-Tier Cities Enter Onto the World Stage

Increasingly, however, the real trajectory of urban growth is shifting to China’s so-called ‘second-tier’ and ‘third-tier’ cities. To the outside observer, China’s lesser-known cities might seem all too similar to one another given the monotonous aesthetic of their newly constructed cityscapes. Indeed, the newfound appearance of Chinese cities is a point of contention among local urban development scholars who are concerned about the converging ‘identical faces’ of these urban areas.

Yet to Chinese locals and foreigners who have spent some time living here, it Chinese cities are defined more by their local cuisine, dialect, history, geography, culture and climate rather than their architectural character. These often-overlooked nuances of local culture are much more essential to the identity of these cities than buildings. In the future, these distinctions may prove more effective in attracting investment and talent than flashy new construction projects.

Here’s a short guide to these rising urban areas by region and their current identities and prospects.


TOP 20 URBAN AREAS IN CHINA: 2010 ESTIMATES
Rank
Urban Area
2010
Area: SqMi
Density
Area: SqKM
Density
Base Year
Base Year Pop.
1 Shanghai, SHG 18,400,000 1,125 16,400 2,914 6,300 2010 18,400,000
2 Shenzhen, GD 14,470,000 550 25,900 1,425 10,000 2008 14,000,000
3 Beijing, BJ 13,955,000 1,275 10,800 3,302 4,200 2008 13,545,000
4 Guangzhou-Foshan, GD 13,245,000 760 17,000 1,968 6,600 2007 12,600,000
5 Dongguan, GD 10,525,000 535 19,200 1,386 7,400 2007 10,000,000
6 Tianjin, TJ 6,675,000 500 13,100 1,295 5,000 2007 6,400,000
7 Chongqing, CQ 5,460,000 280 19,100 725 7,400 2007 5,240,000
8 Hangzhou, ZJ 5,305,000 250 20,600 648 8,000 2007 5,015,000
9 Wuhan, HUB 5,260,000 275 18,700 712 7,200 2007 5,040,000
10 Shenyang, LN 5,160,000 280 18,100 725 7,000 2007 4,950,000
11 Chengdu, SC 4,785,000 220 21,300 570 8,200 2007 4,585,000
12 Xi'an, SAA 3,955,000 205 18,900 531 7,300 2007 3,785,000
13 Harbin, HL 3,615,000 235 15,100 609 5,800 2007 3,460,000
14 Suzhou, JS 3,605,000 245 14,300 635 5,500 2007 3,400,000
15 Nanjing, JS 3,550,000 330 10,500 855 4,100 2007 3,400,000
16 Dalian, LN 3,255,000 270 11,800 699 4,500 2007 3,105,000
17 Changchun, JL 3,170,000 145 21,300 376 8,200 2007 3,010,000
18 Kunming, YN 3,070,000 130 23,100 337 8,900 2007 2,925,000
19 Wuxi, JS 2,925,000 150 19,000 389 7,300 2007 2,760,000
20 Taiyuan, SAX 2,900,000 120 23,600 311 9,100 2007 2,755,000
Source: Demographia World Urban Areas: Population & Projections: 6th Edition. http://demographia.com/db-worldua.pdf


The Interior Rises

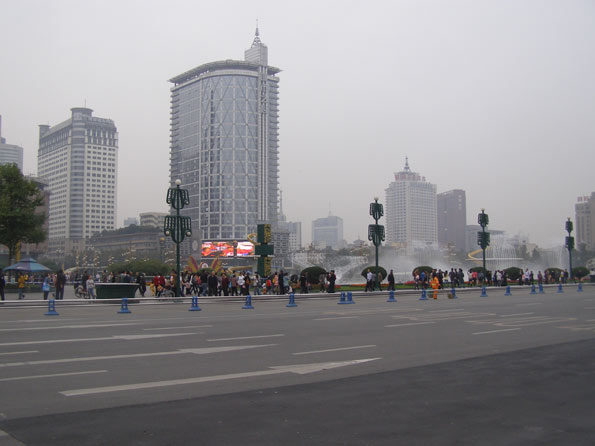
Chengdu (成都): It was the devastating 2008 Wenchuan Earthquake that first out Chengdu onto the international radar, but it’s the rapid expansion of its massive high tech sector that may define its long term prospects.  The aerospace industry also plays an important role in the capital city of Sichuan Province as it is the site of the development of China’s first stealth fighter, the Chengdu J-20. Despite all the new development, Chengdu remains a pleasant city, known for pandas and spicy food as well as its generally relaxed and agreeable disposition. The local government has done a good job of promoting ‘quality of life’ and relatively low cost of living to attract both investment dollars and skilled labor away from the prohibitively expensive eastern metropolises.

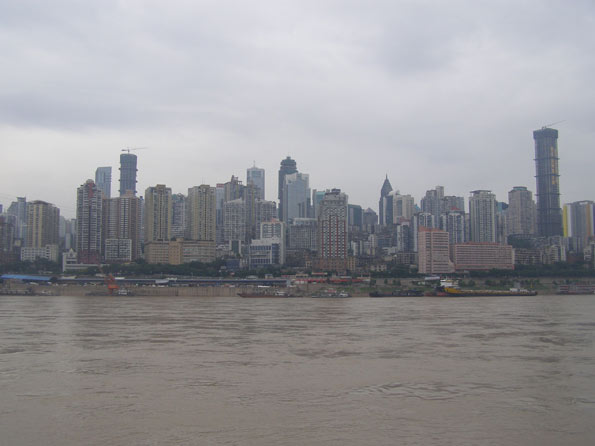
Chongqing (重庆): Also known for spicy food, this municipality, which falls under direct control of the central government, is bisected by the Yangtze River. Its urban vista is unique, with deep gorges. It long has been known as a rough and tumble place, long plagued by organized crime. This has abated under the leadership of Communist Party Secretary Bo Xilai who has waged a war against organized crime in Chongqing since assuming office there in 2007. Though a controversial leader with a penchant for strong “red” leanings, the ambitious Bo has been applauded for cleaning up the city and implementing a large-scale public housing program.

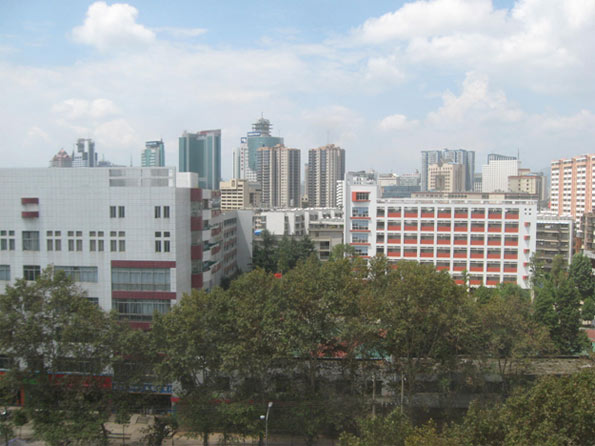
Kunming (昆明): The city of Eternal Spring and the capital of China’s ethnically diverse southern Yunnan Province, Kunming claims the best weather in the country. As such, Kunming’s residents would rather enjoy the sunshine then spend their days indoors working in factories. The lack of industrial production doesn’t mean this city isn’t important- as Kunming has China’s 6th busiest airport and is the country’s gateway to Southeast Asia. If China goes forward with its ambitious plans to link itself with Southeast Asia via high-speed rail, Kunming could enhance its status an international transportation node.

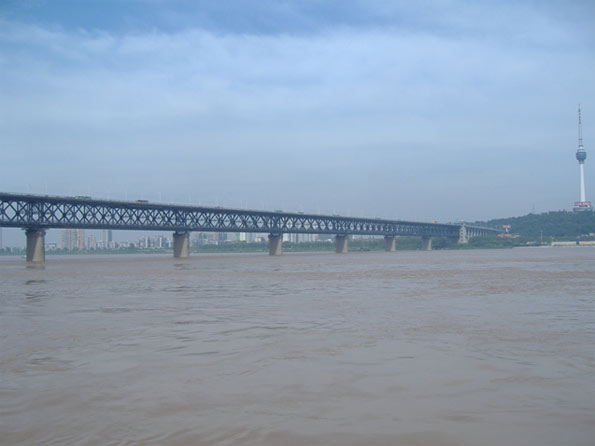
Wuhan (武汉): Wuhan, capital of Hubei Province, is an important rail and river transport hub at China’s central crossroads. Known for its unbearably hot summers, Wuhan sits on the Yangtze River a few hundred kilometers downstream from the infamous Three Gorges Dam. The city is China’s center for the optical-electronic industry, with a focus on the production of fiber-optics. It was also recently announced that Wuhan will get China’s third tallest building, the 606 meter Greenland Center.

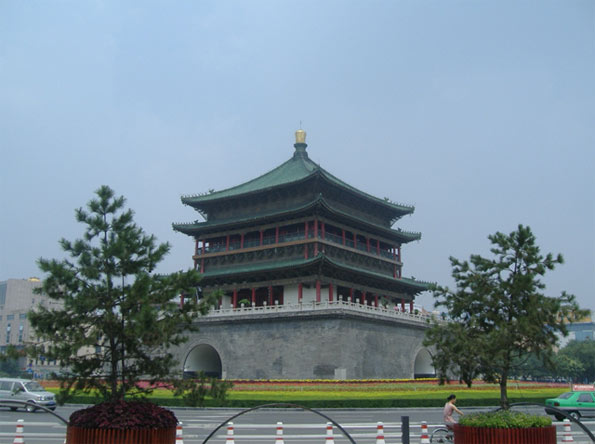
Xi’an (西安): Once known as Chang’an (‘eternal peace’), Xi’an was the capital of multiple Chinese dynasties throughout history. It remains as one of the most popular international tourist destinations in China thanks to its world-renowned Terracotta Warriors. But today this ancient city and present day capital of Shaanxi Province is also positioning itself as a hub for the development of the software and aerospace industries. The city is also host to several reputable universities, which could help supply a strong local talent pool.


Yangtze River Delta (Greater Shanghai)

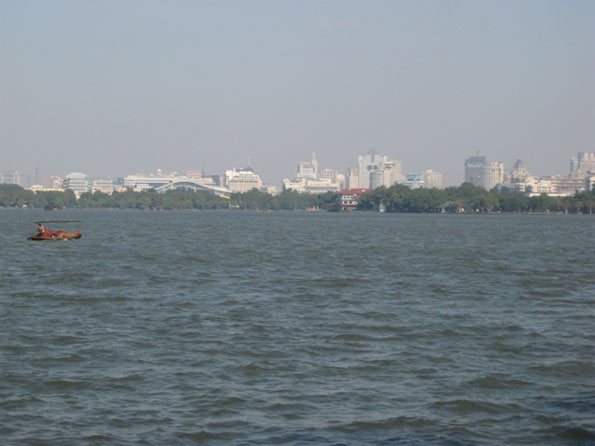
Hangzhou (杭州): Arguably China’s most naturally beautiful large city, Hangzhou is famous for its scenic Xihu or ‘West Lake’, which just became a UNESCO Heritage Site. The capital of Zhejiang Province not only attracts tourists, but investment as well, especially in the light manufacturing and textile industries. Already somewhat of a ‘bedroom community’ for Shanghai’s wealthy, The recently inaugurated Shanghai-Hangzhou high-speed rail line, which has cut travel time down to 45 minutes between the two cities, means that Hangzhou stands to further benefit from this connection.

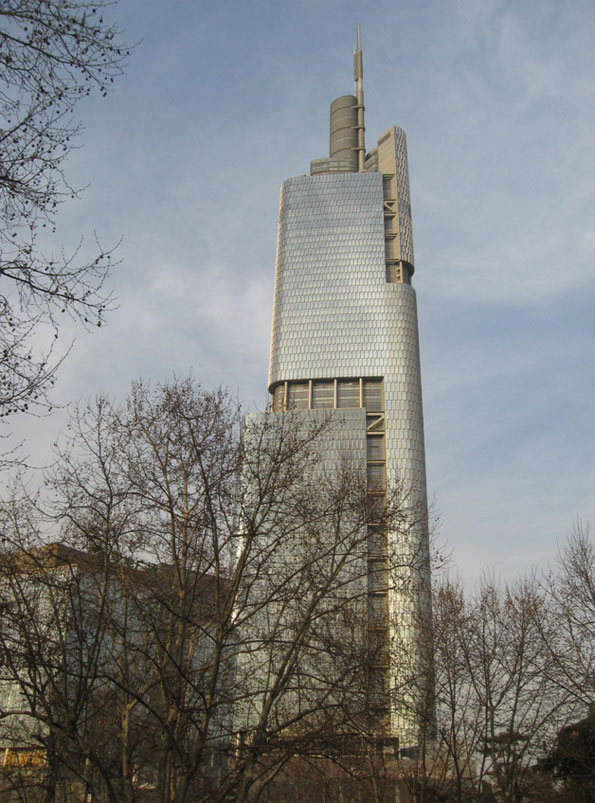
Nanjing (南京): One of the ‘Four Great Ancient Capitals of China’, the capital of prosperous Jiangsu province is today a bustling modern metropolis. Located on the Yangtze River, Nanjing has greatly benefitted its location within the greater Yangtze River Delta Region. The city’s close proximity to Shanghai means that is has absorbed some spillover from investors looking for a lower-cost alternative. Nanjing is also home to one of China’s tallest towers, the newly opened Nanjing Greenland Tower and Asia’s largest railway station.

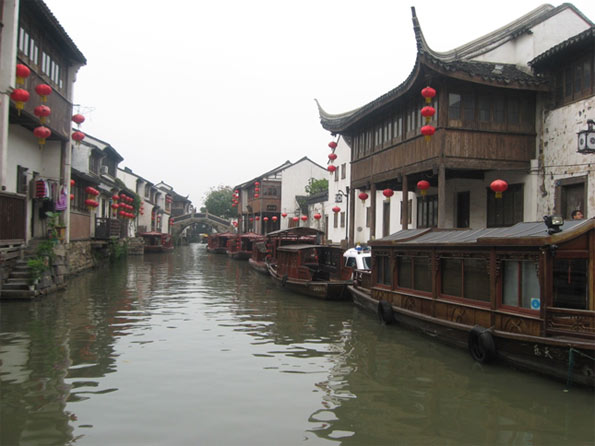
Suzhou (苏州): Situated in Jiangsu Province en route from Shanghai and Nanjing, Suzhou is strategically located in the center of a booming region. Often referred to as the ‘Venice of the East’, the city is famous for its historic canals and classic Chinese gardens. In addition to being a popular tourist destination Suzhou is an emerging hi-tech center. The China-Singapore Suzhou Industrial Park, the largest strategic partnership between the two governments, has been established in the city.

Wuxi (无锡): Only 50 km from Suzhou, Wuxi straddles the north shores of Lake Taihu. With 3,000 years of history, Wuxi is today one of China’s most business friendly cities. Wuxi is particularly attractive to Japanese businesses, with companies like Sony, Nikon, and Konica Minolta owning manufacturing and assembling facilities in the city’s New District. The city’s relatively new airport, which opened in 2004, serves the city as well as neighboring Suzhou.


The Industrial North: China’s Rustbelt

Changchun (长春): Changchun was the last capital of Manchuria and the seat of Japan’s ‘Puppet Government’ during their occupation of the region during WWII. Today the capital of China’s northern Jilin Province stands as “China’s Detroit” as the country’s largest automobile producer.The Changchun Automotive Economic Trade and Development Zone is home to the country’s biggest wholesaler of used cars, automotive spare parts and tires.

Dalian (大连): Consistently ranked as one of the ‘most livable’ of China’s big cities, Dalian sits strategically on the Liaodong Peninsula making it the principle seaport for the country’s northeast (‘DongBei’) region. Banking and IT is big here, with semiconductor giant Intel just having recently opened a $2.5 billion manufacturing facility in the city. The Dalian Commodity Exchange, highlighted by the trading of soybean contracts, is China’s largest futures exchange. Bo Xilai also left his mark on the city when he was Mayor before heading to Chongqing by initiating a campaign to add significant green space to the city.

Harbin (哈尔滨): The capital of Heilongjiang province, Harbin is the country’s northernmost big city. Famous for its local beer and annual winter ice sculpture festival, Harbin is China’s gateway to neighboring and resource-rich Russia. Russian culture has also left its mark on the city, influencing everything from the local cuisine to the architecture. Today Harbin’s economy is focused on textiles and power equipment manufacturing.

Shenyang (沈阳): Shenyang, the capital of Liaoning province, is the largest city in China’s northeast. Once the capital of the Manchurian Empire during the 17th Century, Shenyang is today an industrial powerhouse producing industrial equipment,  construction vehicles, power tools, and biomedical equipment. Shenyang is also a hub for agriculture and the production of foodstuffs.

Taiyuan (太原): The capital of coal producing Shanxi province, Taiyuan is moving up on China’s urban radar. The city serves as the administrative center for both Chinese state-owned and foreign enterprises involved in the coal mining business. The city is also home to the Taiyuan Steel and Iron Company, China’s largest producer of stainless steel. Unfortunately, due to the heavy industrial activity in the region, Taiyuan is also one of the country’s most polluted cities.

Tianjin (天津): Long ridiculed by Beijingers, Tianjin is ambitiously positioning itself as a financial and sea logistics center for northern China. One of China’s four direct-controlled municipalities, Tianjin is less than 30 minutes from nation’s capital by high-speed train yet still has a distinct dialect and culture. The city is divided into two distinct parts: the charming historic city center, which retains colonial buildings from 19th Century foreign concessions, and the Binhai New Area, an up-and-coming Special Economic Zone next to the Bohai Sea. Tianjin is also aiming to become the center of China’s burgeoning biotech industry.


The Outlier

Dongguan (东莞): As the fifth largest city in China by population, Dongguan should register more prominently on the international radar. Unfortunately the most defining characteristic about this urban amalgam is its lack of character. A sprawling unplanned mass of factories in the Pearl River Delta situated between Shenzhen and Guangzhou, Dongguan is the largest city in the world without an airport. As the Pearl River Delta de-industrializes as more factories move into the lower-cost inland regions of China, Dongguan will need to reinvent itself.

Adam Nathaniel Mayer is an American architectural design professional currently living in China. In addition to his job designing buildings he writes the China Urban Development Blog.

Photos: Chengdu and Chongqing photos by author. All other photos by Wendell Cox.


"Art, Design, Portland" District Offers Opportunities To Work, Play, and Profit in Portland’s New Economy

$
0
0

In a dreary economy, with record numbers of Portlanders unemployed and underemployed, the shared work space is hoping to tap into the city’s DIY sensibility to foster innovation, creativity and a new connection to work. But similar projects have tried here before --- and failed. Will ADX’s new approach pencil out?

Located on the edge of Portland’s eastside industrial district, ADX (Art Design Portland) occupies a 10,000-square-foot warehouse once filled by Apex Manufacturing. The warehouse has since been gutted and renovated, with the letters ADX printed across its façade.

Inside, the bright space smells of new paint and freshly cut wood. “It’s our first day” says founder Kelley Roy as we walk to the makeshift interview area — three wooden chairs set in front of the company’s gallery space. A slow-moving Labrador trails us and lies down at Kelley’s feet.

Kelley ticks through her professional history as if one gig could only have led to the next: Program Manager for Metro, green building developer, founder of food source and prep company Get Fresh NYC, author of Cartopia: Portland’s Food Cart Revolution, and now founder of ADX. “Everything I’ve done is about bringing people together over something I cared about,” she says. “Bringing people back together and giving them a place to work, to make their own jobs, do meaningful work. It’s just important to me.”

Her business partner, Eric Black, joins us a minute later. Trained as an architect, Eric spent the past seven years at the architecture firm Yost Grube Hall in downtown Portland. From there he moved on to found the first iteration of ADX, located in a 3,000-square-foot building on southeast 9th avenue. This first version of ADX was a shared workspace and shop for architects, with 1,000 square feet of gallery space.

The pair met when Kelly needed space to show work for a visiting artist friend, and ended up leasing the ADX gallery. It was then that they began re-envisioning ADX as a true cross-disciplinary work space.  “We started to prototype the idea of what it could really mean within that space,” says Eric. “It was a nice test.”

The pair secured a $145,000 loan from Albina Opportunities Corporation and Mercy Corps Northwest to lease, renovate and equip their new building. The nonprofit lenders stepped in to support ADX because they saw its potential as a jobs catalyst, an objective not lost on Kelley: “We’d really feel that sense of success in what we’re trying to create if those jobs really thrive here in Portland. Take the bad economy and the lack of jobs and turn it into an opportunity.”

Shared builder spaces have popped up around the country throughout the last decade. 3rd Ward, a shared work space in New York’s Williamsburg’s neighborhood, was founded in 2006 by Jason Goodman and Jeremy Lovitt as a response to the city’s prohibitively expensive artist studio rates. The company has more than doubled membership in the past year, reaching1,250 members and bringing in over 200 instructors to teach everything from studio lighting to welding. It employs 20 full and part-time staff. 3rd Ward is currently expanding to the second floor of their building, adding 10,000 square feet of classrooms, a wood shop, tech and photo studios and more shared work space. The company has been growing throughout the recession, wrote Jessica Tom, director of marketing, “As people lose their jobs, we pick them up as freelancers who use our space as their company structure."

***

Early interest in ADX, to the pairs’ surprise, came largely from local creative firms, as opposed to the casual hobbyist. The firms signed up for ADX membership include The Official Manufacturing Company, Factory North, Hand Eye Supply, Build Design and Kate Bingaman Burt.

The success of these firms largely hinges on the fact that they actually make what they design. “I think people are so tired of the plastic nature of the way things are made” says Eric, “they want something better, and they see it can be better if people actually put their hand to it than if a machine makes it.”

The Official Manufacturing Company was in the process of tooling up their own shop when they stumbled across ADX and decided to lease the attached office. For Official Manufacturing, the access to space and tools made sense. “If we weren’t subleasing from them we definitely would have a business membership, and use the tools we wouldn’t be able to afford on our own,” says founder Fritz Mesenbrink.

For the weekend hobbyist or entrepreneur needing a little help realizing his or her concept, ADX has assembled a cohort of experts — designers, videographers, architects — dubbed the “Gang of Ten.” This group of experts pays for desks and access, and offers their consulting services at a 10 percent discount to other members.

The model has allowed ADX to diversity revenue streams: one third from memberships, one third from classes and workshops, and one third from the Gang of Ten fees. Once the space has a healthy community of builders, says Kelley, they’ll begin selling pieces from individual members under the ADX label. “Sort of like Ikea,” she laughs.

The numbers haven’t always penciled out for similar operations, however. TechShop, founded out of the Bay Area in 2006, opened several franchises across the country. One of these locations on the outskirts of Portland, in Beaverton, was forced to file for Chapter 7 bankruptcy in 2010 after low membership turnout.

But, Kelley notes, TechShop was in the wrong location (suburban Beaverton) and with memberships starting at $99 a month, was too expensive for the casual hobbyist. Kelley hopes ADX, with its multiple revenue streams, central location and affordable rates (starting at $25 a month) can be profitable within a year.

Rather than franchising, says Kelley, ADX is interested in partnering with existing maker spaces like 3rd Ward. “They did a lot of research to figure out what their community needs were, and they’re serving the needs of their community — that’s what we did here.”

In a dreary economic climate, the community seems to be responding well: ADX’s open houses enjoyed healthy turnouts, and Kelley and Eric report they are on track to meet their yearly subscription goals. “I don’t know if it’s tied to the recession, but I do think that people are getting over modernism, from a design standpoint,” says Eric “People are actually recognizing high craft.”

Kelley relates the rising consciousness around manufacturing to the organic and local food movement: “I think it’s the same thing with objects. It’s not mainstream yet, but there’s a certain sector of people who care, and care about the people who are making and designing things.”

“Think about it,” says Eric “A hundred and fifty years ago, everything in your life was made by somebody that you knew; that wasn’t that long ago.”

Written by Ilie Mitaru for Stake, a new business magazine set to launch this fall. You can read more and support thepremier issue here.

Moving from the Coast

$
0
0

For years both government and media have been advancing the notion that   America's coastal counties are obtaining most of the population growth at the expense of interior counties. For example, the National Oceanic and Atmospheric Administration reported in the 1990s: Coastal areas are crowded and becoming more so every day. More than 139 million people–about 53% of the national total–reside along the narrow coastal fringes.

NOAA went on to say that the population of the coastal counties is expected to increase by an average of 3600 people per day and noted further that the coastal counties were growing faster than the nation as a whole. NOAA has designated 673 counties on four coasts (Atlantic, Gulf, Pacific and Great Lakes) in the contiguous United States, Hawaii and Alaska as coastal counties.

Population Growth: In fact, coastal counties are not growing faster than the nation as a whole and were not when NOOA issued the 1990s report. For most of the last 40 years, the nation's interior counties have been adding more population. From 1970 to 2010, interior counties added 55.7 million new residents, compared to 49.7 million new residents in coastal counties. This is a reversal from 1940 to 1970, when two thirds of the nation's population growth was in the coastal counties.

The trends today actually have become more favorable for the interior than at any time in a century. From 2000 to 2010, the interior counties captured more of the nation's growth than in any decade since 1900 (Table). From 2000 to 2010, the interior counties added 16.0 million residents, 59.6 percent of the nation's growth compared to 11.4 million new residents in the coastal counties.

Coastal and Interior Population: Counties
1900-2010
Coastal Counties Interior Counties United States
Year Population Share Change Population Share Change Population Change
1900         30.2 39.7%         46.0 60.3%         76.2
1910         38.2 41.4%           8.0         54.0 58.6%           8.0         92.2         16.0
1920         46.2 43.6%           8.0         59.8 56.4%           5.8       106.0         13.8
1930         57.4 46.6%         11.2         65.8 53.4%           6.0       123.2         17.2
1940         62.3 47.1%           4.9         69.8 52.9%           4.0       132.2           9.0
1950         75.2 49.9%         12.9         75.5 50.1%           5.7       150.7         18.5
1960         94.4 52.6%         19.2         85.0 47.4%           9.5       179.3         28.6
1970       109.9 54.0%         15.6         93.5 46.0%           8.5       203.4         24.1
1980       119.8 52.9%           9.9       106.7 47.1%         13.2       226.5         23.2
1990       133.4 53.6%         13.6       115.3 46.4%           8.6       248.7         22.2
2000       148.2 52.7%         14.9       133.2 47.3%         17.9       281.4         32.7
2010       159.6 51.7%         11.4       149.1 48.3%         16.0       308.7         27.3
Population in Millions
Calculated from US Census Bureau Data
Coastal counties designated by NOAA (673 counties)
Totals may vary due to rounding


As of 2010, the coastal counties have 51.7 percent of the nation's population, having dropped from 52.7 percent in 2000 and a peak of 54.0 percent in 1970 (Figure 1). Rather than adding 3600 new people every day, coastal counties added 3100 people per day, while interior counties added 4400 per day during the 2000s. A smaller sample of 559 counties that was examined by economists Jordan Rapaport and Jeffrey Sachs in the early 2000s experienced an even more pronounced movement away from the coasts between 2000 and 2010, with more than 60 percent of the nation's growth taking place in the interior counties.

There may also be some concern about density in coastal counties.   Yet Malthusian fears need not grip coastal residents. With a population density of approximately 315 per square mile (120 per square kilometer), the coastal counties of the contiguous United States have only a slightly higher density than the post-enlargement 27-nation European Union. The coastal counties have a density one-half that of Germany. In contrast, the interior counties are far less dense, at 60 persons per square mile.

There has also been significant change in coastal population trends since the middle 1990s. The largest Pacific Coast metropolitan areas, such as Los Angeles, San Francisco, San Diego, San Jose and Seattle have seen their growth slow considerably. In the 1990s, NOAA was projecting huge population increases for Los Angeles and San Diego counties. It appears likely that these 2015 projections will fall at least 600,000 short in both counties. Even Seattle, arguably the healthiest economically among the west coast metropolitan areas, is now growing more slowly than former laggards Oklahoma City, Indianapolis and Columbus in the interior.

Regional Population Growth: There was significant variation in growth among the varied regions of the country. In the Northeast, there was much stronger growth on the coast, which added 1.6 million people, compared to a gain of less than 150,000 in the interior. In the Midwest, the coastal counties (along the Great Lakes) lost 120,000 people, while the interior counties gained 2.7 million. In the South, the interior grew more, at 8.1 million, slightly more than 6.3 million in coastal counties.  In the West, interior counties gained 5.1 million people, while the coastal counties gained 3.7 million (Figure 2). This drop in coastal growth was a principal reason why the West grew less quickly than the South, which experienced the most robust coastal growth. For this reason, the West failed to be the nation's fastest growing region for the first time since 1900.

Personal Income: Rappaport and Sachs noted in their early 2000s work that the density of economic activity was far greater in the coastal counties. Of course this is to be expected, due to their greater population density. However the data with respect to the distribution of personal income is less clear. Since 1969, coastal and interior counties have been alternating leadership in personal income growth per capita. During the 2000s, interior counties experienced average personal income growth slightly less than that of the coastal counties (Figure 3). However, average per capita income since 1970 has risen 81 percent, compared to a lower 75 percent in the coastal counties (adjusted for inflation).  Overall, the share of income in the interior counties has been growing modestly (Figure 4).

Domestic Migration: The most important factor in the growth of the interior counties in the 2000s lies with net domestic migration, with more residents moving from the coastal counties to the interior counties. Between 2000 and 2009, 4.5 million people moved to the interior counties, while 4.5 million people moved away from the coastal counties, according to Census Bureau estimates (Figure 5).

Rappaport and Sachs had theorized that the greater concentration of population and economic activity in the coastal counties could be reflective of a more attractive quality of life. The domestic migration data would suggest that, at least over the last decade, people are opting for the interior, perhaps sensing that the coastal quality of life may not be as affordable and accessible as in the past.  

Cost of Living: The key here lies with the cost of living, which has become far higher on the coasts then in the interior. The most significant cost of living differences for households are in the cost of housing.   

From 2000 to 2009, housing affordability deteriorated markedly in the coastal counties. Census Bureau data indicates that the Median Multiple (median house founded divided by median household income) rose from 3.6 to 5.4 in the coastal counties (population weighted). By contrast, housing affordability worsened far less in the interior counties, where the Median Multiple rose from 2.5 to 3.1. Thus, the median household saw owned housing increase 22 months worth of income in value in coastal counties, compared to seven months worth of income in interior counties (Figure 6). At the same time, these higher coastal house prices developed as demand for housing was dropping substantially, with 4.5 million people moving away from coastal counties (above).

Many of the coastal counties have strong land use regulation (smart growth or urban containment regulation), especially in California, Oregon, Washington, Florida and the metropolitan areas of Boston, New York and Washington. A considerable body of research, both econometric and descriptive, has associated more restrictive land use regulation (called smart growth, urban consolidation or urban containment) with higher house price increases, reaching back at least to the seminal 1970s work by Sir Peter Hall and his associates in the United Kingdom. It thus seems likely that the deterioration of housing affordability in coastal counties is materially associated with their less robust growth. The quality of life on the coasts may simply have become too expensive.

The Future? It is unclear whether the recent higher population growth rates, stronger migration trends and improved economic performance of the interior will continue into the future. The 1940 to 1970 dominance of the coastal counties surged as coastal metropolitan areas, especially in Florida and California, grew much more quickly. Now that pattern has been reversed.  More favorable trends over the past 40 years in the interior counties seem likely continue, unless coastal house prices and the cost of living begin to swing back toward the national norm.

----

Note: Complete county data is at County Coastal Population (also attached to this article)

Photograph: San Diego, which experienced greater domestic outmigration than Pittsburgh in the 2000s.

How Los Angeles Lost Its Mojo

$
0
0

Los Angeles today is a city in secular decline. Its current political leadership seems determined to turn the sprawling capitalist dynamo into a faux New York. But they are more likely to leave behind a dense, government-dominated, bankrupt, dysfunctional, Athens by the Pacific.

The greatness of Los Angeles stemmed from its willingness to be different. Unlike Chicago or Denver or New York, the Los Angeles metro area was designed not around a central core but on a series of centers, connected first by railcars and later by the freeways. The result was a dispersed metropolis where most people occupied single-family houses in middle-class neighborhoods.

Lured by the pleasant climate and a business-dominated political economy, industries and entrepreneurs flocked to the region. Initially, the growth came largely from oil and agriculture, followed by the movie industry. Defense and aerospace during World War II and the postwar era fostered a vast industrial base, and by the 1980s Los Angeles had surpassed New York as the nation's largest port, and Chicago as the nation's leading industrial center.

The region hit a rough spot as the end of the Cold War led to massive federal cutbacks in aerospace. Los Angeles County lost nearly 500,000 jobs between 1990 and 1993. But it bounced back, adding nearly 400,000 jobs between 1993 and 1999. Aerospace never fully recovered, but other parts of the industrial belt—including the port and the apparel and entertainment industries—grew. An entrepreneurial class of immigrants—Middle Eastern, Korean, Chinese, Latino—launched new businesses in everything from textiles and ethnic food to computers. The pro-business mayoralty of Richard Riordan and the governorship of Pete Wilson restored confidence among the city's beleaguered companies.

Then progress stalled. Employment stayed relatively flat from 2001 until 2005, when Mayor Antonio Villaraigosa was elected, and then started to drop. As of this March, over the entire L.A. metropolitan area, which includes adjacent Orange County, unemployment was 11.4%—the third-highest unemployment rate of the nation's 20 largest metro areas.

Why has Los Angeles lost its mojo? A big reason is a decline in the power and mettle of the city's once-vibrant business community. Between the late 1980s and the end of the millennium, many of L.A.'s largest and most influential firms—ARCO, Security Pacific, First Interstate, Union Oil, Sun America—disappeared in a host of mergers that saw their management shift to cities like London, New York and San Francisco. Meanwhile, says David Abel, a Democratic Party activist and publisher of the influential Planning Report, once-powerful groups like the Los Angeles Chamber of Commerce and the Los Angeles County Economic Development Corporation lost influence.

The machine that now controls Los Angeles by default consists of an alliance between labor and the political leadership of the Latino community, the area's largest ethnic population. But since politicians serve at the whim of labor interests, they seldom speak up for homeowners and small businesses.

Mayor Villaraigosa, a former labor organizer, has little understanding of private-sector economic development beyond well-connected real-estate interests whom he has courted and which have supported him. He has been a strong backer of L.A. Live, a downtown ports and entertainment complex, and other projects that have benefited from favorable tax treatment and major public infrastructure investments. He's currently supporting a push to build a new downtown football stadium, though L.A. has no professional football team. His biggest priority is to build the so-called subway to the sea, a $40 billion train line to connect downtown with the Pacific.

But L.A.'s downtown employs a mere 2.5% of the region's work force; New York's central business districts, by contrast, employ roughly 20%. "To put the entire focus of development on downtown L.A.," says Ali Modarres, chairman of the geography department at Cal State Los Angeles, "is to ignore the historical, cultural, economic [and] social forces that have shaped the larger geography of this metropolitan area."

Moreover, the mayor's accent downtown is on housing, not manufacturing. And as Cecilia Estolano, former head of the Community Redevelopment Agency, points out, "downtown housing simply doesn't create the jobs that small manufacturers do."

Meantime, business-strangling regulations proliferate, often with support from a powerful and well-heeled environmental movement, which Mr. Villaraigosa counts on for political support and media validation. There are draconian moves to control emissions at the port from ships and trucks. Also harmful are the city's efforts to expand the unions' presence from the docks to the entire network of trucks serving the port—essentially forcing out independent carriers, many of them Latino entrepreneurs, in favor of larger firms using Teamster drivers.

Such policies could backfire, says economist John Husing, leading shippers to transfer their business to cheaper and less heavily regulated ports such as Charleston, Houston, Savannah and other growth-oriented southern cities. This is particularly dangerous given the planned 2014 widening of the Panama Canal, which will make Southeastern ports far more competitive for Asia-based trade. Mr. Husing notes that L.A.'s port is the largest generator of blue-collar employment in the region.

Even some liberal Democrats are beginning to realize that the current system isn't sustainable. Writing recently in the Los Angeles Business Journal, Roderick Wright, a Democratic state senator from south Los Angeles, compared the state and local governments with the Mafia. The "vig" that government takes from local businesses, Mr. Wright argued—both in taxes and in the cost of regulation—has undermined job creation, particularly in working-class districts like his. He also warned that renewable-energy mandates recently imposed by the state would boost the cost of energy in the region, already 53% above the national average, by an additional 20% to 25%.

Who will challenge the machine and its ruinous economic policy? It's not likely to be the city's enervated business sector. But the city's working and middle classes might, says Ron Kaye, former editor of the San Fernando Valley–based Daily News. He points to the city's remaining middle-class homeowners, who are concentrated in the San Fernando Valley but also occupy a number of diverse neighborhoods. "These are the places that reflect the whole idea of L.A., as opposed to the Villaraigosa vision of a city of apartment dwellers," Mr. Kaye says.

It is uncertain if Los Angeles will experience the Sunshine Revolution it so desperately needs. What is certain is that only when the machine and its masters no longer dictate L.A.'s fate can this diverse and dynamic region resume its ascent toward greatness.

This piece originally appeared in the Wall Street Journal and is adapted from the Summer 2011 edition of The City Journal.

Joel Kotkin is executive editor of NewGeography.com and is a distinguished presidential fellow in urban futures at Chapman University, and an adjunct fellow of the Legatum Institute in London. He is author of The City: A Global History. His newest book is The Next Hundred Million: America in 2050, released in February, 2010.

Photo by pinchof

The 2012 Vote: A Newly Diverse Center

$
0
0

Demographic transformations are changing how the American people vote. In 2010, only 15 per cent of Americans claimed to be completely unaffiliated independent voters, while 48 per cent identified with the Democratic Party and 37 per cent with the Republican Party. Back in the 1990s, party identification was at 44 per cent each.

The Democrats' advantage is due in large part to Millennial voters, recognised as the biggest and most important new voting cohort in America politics. Sometimes referred to as the ‘youth vote’, Millennials are generally born between 1982 and 2003. The Democratic advantage can also be attributed to an increase in Hispanic voters, who identify as Democrats over Republicans by a 2:1 margin.

According to a study released in May by the Pew Research Center, of those registered voters in America who identify as Republicans, 14 per cent hold conservative views on most issues, 14 per cent are moderates with liberal views on most social issues, 11 per cent are staunch Tea Party conservatives, 11 per cent are disaffected down-sizers and 10 per cent are free market, small government libertarians. Of those registered voters who identify as Democrats, 16 per cent are solid Democrats (liberal on all issues), another 15 per cent are hard pressed (religious, and financially struggling),and 9 per cent are New Coalition Democrats (positive, minority-rights oriented).

Many American voters are choosing not to identify with either political party. Unlike the Australian Independent voter, those Americans who reject the major parties, rather than moving towards the fringes, are flocking to the centre of the political spectrum. This has resulted in the centre becoming increasingly diverse.

Surprisingly, the two independent members of the Senate, Bernie Sanders (Vermont) and former Democrat Joe Lieberman (Connecticut), rather than being centrists, hold strong ideological positions on issues such as the role of government, immigration, and the environment. Their election defies liberal or conservative orthodoxy and challenges the idea of the centering of the American voter.

Evidence from the Pew report suggests that voters on the Right are polarising. Staunch conservatives are clearly identifiable in polling. These voters take extremely conservative positions on nearly all issues, from the size and role of government to economics, foreign policy and domestic social issues. Most are aligned with Tea Party Republicans in their disapproval of Barack Obama. There still exists a core group of Main Street Republicans, however, they are becoming less identifiable in opinion polls and in national polling.

On the Left, not surprisingly, Solid Liberals express diametrically opposing views from the Staunch Conservatives on virtually every issue. While Solid Liberals are predominantly white, minorities make up greater shares of New Coalition Democrats, who are distinguished by their upbeat attitudes in the face of economic struggles. This group includes nearly equal numbers of whites, African Americans and Hispanics. Hard-Pressed Democrats are about a third African American. Unlike Solid Liberals, both of these last two groups are highly religious and socially conservative.

Some American voters like to be considered Libertarians and Post-Moderns. Both groups are largely white, well-educated and affluent. They tend to be secular and are pro-homosexuality and abortion. Republican-oriented Libertarians, however, are far more critical of government, less supportive of environmental regulations, and more supportive of business.

A survey conducted for the progressive think tank NDN found that a majority of Americans — 54 per cent — favor a government that actively tries to solve societal and economic problems, rather than one that takes a hands-off approach.

Staunch Conservatives and Main Street Republicans share similar views on the positive role of religion in society (90 and 91 per cent respectively), and that immigrants are a burden on American society (68 and 60 per cent). Staunch Conservatives more strongly believe that governments can no longer afford to help the needy (87 per cent) than Main Street Republicans (75 per cent). In relation to the economy and the environment there are significant differences. Staunch Conservatives very strongly believe environmental laws cost too many jobs and hurt the economy (92 per cent), a view not held by Main Street Republicans (only 22 per cent support the claim). Most Main Street Republicans think business corporations make too much profit (58 Per cent). This view is rejected by Staunch Republicans. Only 13 per cent of this group believes corporations make too much profit.

Democratic voters, according to the Pew study, are divided over immigration. Solid Liberals overwhelming agree that immigrants strengthen American society. This is a view held by the very few Hard Pressed Democrats (13 per cent). New Coalition Democrats are more in line with Solid Democrats on the question of immigration (70 per cent think immigrants make a positive contribution). Democrats favor diplomacy as the way to peace: Hard Pressed by 56 per cent), Solid Liberals by 89 per cent. There are also significant differences on gay rights and environmental laws. Over 90 per cent of Solid Liberals support gay rights and environmental protections. Among Hard Pressed Democrats, 43 per cent support gay rights and 22 per cent see environmental laws as hurting the economy and costing jobs. Each of the three Democratic voter groups share similar views on the need for improvements to ensure equal rights for African Americans.

Age is a factor in partisanship and political values. Younger people are more numerous on the Left, and older people on the Right. Staunch Republicans over 50 years of age are the most highly engaged in following government and public affairs (75 per cent).

How do American voters rank Barack Obama? It's not surprising that Republicans disapprove of Obama’s job performance and health care plan. The problem for Obama is that he does not have enough support among Democrat voters to counter Staunch Republicans: Among Solid Liberals, only 64 per cent strongly approve of Obama’s job performance.

Obama’s personal image is positive among American voters, but his job approval rating is low. Doubts raised by ‘birthers’ continue to get traction in American politics. More than one-in-five Americans (23 per cent) say, incorrectly, that Obama was born outside the United States.

This new portrait of the American voter will challenge both Democrats and Republicans in the lead-up to the 2012 presidential election. For politicians on both sides, the challenge is to appease the ideological and moderate wings, each with competing goals and aspirations, and at the same time to ensure that each wing does not break out into disagreements with the other over core principles. The Tea Party Conservatives and Republicans have recently gone to the brink, but managed to pull back 'for the sake of the Party’.

Perhaps the answer is in Bertolt Brecht’s quip: “Would it not be easier for the government to dissolve the people and elect another?”

Dr Scott Denton completed a PhD on Australian elections in 2010. He is an academic at the University of New South Wales, Sydney, who regularly writes on Australian and American elections and electoral history.

Photo by Ho John Lee (HJL): Vote!

Sustaining the Suburbs

$
0
0

The proposition is simple, if not overwhelming.  If we want sustainable cities – however you define “sustainable” – we had better put some effort into the quality of suburban life.  We need to get over denigrating suburbs and sprawl.  That simply ducks the issue of where and how most people spend most of their time.  We need to moderate a preoccupation with promoting CBD and big centre lifestyles.  Those are places that people want visit, but not necessarily where they want to live.

Come back Jane, our suburbs need you
It’s fifty years now since Jane Jacobs’ landmark book about saving North American cities from themselves.  She argued against the prevailing push for urban renewal as displacing communities and destroying street life with motorways, car parks, and bland commercial development.  Jacobs’ writing and her activism inspired a resistance credited with saving inner city villages, helping retain the human character of large cities, and inspiring a generation of urban designers and planners. 

There is no doubt that the Jacobs message took hold in New Zealand.  It’s become compelling since the crash of ‘87 slowed down the razing of inner city blocks and marked the beginning of the end of the white collar CBD.  Hanging on to what we've got is one way to stop the hollowing out.

Unfortunately, today’s call for central city mega projects on which to stake a claim to an international presence and the push for large scale CBD residential development on which to stake a claim to environmental stewardship run the risk of reversing the gains to inner city life.  High rise apartments, tracts of high density housing, and grandiose civic plans risk undermining the essence of the central city in the same way as urban renewal and freeways once did.

But that’s not what this posting is about.  The reality is that the bulk of our populations live in the suburbs; the suburbs that are growing the most; and that’s where we need to promote the capacity for people to live fulfilling lives.  That’s where today we need to promote street life and be wary of the threats posed by the new urbanists and their grand plans for intensification.

Most people still live in the suburbs
Its obvious that most people still live a suburban life.  But that doesn't seem to be appreciated by the people who plan our cities today, even as the number of suburban residents keeps growing.

Look at the three metropolitan areas in New Zealand, not big by international standards, but nevertheless reflecting an entrenched trend in the developed world – a move to decentralise.  The numbers say it all. 

Over the last 14 years population growth has been totally dominated by the suburbs.  In Auckland, the inner city accounted for only 6% of a 326,000 person increase.  In other words, 305,000 opted to live in the suburbs and beyond, compared with 21,000 in the central city.  In Christchurch, the CBD accounted for just 1% of population growth and the rest of the inner city 2%.  Wellington, the capital city with a distinctively constrained setting did much better, but a revitalised CBD still accounted for just 10% of population growth. [1]

Population Growth in the Central City: Auckland, Wellington, Christchurch, 1996-2010
Source: Statistics New Zealand

And they still favour the outer suburbs

Let’s break this down a little further.  Greater Christchurch Urban Development Strategy Partners (http://www.greaterchristchurch.org.nz/) came up with a plan for consolidating the city.  This includes policies promoting central city living or living around established commercial centres and development contained largely within metropolitan limits.  Well, we can see the warning signs for this sort of thinking from the very small share of recent growth in the inner city.  It seems that the new plan is set to fly in the face of recent experience.   

And if we divide Christchurch's suburbs into three groups (inner, outer, and periphery) we find the decentralising tendency that it is set against is even stronger . [2]

Population Growth in Christchurch Suburbs, 1996-2010

The peripheral suburbs on the city fringes have led growth rates, while the outer suburbs have led absolute growth.  (That’s if we overlook the fact that the small towns in Christchurch’s hinterland left out of this analysis have grown at even faster rates, with the adjoining districts two of the fastest three growth areas in New Zealand).

Does it make sense to stem this pressure?  Not if we want the cities to continue to grow, because the majority of people clearly favour suburban living, and that’s where the greatest capacity for accommodating them lies. 

So while it’s exciting to record rapid growth rates of population gain in our inner cities, policy makers really need to make sure we are doing the right thing by our suburbs. 

Places to live ...
This may mean, for example, ensuring that we don’t sacrifice too many of the green spaces to high density housing: our suburbs also need to breathe.  If we want to lift densities, then terraced units and the occasional low rise apartment may be all we need.  They are probably the most easily achieved forms of intensification in areas where consolidating sites is notoriously difficult and where existing residents will fight to preserve existing character. 

Better still may be judicious development of greenfield sites, where we can boost densities by applying the principles of Smart Growth without destroying what people value about what went before, without overloading existing facilities and infrastructure, creating attractive public and private realms, and potentially enhancing rather than trashing biodiversity, water and air quality.

Places to work ...

>We will also need to promote neighbourhood centres to ensure that they can accommodate diverse activities and services, that they are easy to get to and get around, well appointed and vibrant.  They may even become the focus of modest park and ride facilities, the framework around which flexible public transport within and beyond the neighbourhood can best be delivered.

It may be timely to review what in our planning provisions force people to make regular cross-city journeys to work, and whether this can be changed through more decentralised employment. 

Places to play ...
While local centres are becoming the focus of community and neighbourhood commerce and culture, suburban parks and gardens will also have a role to play.  We need good spaces close to the majority of homes for sport and recreation, and safe local places for families and children to gather.   

We might more actively protect some of the informal spaces in our suburbs, and take a broad view of what constitutes heritage in doing so.  We may have to protect landscapes and structures because they are iconic in local areas, not because we believe they may have national or international significance.  Where they don’t exist, we may even have to create the landmarks, the parks and town belts, and the structures that reinforce local identity and culture.

Strong suburbs for a strong CBD
By allowing more things to happen in the suburbs without overloading them with bland residential development or tracts of mixed use that fall between urban design stools, we have an opportunity to advance the planners’ live-work-play mantra, and to enhance the sustainability of our cities. 

Ultimately, it is the quality of day-to-day life in a city and its capacity to attract and hold skilled and motivated people that will determine its prosperity.  And it is those people and that prosperity that will underwrite the health of the CBD.  Without strong suburbs, we cannot sustain a strong CBD.


[1]            For this exercise, the following council areas were counted, Kapiti, Porirua, Upper and Lower Hutt, and Wellington City.
[2]           This classification omits the largely rural Banks Peninsula which is quite separate from the metropolitan area.

Phil McDermott is a Director of CityScope Consultants in Auckland, New Zealand, and Adjunct Professor of Regional and Urban Development at Auckland University of Technology.  He works in urban, economic and transport development throughout New Zealand and in Australia, Asia, and the Pacific.  He was formerly Head of the School of Resource and Environmental Planning at Massey University and General Manager of the Centre for Asia Pacific Aviation in Sydney. This piece originally appeared at is blog: Cities Matter.

Photo by New Zealand Defence Force.

Things They Don't Tell You About GDP

$
0
0

I was watching Book TV on C-SPAN last week and I came upon Mr. Ha-Joon Chang talking about his book “23 Things They Don’t Tell You About Capitalism.” For example, Thing #1 is “there is no such thing as a free market.” I actually use this line in my finance and economics courses. If someone thinks there is, I tell them to walk into the office of any securities lawyer and look at the books on the shelf – there are a mountain of regulations just for the stock market. There wasn’t anything in Ha-Joon’s book that I didn’t already know about capitalism – but I spent 11 years in college earning 3 university degrees to learn it. I’m assuming most of my readers have had better things to do than spend that much time in the library.

It got me thinking. What else doesn’t the general public know about economics? I decided to let you in on some secrets you may not know about the Gross Domestic Product (GDP), a number you see every day in the news as a measure of the performance of the national economy.

Many people believe that the GDP comes from something like an income statement prepared by accountants.  It does not.  The GDP is an estimate of the total output of all production that occurs in the nation.  The Bureau of Economic Analysis (BEA) estimates the GDP using a variety of assumptions based on information reported from surveys conducted by the Census Bureau and from tax returns submitted to the Internal Revenue Service (IRS).

The BEA began by creating concepts and a structure of accounts to create an idea for implementing a theoretical income statement for the nation. If the data were 1) accurate, 2) always available, and 3) fit their definitions exactly, then the estimate of income would always equal the estimate of output.  It does not, however.  The “statistical discrepancy” between estimated income and output for the first quarter of 2011 was 1.3 percent of the GDP or about $180 billion.  This discrepancy cannot be accounted for by anything other than how the numbers are created.

Since some data is simply not available, BEA has to make assumptions about the direction of the changes that they cannot record.  For example, for the first quarter of 2011, the BEA assumed that nondurable manufacturing inventories increased, exports increased, and imports increased. When you read that exports increased this year, that is because the BEA assumed it increased – they did not actually have any data to measure it when they released the new GDP numbers.

Some data that the BEA needs, such as new car sales, are simply not reported anywhere.  Thus, the BEA developed estimating methods that adjust the data they can collect to match their concepts.  When they need to fill in missing data, the new values are estimated from average list prices, rather than actual sales prices.  For example, “an estimate of expenditures on new cars is calculated as the number of cars sold times average list price” for all cars (at transaction prices—that is, the average list price with options adjusted for transportation charges, sales taxes, dealer discounts, and rebates).  One obvious problem with this approach is that few people pay the actual list price for a car.  Note also that this is not the number of 2010 Toyota Corollas sold times the list price of 2010 Toyota Corolla and the number of 2010 Mercedes C240s sold times the list price of a 2010 Mercedes C240, etc.  It is estimated as the number of all cars sold times the average list price of all cars.

Some of the data that the BEA uses comes from IRS income tax reports, which use different definitions for income and expenses; or from surveys conducted by the Census Bureau which does not survey all the categories the BEA uses.  Import data comes to us “in a bilateral data exchange” with other countries.  Some values come in as valued at the point of manufacture; the BEA adjusts “these data to foreign port value by adding the cost of transporting the goods” within the other country from the point of manufacture to the point of export to the U.S.  This adjustment is made using average known costs of transportation.

The BEA also estimates wages as the number of people employed times the average hourly earnings times the average hours worked.  As income inequality rises – hence, salaried employment wages move further away from hourly employment wages – these reported incomes may become increasingly less accurate.  An estimate of interest received may be calculated as the stock of interest-bearing assets times an effective interest rate.  The BEA collects employment data in the middle of the month, which is assumed to represent conditions for the entire month – so they make judgment calls to adjust employment data when there are “significant events” like blizzards on the east coast or hurricanes in Florida, which occur after the data is reported.

Sometimes there just is no primary source data and the entire category is estimated.  The BEA makes seasonal adjustments, uses moving averages, inputs new data as “best level” or “best change,” and data series are interpolated and extrapolated.  All of that happens before we even begin to discuss the several methods available for calculating adjustments for inflation.

Don’t put too much weight on every number reported about the economy.  When politicians start talking about, say, the impact of new tax rules on the GDP, they are not just comparing apples and oranges – they are making apple sauce! When someone asks me – a professional economist – how I think the economy is doing, I tell them: “Look out your window.” Do your neighbors have jobs? Are the streets being cleaned and the trash being picked up? Is there more or less traffic when you go to work or the grocery store? Any of those signs will tell you as much as the GDP will about the economy.

Susanne Trimbath, Ph.D. is CEO and Chief Economist of STP Advisory Services. She will be participating in an Infrastructure Index Project Workshop Series throughout 2010. Her training in finance and economics began with editing briefing documents for the Economic Research Department of the Federal Reserve Bank of San Francisco. She worked in operations at depository trust and clearing corporations in San Francisco and New York, including Depository Trust Company, a subsidiary of DTCC; formerly, she was a Senior Research Economist studying capital markets at the Milken Institute. Her PhD in economics is from New York University. In addition to teaching economics and finance at New York University and University of Southern California (Marshall School of Business), Trimbath is co-author of Beyond Junk Bonds: Expanding High Yield Markets.

Image courtesy of US BEA.

Banana-nomics

$
0
0

The price of bananas is again making headlines as it pushes up inflation and threatens rising interest rates. But what’s the price of the humble ‘nana got to do with property markets? Plenty.

Banana prices have risen almost 500% since Cyclone Yasi wiped out much of north Queensland’s banana crop earlier this year. The immutable laws of supply and demand dictate that when supply falls relative to demand, prices will rise. Which is what they have done, and as they did a few years ago when the same thing happened after Cyclone Larry. As banana supply was restored, prices fell. As they will again.

Banana prices are a self-evident, every day example of supply and demand at work. They’re the sort of example understood by consumers and even school children with no formal economic training. But clearly the lessons are beyond the capacity of some Australian politicians, most land regulators and many town planners. In the very same way that constraints on supply create scarcity value for every day commodities, constraints on supply and scarcity equate to rising prices for all types of real estate, not just housing.

It starts with misguided planning schemes that aim to direct consumer behaviour and distort their purchasing decisions by limiting choice. This has become commonplace in planning to the point of representing accepted wisdom. One of the most obvious examples has been the continued efforts by some regulators and planning authorities to attack the detached house as a choice – however best suited to the needs of young families – which ‘Australia can no longer afford.’ Like a contemporary version of Stalinist central command, housing choice is distorted via planning schemes that are biased to high density apartments in central locations (that consumers are told is good for society), as opposed to detached housing on the urban boundary (that remains the majority consumer preference). Faced with little choice, more people are forced to choose the option deemed appropriate by higher authorities than themselves, and when this is later reflected in data, the regulators hail this as some sort of fundamental change in consumer preferences. You’re seeing this type of shallow analysis in the media, pushed by various interest groups, on a regular basis now.

An equally significant consequence of using planning ideology to achieve social engineering outcomes has been the impact on prices. In the case of raw land for housing, we have succeeded in the unimaginable – needlessly elevating prices far beyond the reach of average Australians, on the basis that we may run out of land, in a country where land is plentiful. This has been achieved simply by making raw land for detached housing development scarce because permission is not allowed outside artificially drawn urban planning boundaries. (On top of creating scarcity, of course, new land supply is taxed more aggressively than existing supply, via upfront levies. This is no doubt because there are fewer votes at risk in taxing new housing lots as opposed to raising council rates or other broad based revenue measures. Plus, new supply is tied up in a regulatory tangle which now means it can take 5 or 10 years just to get permission to develop land in areas already described as intended for future housing. Go figure).

The proof is readily available. In the Brisbane region, for example, the price of vacant land per metre is now 2.3 times (230%) what is was a decade ago. Established house prices also increased, but at a lower rate – they are 1.5 times (150%) the price a decade ago. Average weekly earnings, just to bring it back to earth, are 0.6 times (60% higher) what they were a decade earlier.

In Melbourne, where supply constraints have been more sensibly managed, land for housing is 1.3 times the price of a decade earlier. Little wonder developers are giving up hope for south east Queensland and focussing their energies in Victoria.

If the fundamentals of supply and demand (let’s call it banana-nomics) are so obvious in the market for new land for housing, where else are they revealing themselves?

Recent reports have noted that Australian retail property rents (a lot like our housing prices) are amongst the highest in the world. Research by CB Richard Ellis suggests that rents in Sydney, Melbourne and Brisbane are higher than the better shopping strips in Los Angeles or Milan. How can this be? Los Angeles County has a population of around 10 million people, some of whom are noted big spenders. Retail demand there would dwarf that of Brisbane’s retail spend.

Once again, the answer lies in supply. LA’s ‘sprawl’ is arguably more about the historically easy dispersion of retail and commercial space along high streets and back roads throughout the metro area, as it is about expanding housing. As LA developed, it was relatively easy to create new retail space, and there is plenty of redundant retail space in older strip areas where secondary traders can operate at low market rents. In Australia, by contrast, planning constraints have been much more onerous. The major retail centres, developed from the 1960s to the late 1990s throughout metropolitan areas largely remain the same major centres we have today. Finding new opportunities for retail expansion is a large hurdle which few clear – protection of the retail hierarchy and existing centres, and preventing a dispersal of retail activity beyond existing areas, is the deliberate intention of urban planning schemes.

The result has been that those with the existing retail centres have paid for, and now own, a precious commodity: the permission to conduct retail activity, with limited threat of competition in that catchment. Our retail rents have grown because retailers – and consumers - have had limited alternative choices. New retail operators have encountered barriers to entry in the form of planning laws and no-compete clauses, once again reinforcing the value of existing permissions. Just ask Aldi or Costco what they think our planning schemes are doing for competition if you don’t believe it.

City carparking is another example of banana-nomics at work. A study by Colliers International reveals that city parking costs in Sydney and Melbourne are more expensive than London, Tokyo or New York. Brisbane came in at 14th most expensive on a global list of 156 central business districts. How can it be? The answer is simply that the anti-car crusade has led to planning policies which deliberately seek to limit CBD parking spaces, in the futile hope that this will somehow force people to abandon the convenience (and frequently the necessity) of private transport in favour of buses or trains.

Those ambitions have never come to much, so regulators then resort to the blunt weapon of taxes – with car parking levies now common in many cities and the prospects of congestion charging for access to CBDs frequently rearing its ugly head. This deliberate attempt to restrict (and then punitively tax) the supply of city parking spaces has the inevitable effect of raising prices.

But there is one fundamental difference between how banana-nomics works for banana growers and property developers. Banana growers can grow more plants and create more supply. The same can’t be said for developers of property. In housing, new supply is likely to remain constrained by growth boundaries and the preference of regulators towards higher and medium density within existing areas. This will create a floor under the cost of new supply which means that prices are unable to fall (they can’t fall below the cost of production). So raw land is unlikely to get much cheaper, unless there are some radical (and many would say much needed) reforms to planning policies around Australia.

The same applies to retail property. Retailers (most recently evidence by Solomon Lew’s Just Group comments about retail rents) may object to high rentals, but they won’t get much option. Major retail centres are where the action is, and the alternative (on-line retail) isn’t sufficiently appealing to the majority of consumers, who get more from their shopping trip than just a retail transaction. New shopping centres won’t be created within existing urban boundaries because planning schemes are unlikely to allow further retail dispersion away from existing centres. In the limited cases where approval is granted, existing centre owners will play hard ball, arguing fervently against the free market (witness Westfield’s objections to a new Aldi Store, approved by Brisbane City Council, north of Brisbane). Their actions are understandable, given they’ve outlaid very large investments that are contingent on the existing planning scheme remaining.

And the same applies to car parking. Unless there’s a monumental shift in policy attitudes to private transport and city car parking, we aren’t going to see multiple new above or below ground public car parks being created in our cities, no matter how much the demand. That will mean prices remain high.
In all cases, it has been the planning regulations that restrict supply and limit choice, not demand, that have been responsible for making our housing, our retail rents, our car parking and so much more, amongst the costliest in the world. And given that those constraints are unlikely to change, you’re unlikely to see that position reverse itself any time soon.
The burning question, of course, is how long can it last? If supply costs elevate prices beyond the capacity or desire to pay, people stop buying. Economies slow down. The music stops.

How do you like them apples?

Ross Elliott has more than 20 years experience in property and public policy. His past roles have included stints in urban economics, national and state roles with the Property Council, and in destination marketing. He has written extensively on a range of public policy issues centering around urban issues, and continues to maintain his recreational interest in public policy through ongoing contributions such as this or via his monthly blog The Pulse.

Photo by Fernanado Stankuns.


A Detailed Look at Workforce Skill Shortages

$
0
0

As the United States continues to fight its way out of the Great Recession, more attention has been directed to the question of why is has taken so long for workers to find re-employment. In economist parlance, this is primarily a question of “structural unemployment.” This describes the type of unemployment that results from a mismatch of worker skills and the skills demanded by employers.

As of April 2011, there were 13.2 million unemployed workers and 2.9 million unfilled job openings. In other words, April’s bulky 8.7% unemployment rate could have been lowered one percentage point (to 7.7%) if just half of the advertised job vacancies were filled by unemployed workers. Obviously, it is not realistic for every position to be filled immediately—it takes time for employers to find the right workers, and vice versa. But the odd pairing of high unemployment and high job vacancies illustrates a structural employment issue, which may have worsened in recent years.

Historically, when the economy is growing, the unemployment rate is relatively low and the job vacancy rate is relatively high, indicating more job openings than there are workers to fill those positions. Likewise, when the economy is shrinking, the unemployment rate is relatively high and the vacancy rate is relatively low, because there are more workers looking for work than there are jobs. This pattern held between 2008 and mid-2009 but from the second half of 2009 through mid-2011, the vacancy rate has remained surprisingly high when compared to the unemployment rate. 1

A question that has perplexed jobseekers and economists alike is how there can be so many people looking for work and yet so many unfilled positions in the economy? In an attempt to answer this question, EMSI has taken a fresh look at the skill gap issue using historic jobs and earnings data to determine which segments of the labor market are growing and which are diminishing. Often when examining shifts in the labor market, analysts will look solely at employment changes and highlight the occupations that have increased or declined in total employment, but we believe this is somewhat shortsighted. This method may not tell the whole story. For example, it is possible for employer demand for a certain occupation to increase or remain the same while actual employment levels drop. 2  Therefore, the addition of the earnings measurement over time adds a great deal to this analysis.

In order to describe this method, a bit of basic economic theory needs to be explained. One of the chief tenants of economics is that in a market that is not exceedingly manipulated by outside forces, demand and supply will meet at a point that is mutually beneficial for both producers and consumers. To put this in labor market economics terms, producers are individuals offering their time and labor for a wage, and consumers are employers seeking the labor of workers in exchange for a wage. The magical meeting place where both groups settle is called “market equilibrium.” Although both parties may not be completely satisfied with the arrangement, they are at least content enough to accept the terms of employment.

Aggregating the data shows that of all occupations in the potential skills shortages category, 66% are in the fields of healthcare; education; business and finance; and architecture and engineering. Conversely, of all occupations in the potential surpluses category, 63% are in the fields of production; construction and extraction; and installation, maintenance and repair.

Following this theory, we can expect that any given occupational category (SOC code) will have a wage and employment level that best represents the demand for workers, and the required compensation level for employees. 3 To complicate matters, the economy is never stationary but is in a continuous state of adjustment and realignment. Although the market for certain workers may be at equilibrium in the fourth quarter of one year, changes influencing supply and demand will likely cause that equilibrium to shift such that the equilibrium will be different in the first quarter of the following year. (Think of the demand for commercial fishermen in the Gulf Coast before and after Hurricane Katrina in 2005).

Based on these theories, EMSI has dug into historic labor market data to look for two characteristic groups:

  1. Potential skill shortages: where employer demand had pushed both employment and earnings upward over time
  2. Potential skill surpluses: where worker availability has exceeded demand and pushed both employment and earnings down over time

The key word in both of these categories is “potential.” These shortage/surplus measurements are, in fact, only half of the equation. A “skill shortage” only exists if workers have failed to acquire the requisite skills to perform the required tasks at a rate equal to demand. Likewise, a “skill surplus” exists only if workers have failed to retrain and find employment elsewhere after losing their jobs. Both of these measurements are difficult to pin down. In the next post, we will examine whether the potential shortage/surplus occupations have received the requisite amount of workers over the past couple of years, but for the moment it will suffice to examine these increases and decreases in demand over time.

To perform this analysis, EMSI analyzed 661 SOC codes in terms of jobs and earnings between 1999 and 2010. In order to get the data to line up properly, self-employed workers and every SOC code that ends with “all other” have been excluded. An occupation appears in the potential shortage category if the wage and employment growth between 1999 and 2010 have exceeded the average by a significant degree; and an occupation classifies in the surpluses category if both wages and employment have decreased by a significant degree. 4

Tables 1 and 2 show the results of this analysis. These tables are ranked by employment in 2010 to provide some gauge of the significance of the potential shortage or surplus. Percent change in employment and percent change in earnings are also shown in these tables.

Table 1: Top 25 Occupations Facing Potential Skill Shortages

SOC Description 2010 Employment 1999-2010 Employment % Change 1999-2010 Median Wages % Change
29-1111 Registered Nurses 2,655,020 20% 17%
13-2011 Accountants and Auditors 1,072,490 27% 18%
13-1111 Management Analysts 536,310 78% 11%
41-4011 Sales Representatives, Wholesale and Manufacturing, Technical and Scientific Products 381,080 11% 23%
13-2072 Loan Officers 283,330 42% 11%
11-9111 Medical and Health Services Managers 282,990 23% 20%
13-1023 Purchasing Agents, Except Wholesale, Retail, and Farm Products 272,370 22% 9%
29-1051 Pharmacists 268,030 18% 27%
13-1031 Claims Adjusters, Examiners, and Investigators 262,540 70% 15%
17-2051 Civil Engineers 249,120 19% 10%
17-2141 Mechanical Engineers 234,400 16% 7%
13-2051 Financial Analysts 220,810 55% 15%
13-1041 Compliance Officers 204,000 65% 16%
29-2021 Dental Hygienists 177,520 97% 10%
29-2011 Medical and Clinical Laboratory Technologists 164,430 13% 11%
25-1071 Health Specialties Teachers, Postsecondary 144,780 101% 6%
25-2043 Special Education Teachers, Secondary School 141,420 18% 11%
17-2072 Electronics Engineers, Except Computer 133,660 25% 11%
11-9151 Social and Community Service Managers 116,480 32% 20%
29-1127 Speech-Language Pathologists 112,530 31% 12%
33-3021 Detectives and Criminal Investigators 110,640 33% 14%
11-9033 Education Administrators, Postsecondary 110,360 15% 16%
29-1126 Respiratory Therapists 109,270 36% 15%
25-2042 Special Education Teachers, Middle School 100,510 16% 20%
29-1122 Occupational Therapists 100,300 27% 12%


Table 2: Top 25 Occupations Facing Potential Skill Surpluses

SOC Description 2010 Employment 1999-2010 Employment % Change 1999-2010 Median Wages % Change
43-5081 Stock Clerks and Order Fillers 1,795,970 0% -6%
53-3032 Heavy and Tractor-Trailer Truck Drivers 1,466,740 -6% -6%
47-2031 Carpenters 620,410 -20% -5%
53-7051 Industrial Truck and Tractor Operators 518,350 -12% -5%
47-2111 Electricians 514,760 -16% -7%
53-3031 Driver/Sales Workers 371,670 -4% -15%
41-9041 Telemarketers 288,760 -41% -8%
43-9041 Insurance Claims and Policy Processing Clerks 231,570 -14% -8%
47-2051 Cement Masons and Concrete Finishers 140,950 -7% -5%
49-3021 Automotive Body and Related Repairers 129,730 -28% -7%
51-3021 Butchers and Meat Cutters 125,910 -9% -6%
49-2011 Computer, Automated Teller, and Office Machine Repairers 110,320 -15% -4%
51-3023 Slaughterers and Meat Packers 88,500 -24% -6%
47-2081 Drywall and Ceiling Tile Installers 82,320 -30% -11%
47-2021 Brickmasons and Blockmasons 68,520 -30% -11%
51-4111 Tool and Die Makers 66,530 -50% -7%
43-5111 Weighers, Measurers, Checkers, and Samplers, Recordkeeping 66,480 -21% -9%
19-4031 Chemical Technicians 59,440 -25% -6%
47-2221 Structural Iron and Steel Workers 58,460 -32% -5%
13-2082 Tax Preparers 56,990 -2% -13%
27-2011 Actors 54,740 -35% -22%
51-4034 Lathe and Turning Machine Tool Setters, Operators, and Tenders, Metal and Plastic 40,970 -51% -7%
49-9044 Millwrights 36,670 -54% -5%
51-3093 Food Cooking Machine Operators and Tenders 32,220 -27% -13%
27-1021 Commercial and Industrial Designers 28,670 -25% -3%

Analysis

So what can be gleaned from this analysis? To start at the highest level, this certainly indicates employers’ preferences are shifting away from manual labor occupations and toward knowledge-based occupations. Aggregating the data shows that of all occupations in the potential skills shortages category, 66% are in the fields of healthcare; education; business and finance; and architecture and engineering. Conversely, of all occupations in the potential surpluses category, 63% are in the fields of production; construction and extraction; and installation, maintenance and repair.

Potential Shortages

To examine some more specific cases, it is interesting that two of the occupations regularly at the center of skill-shortage discussions, registered nurses and accountants, are at the top of this list. (We must emphasize again that this does not indicate that there is a skills shortage for these occupations but rather that the demand for such workers has increased at a rapid rate over the past 11 years; whether or not the output of students has remained apace with this demand will be explored in the next piece.) It is also not surprising that 10 other healthcare positions land on this list, including occupations such as medical managers, pharmacists, and speech-language pathologists.

There are also some surprises on this list, such as the contingent of occupations in the business and financial operations category (e.g., loan officers, claims adjusters, and financial analysts). The prevailing theme with these occupations is that each requires individuals with strong interpersonal skills, as well as strong computational and analytical skills. Over the past decade, both the increase in the rate of information sharing and increased complexity of this information can likely explain why employers have been investing higher wages in these workers.

Management analysts, for example, experienced a wage increase of 11% and employment increase of 78% over the past decade. Their presence on this list highlights the importance of technology in creating job change, as well as changes in business trends. In the past decade, businesses in the professional and technical services sectors have been increasingly hiring businesses and consultants from outside of their own companies to handle departmental work such as advertising, payroll, and human resources. We can account this change, in large part, to the power of technology to move information quickly and efficiently.

Potential Surpluses

Many occupations in the manufacturing category have declined sharply in both wages and employment due to offshoring. On this point, we must specifically state that manufacturing skills are not declining on the global scale. Looking worldwide, there are likely more individuals working as industrial truck and tractor operators and tool and die makers in 2010 than there were in 1999, but today many of these positions are now in developing countries. These reflect situations where without the effect of protectionist policies (such as quotas or tariffs) foreign competition has a competitive advantage over American workers because foreign workers are willing to work for lower wages.

Offshoring is not the only reason that occupations on this list have declined. Just as with the potential surpluses list, technology is the catalyst for many notable changes. Occupations such as stock clerks and order fillers have become less valued in the labor market due to labor-saving technology that efficiently catalogs inventory and computer programs that allow people to make orders for equipment and merchandise without the aid of a middle-man. Likewise, positions such as telephone operators and desktop publishers are quickly becoming obsolete due to advancements that have made telecommunications more accessible for a wider audience.

The large cohort of construction jobs on this list are a consequence of the precipitous drop in construction employment between 2007 and 2010, and these may or may not represent an actual skill surplus. For example, employment for carpenters had increased every year between 1999 and 2007, but between 2008 and 2010 employment decreased by an average of 14% per year; indicating that this may represent a temporary, or cyclical change. On the other hand, wages consistently decreased for all construction jobs by about 0.5% per year over the last decade. This could indicate that a sustained oversupply issue among construction occupations has allowed employers to pay workers slightly less for their labor. Time will tell whether there are too many or just the right number of people in the workforce with construction skills, but it is difficult to say right now.

Conclusion

The dynamic nature of the economy causes routine changes in labor market demand. These data illustrate an important and often overlooked fact: the labor market is driven by all other markets (e.g., markets for cellular phones, houses, and doctor’s office visits, etc.). Over time, we can see labor market changes occurring, for instance, when the number of product orders conducted over the internet increase because there are jobs required to support that increase. At the same time, there are jobs that will be lost because they are no longer the most efficient way to address consumer demand. It is easy to see how skills shortages naturally arise in a market-based economy. When such changes occur, it is imperative that public education, the workforce system, and economic development agencies are able to cope with the changes, and assist workers in the process of moving from areas of skill surplus into areas of skill shortage.

In the next blog post we will analyze these potential skill gaps from the supply perspective to see whether or the supply of talent has grown at the same rate as the demand for the workers identified here. We will also analyze the knowledge, skills, and abilities (KSAs) that are incumbent to the potential skill shortage occupations in order to see which KSAs could be undersupplied in the labor market.

Points, a consultant and project manager at EMSI, can be contacted at brian.points@economicmodeling.com. Read more about him here and EMSI Consulting here.

Illustration by Mark Beauchamp

  1. See page 5 of the Bureau of Labor Statistics’ Job Openings and Labor Turnover highlights from May 2001 for an up-to-date illustration of this relationship: http://www.bls.gov/web/jolts/jlt_labstatgraphs.pdf). It is also worth mentioning that some economists point to the special extension of unemployment benefits that occurred during the recession as a contributing factor to unexpectedly high unemployment. back
  2. This situation occurs when either a) supply drops due to workers’ unionization or the advent of new worker certification requirements that did not previously exist, and/or b) the skills for a certain job category become so specific and technical that only a select group of workers can perform them. back
  3. With this theory, it is assumed that each group of workers is “homogenous.” In other words, no one worker in any occupational category is more knowledgeable or skilled than any other. Of course, in the real labor market some workers are much more capable than others. In such cases, the higher skilled and lower skilled workers each belong to their own occupational groups, which have their own market equilibrium points with different wage and employment levels. back
  4. All wages are in real terms, adjusted for inflation to 2010 dollars. The cut-off point for significance is 0.5 standard deviations from the median. Please be aware: we are not treating this as a standard econometric model in which we are attempting to show a consistent relationship between earnings change and employment change. For this reason, we are not utilizing the same measures for statistical significance that are common to econometric models. back

The Shifting Geography of Black America

$
0
0

Black population changes in various cities have been one of the few pieces of the latest Census to receive significant media coverage.  The New York Times, for example, noted that many blacks have returned to the South nationally and particularly from New York City.  The overall narrative has been one of a “reverse Great Migration.”  But while many northern cities did see anemic growth or even losses in black population, and many southern cities saw their black population surge, the real story actually extends well beyond the notion of a monolithic return to the South.

The map below, showing total growth in Black Only population from 2000 to 2010, indeed shows that northern and west coast cities had low or even negative growth while various southern cities boomed.


Here is a list of the top ten metro areas (among those with more than a million total people) for black population growth:


And here are the bottom ten (among those with more than one million people):


Of course, looking at total population numbers can mislead. Some cities grew slowly or lost people as a whole while others boomed. With Houston, Dallas, and Atlanta all adding over a million people each, it's no surprise these regions added lots of blacks. Working and middle class African-Americans likely shared many of the same motivations to move to these cities – such as lower housing prices – as Americans of other ethnicities. In that light, a look at change in black population share (the percentage of the population that is black) provides additional perspective:


Here we see not a single-minded return to the South, but a complex mixture of shrinking and growing regions in various parts of the country.  This includes some surprising places, like Minneapolis-St. Paul, which was one of the top ten metros in the country for total black population growth, and also saw its black population share grow strongly.  Now the Twin Cities, along with Columbus, Ohio, another strong performer, are two of the top destination for African immigrants from Somalia and elsewhere, which doubtless accounts for part of that strong growth. But anecdotal reports indicate that they are also benefitting from Chicago's expanding black diaspora, along with places like Indianapolis and various Downstate metros.

Atlanta, well known as America's premier metro area for blacks, continued to dominate the charts. Not only far and away the leader in adding raw numbers of blacks, the African-American share also grew share strongly too. Charlotte is also clearly emerging as another key black population hub, ranking #6 in America for total black population growth, which is impressive for a smaller city, and adding nearly two percentage points in black population share.  It grew its black population much faster than other fast growing small cities like Raleigh or Nashville, and added share at more than three times as fast.

By contrast, Houston, which grew total black population significantly, had a much lower share gain. Austin, one of America's fastest growing metros, added only 28,000 blacks and actually lost black population share. And Washington, DC, despite being a traditional black population and cultural hub, also lost black population share regionally as gentrification in the District resulted in its loss of its black majority for the first time in decades, according to the Brookings Institution. 

So even among rapidly growing metro areas in the South, the appeal to black population is selective, favoring places like Atlanta, Charlotte, Florida cities, and even slower growing cities along the length of the Mississippi River like Memphis.  Even some cities in the North are retaining their allure to blacks as well. Less favored or even out of favor are metros like DC, Dallas, and Houston as well as cities such as Charleston and Savannah along the southeast coast.

Slow or negative black population growth is particularly concentrated in traditional tier one “global cities”, as well as those facing economic or other hardship like Detroit, Cleveland, and immediate post-Katrina New Orleans.

The latter may be understandable – whites have been leaving these regions as well – but the former is quite troubling.  The global city model, focused on high end and creative services, is supposedly the bright and shining savior of American urbanism. Indeed, it's hard to find a city that doesn't have some aspect of that as a core plank in its civic strategy. Yet the cities that have been most focused at promoting this notion – such as New York, San Francisco, and Chicago – are generally those  disproportionately driving blacks away. The reasons for this aren't clear, but the high and increasing cost of living in those places seems like one logical explanation.

Here's a more detailed look at the percentage growth in Black Only population in some tier one global type metros:


New York barely broke even on black population, while Chicago, LA, and the Bay Area all actually lost black residents, a stunning reversal from their past as black magnets. However, Boston, not a traditional black population hub, grew its black population strongly on a percentage basis, as did Miami and DC, though as noted before, the share change in DC was negative.  Here is that metric for the same metros:


With the notable exceptions of Boston and Miami – and Philadelphia, seldom ranked highly as a global city but still a traditional large northern metropolis – most global city regions appear to be increasingly inhospitable to Blacks.  Thus their model of success, whatever its appeal to some, at a basic level simply lacks inclusiveness. This shows its clear limits as an overall model for America’s urban centers as a whole.

Aaron M. Renn is an independent writer on urban affairs based in the Midwest. His writings appear at The Urbanophile. Data analysis, maps, and charts in this piece were prepared with Telestrian.

The Evolving Urban Form: Los Angeles

$
0
0

Los Angeles has grown more than any major metropolitan region in the high income world except for Tokyo since the beginning of the twentieth century, and also since 1950.  In 1900, the city (municipality, see Note) of Los Angeles had little over 100,000 people and ranked 36th in population in the nation behind Allegheny, Pennsylvania (which has since merged with Pittsburgh) and St. Joseph Missouri (which has since lost more than one quarter of its population).

As people moved West in the intervening decades and especially after World War II, the Los Angeles area exploded in population. By 1960, the Los Angeles metropolitan area, which was then and is now composed of Los Angeles and Orange counties, had passed Chicago to become second in population only to the New York metropolitan area. It was to take considerably longer for the city of Los Angeles to pass the city of Chicago as the nation’s second largest municipality, though this occurred by the 1990 census.

The Los Angeles combined statistical area (analogous to the former consolidated metropolitan statistical area) is made up of three metropolitan areas, Los Angeles, Riverside – San Bernardino and Oxnard (Ventura County). This combined area covers 35,000 square miles or more than 90,000 square kilometers. This is a land area nearly as large as that of Hungary and larger than Austria. The overwhelming share of the CSA is rural, with less than 10 percent of the land area developed.

Growth from 1900: The CSA had only 250,000 people in 1900, though grew to nearly 5,000,000 in 1950. By 2010, the population was nearing 18 million, a figure not much less than that of Australia, at 22 million (Table 1). Indeed until 1990 the Los Angeles CSA population was closing in on Australia. However, since that time population growth in the Los Angeles area has slowed considerably and Australia should remain larger.


Table 1
Los Angeles Combined Statistical Area: Population (CSA): 1900-2010
Year City of Los Angeles Balance: LA County  Los Angeles County   Orange County   Riverside County   San Bernardino County   Ventura County   Total 
1900        102,479                   67,819         170,298           19,696         17,897            27,929         14,367         250,187
1910        319,198                 184,933         504,131           34,436         34,696            56,706         18,347         648,316
1920        576,673                 359,782         936,455           61,375         50,297            73,401         28,724     1,150,252
1930    1,238,048                 970,444      2,208,492         118,674         81,024         133,900         54,976     2,597,066
1940    1,504,277              1,281,366      2,785,643         130,760       105,524         161,108         69,685     3,252,720
1950    1,970,358              2,181,329      4,151,687         216,224       170,046         281,642       114,647     4,934,246
1960    2,479,015              3,559,756      6,038,771         703,925       306,191         503,591       199,138     7,751,616
1970    2,816,061              4,216,014      7,032,075     1,420,386       459,074         684,072       376,430     9,972,037
1980    2,966,850              4,510,653      7,477,503     1,932,709       663,166         895,016       529,174   11,497,568
1990    3,485,398              5,377,766      8,863,164     2,410,556    1,170,413      1,418,380       669,016   14,531,529
2000    3,694,820              5,824,518      9,519,338     2,846,289    1,545,387      1,709,434       753,197   16,373,645
2010    3,792,621              6,025,984      9,818,605     3,010,232    2,189,641      2,035,210       823,318   17,877,006
Consolidated statistical area as defined by OMB as of 2010


The city of Los Angeles had grown 88 percent from 1950 to 2000, but over the past decade added only three percent to its population. Even more spectacular declines in growth occurred in the rest of the CSA. For example, Orange County had grown 1200 percent between 1950 and 2000 yet grew only six percent in the last decade.

Growth: 2000 to 2010: The population growth in the Los Angeles CSA was widely dispersed and away from the core. The central area (urban core) of the city Los Angeles extends from the Santa Monica Mountains to South Los Angeles and from the boundaries of Beverly Hills, West Hollywood and Culver City to East Los Angeles grew only 0.7 percent. Uniquely, the central area densified strongly between 1960 and 2000, while other urban cores nearly all declined in population, whether in the United States or Western Europe. Much of this was due to strong immigration from Mexico, other parts of Latin America, as well as Asia.

The inner suburban ring, which includes the balance of Los Angeles County south of the Santa Susana and San Gabriel Mountains as well as the older northwestern Orange County suburbs grew by 1.5 percent. Within this area, 32 inner suburbs (all in Los Angeles County) grew from 1.766 million to 1.767 million (0.1 percent) from 2000 to 2010 (Note 2).

The outer suburbs, which include the balance of Orange County (including the Mission Viejo urban area) and the western portions of Riverside and San Bernardino counties (including the Riverside – San Bernardino urban area) grew 19 percent.

The exurban areas, which include areas outside the core urban areas of Los Angeles, Riverside-San Bernardino and Mission Viejo grew 30 percent. The hot spots included Ventura County, the Santa Clarita Valley, the Antelope Valley, the Victorville-Hesperia area, the Coachella Valley (Indio-Palm Springs), the Hemet area and the Temecula-Murrieta area. An argument could be made that Temecula-Murrieta would be in the San Diego metropolitan area if metropolitan areas were defined by smaller area units, such as municipalities (as in Canada) or census tracts. The exurban areas are more attractive to residents at least in part because of considerably less expensive housing and their greater availability of detached houses than in the three core urban areas.

More remote areas of the desert extending to the Nevada and Arizona borders added 42 percent to their population (Table 2, Figure 1 and 2).


Table 2
Los Angeles CSA: Population by Sector: 2000-2010
Sector 2000 2010 Change % Change
Central Los Angeles          1,752,024              1,763,967         11,943 0.7%
Inner Ring          9,093,756              9,231,513       137,757 1.5%
Outer Suburbs          3,053,615              3,630,273       576,658 18.9%
Exurbs          2,173,459              2,822,884       649,425 29.9%
Remote             301,331                 428,369       127,038 42.2%
Total       16,374,185            17,877,006    1,502,821 9.2%


City of Los Angeles: The dispersion of population was also evident in the city of Los Angeles. For decades, the city of Los Angeles has grown strongly. Approximately one-quarter of this growth since 1960 has been the densifying central area, as noted above.

However, little noted is the fact that most of the city's growth was greenfield suburban in nature, built at low and moderate densities and largely car-oriented. For most of the past fifty years the growth has been “over the hill” in the San Fernando Valley, a formerly rural area which was annexed by the city before 1930. Between 1950 and 2010, the population of the San Fernando Valley grew from 300,000 to 1,400,000. Thus, the Valley grew like virtually every fast-growing historical core city in the nation that has grown since 1950, by filling up empty land (Figure 3).

Much has been written about the “Manhattanization” of the Los Angeles core. However, with only 13 towers more than 550 feet, downtown Los Angeles is no threat to Manhattan, with more than 125, or even Chicago with more than 70. Further, job growth is stagnant, with virtually no change in private sector employment over the last decade, despite substantial government subsidies.

Between 2000 and 2010, the central area grew at its slowest rate since the 1950s, growing by only 0.7 percent to its population, growing only 12,000 (to 1,764,000) or barely 12 percent of the city's growth. Nonetheless, and contrary to the reputation of Los Angeles, the central area is very densely populated, at approximately 14,000 people per square mile, with the highest density census tracts having more than 90,000 residents per square mile. Among the nation's largest municipalities, only New York and San Francisco are denser than central Los Angeles.

The big story in growth was on periphery. The San Fernando Valley captured 70 percent of the city's growth in the 2000s, with considerable greenfield expansion in the hills north of Chatsworth and Northridge. Even so, the Valley's growth was only five percent. The western portion of the city, which extends from the Santa Monica Mountains to Los Angeles International Airport, grew three percent and accounted for 13 percent of the city's growth. The Harbor area added two percent to its population and accounted for five percent of the city's growth (Figure 4).

The Future: Growth or Stagnation? After more than a century of spectacular growth, Los Angeles demographic juggernaut is stagnating and could conceivably go in reverse due to declining immigration, an exodus of middle class and working class families.  Indeed Even the strong growth in the outer suburbs and exurbs was not sufficient to drag the regional population increase (9 percent) up to the national rate of 10 percent between 2000 and 2010.

The immediate prognosis should be for even slower growth. The financial, regulatory and cost of living disadvantages of California are widely recognized by households and businesses alike. With stronger regulations in the offing, such as the stronger land use restrictions likely to occur as a result of Senate Bill 375, any future growth on the periphery could be dampened. Even with multi-billion support in terms of tax breaks and public investment, the central core seems unlikely to come close to making much of a real difference, at least beyond the media.  Los Angeles may not be on the road to Rust Belt stagnation, but the dynamism of the last century is no more.

------

Note 1: In this article, the term "city" means municipality.

Note 2: This includes municipalities and census designated places nearest the central area of the city of Los Angeles, from Glendale and Pasadena through Monterey Park to South Gate, Compton and Gardena and to the west of the central area.

Note 3: Biographical Note: The author was born in the Echo Park district, near downtown Los Angeles.

Photograph: Downtown Los Angeles from Echo Park (by author)

Wendell Cox is a Visiting Professor, Conservatoire National des Arts et Metiers, Paris and the author of “War on the Dream: How Anti-Sprawl Policy Threatens the Quality of Life

Queensland’s Future: Diverse and Dispersed

$
0
0

I was recently asked to outline my thoughts on how the Queensland urban landscape might look 40 to 50 years from now.  Go on, you can laugh.  I did too.  It’s hard enough to forecast the next 12 months, let alone two generations away, but I’ve given it a go, of sorts, so here it is:

First though, it might be best to outline my methodology.  In short, this forecast will be based on underlying trends, some understanding of human nature, and importantly, the Australian mindset.  My outlook is supported by evidence – what people actually do rather than say – and importantly, not by urban myths or fallacies, despite the frequency with which they have been aired of late.  Unfortunately, we don’t have the space or the time here to support every claim or go into massive detail; so this discussion is confined to broad shapes – not nitty gritty.

Queensland’s urban future (and that of Australia) can best be summed up in two words – Diverse and Dispersed.

Let’s deal with the second D – dispersion – first.  Our regional centres are likely to become a whole lot bigger and at the expense of the already crowded south-east corner of the state.  The move away from the world’s bigger cities is already underway, as evidenced in the recent census in the United States, but also throughout much of Europe.  Several Asian and Middle-eastern countries are now also following suite  As a Mckinsey Institute study recently found, smaller cities, particularly in the developing world, are growing considerably faster than the much discussed megacities.

The annual ABS small-area population data suggests this trend is also very true in Australia and particularly in Queensland, which, over the past decade, been the fastest growing state on the continent, appears to be following the same trend, something likely to be borne out by 2011 Census, due later this year .

Within our capital cities themselves, the much ballyhooed move downtown will slow – again, it already is doing so – as the cost to live within close proximity to the CBD is just too high compared to the real benefits. 

The irrational assertions about the trend towards denser living rest on urban myths that promote inner city density over other housing forms. These include the notion that suburban growth worsens carbon emissions and traffic congestion; people are being forced to live far from jobs concentrated in our CBDs and denser development will make it cheaper for them to get to work. These notions are all largely exaggerated or incorrect. More to the point, they stand in opposition to the basic preferences of the market.  

Instead of having a single high-density city core, with lower development density radiating outwards, the most likely urban shape in the future will be one of more even distribution of housing density throughout the city; concentrated more, no doubt, around middle-ring transport hubs and new master planned town-centres.  Our middle-ring and outer suburbs will have much more compact urban settings but will remain primarily dominated by relatively low density housing.

Diversity relates to the housing stock itself.  The current push towards smaller dwellings has little to do with demographics and the market’s wants, but reflects basic reaction to diminished housing affordability.   There is a demand for tightly-sized product, but it is nowhere as near as high, nor is the long-term trend towards such as strong, as the urban boosters advocate.

Taking a wider view, Australia (and America too) is still in its frontier or "barbaric" stage of its cultural evolution.  We walk with wide gaits, worship most things large from roadside bananas to women’s appendages, and don’t really like crowded spaces or queues Most of us like our space; aren’t really ready to give it up, and are not likely to do so for many decades to come.

Rather than remaining focused on density and concentration, it could well serve the community to focus on what appeals to the vast majority of the population, particularly the middle and working class families.  A more practical approach might be to foster the development of smaller, more efficient cities, as well as expansive suburbs and revived small towns rather than engage in a manic drive towards persistent centralization. 

Rather a forced density agenda on a largely unwilling population, it makes sense to consider how to make a more dispersed (and diverse) urban future more workable and sustainable. Innovations in work environments, notably increased use of telecommuting and dispersed workplaces, and more fuel efficient cars hold more promise than plans that force Aussies to live a way the vast majority do not prefer.

This article originally appeared in the June/July 2011 edition of the UDIA Queensland’s Urban Developer Magazine.

Michael Matusik is a qualified town planner and director of independent residential development advisory firm, Matusik Property Insights.

Photo by Michael Zimmer.

Commercial Real Estate: Shrinking to Fit

$
0
0

We are going to need less commercial real estate in the future, at least on a per-unit-of-population basis. Advances in communications technology are causing profound and sometimes unanticipated changes in our lives.

Retail Markets
The coming change is most obvious in retail markets. Americans are increasingly shopping online. However, we’ve really just started to scratch the surface. According to the U.S. Census Bureau’s 2009 E-Stats report issued in May, 2011, E-commerce only accounted for 3.99 percent of U.S. retail sales in 2009.

I was surprised at how small that number was. Certainly it is higher now, and the 2009 number was almost double 2004’s 2.13 percent, but there is huge room for increased internet retail sales. This is a growth business with a capital G.

Originally, I believed that traditional brick-and-mortar retailers would have the advantages of customer service and product knowledge, and internet purchasers would be product-savvy shoppers looking for products that they already knew about. That has turned out not be the case at all.

It is true that the initial internet retail sales successes have been in products where technical knowledge is not critical, and tastes are well established; products such as music, movies, and books. However, online retailers have made impressive gains in providing customer assistance to shoppers looking for more technical products.

Ratings of products and retailers were an initial step, along with detailed technical data. More recently, internet retailers have added chat windows, some with pictures of the salesperson. It won’t be long until voice or live video are offered, if it isn't already.

It is now the case that you are more likely to find more informed assistance on the internet than you will from a brick-and-mortar retailer. This is not to say you can’t find good assistance at a traditional retailer. But your online experience is likely to be better than what you will receive if you walk into a store and deal with the first person you bump into.

As internet sales increase, expect to see fewer traditional retailers and less demand for retail space. Already, shopping centers anchored by a music store, a video store, or a book store have felt the impacts. This is only the beginning.

Commercial rents will be softer and vacancies higher in large regional centers and in neighborhood strip malls. This will tend to drive retailers to ever larger centers with more traffic. Smaller centers will likely slowly deteriorate and die. In the end, we'll have fewer retail centers, but the average center will be larger than it is today.

Office Markets
While the number of workers telecommuting is still small, it is growing; someday, it will be very large. Initially, the growth in telecommuting was driven by workers’ desires to physically commute on fewer days. Today, the initiative is changing to employers.

Companies that adapted to telecommuting employees began to learn how to supervise these workers. Some companies have gone further. My son works for a company that has closed many physical offices, but kept most employees. Everyone was told to telecommute.

For companies that have made the strategic decision to reduce office space, the advantages must be large. Certainly rent goes down, but other expenses go down too. Heating and cooling costs go away. The company no longer needs to support a local network, with the local network’s support costs.

I haven’t seen research on telecommuters’ productivity, but it is easy to imagine it increases. Think “happy employees are productive employees.” It is also easy to imagine that productivity decreases. Think “unsupervised employees are unproductive employees.” Clearly, telecommuter productivity is the key to profitably running an office-free operation. As someone once said “any job performed on a computer can be performed anywhere.”

The lower demand will result in lower office space rental prices and higher vacancies. Again, this should lead to office-dependent operations migrating to the better addresses. In the end, the less-desirable buildings will be empty.

Industrial Markets
We’ve seen the huge increase in overseas manufacturing, and we’ve seen the steady decline of U.S. manufacturing jobs. That is just the first stage of a profound transformation in the way things are produced. As the song goes., “You ain’t seen nothing yet.”

Manufacturing’s future is nicely exemplified by three-dimensional printing. Today, you can Google “three dimensional printing” to find links to videos of three-dimensional printers producing amazingly complicated products, or find companies that have three-dimensional printers. Or you can use a three-dimensional printer to produce something.

I expect the growth of three-dimensional printers to be something like what we saw with copy machines. The first copy machine I used was in a drug store, and it was coin operated. Then, the banks made them available to customers. Today, we all have at least one in our home and one at the office.

The day will come when three-dimensional printers will be ubiquitous. You will download instructions for products from some company like Amazon. Then you will produce your good, without the need for an industrial building or a brick and mortar retailer. Producers of products that can’t be printed will print parts, reducing the demand for other producers, inventories, and shipping.

Any Growth Areas?
Buildings associated with providing healthcare may be the major exception to declining commercial real estate demand. The aging population, new technology, and long-term wealth trends are likely to continue to drive growth in the economy’s only sector that has grown consistently throughout the recession. At least so far, technological advances in medical care have increased demand for space instead of decreasing it.

Specialized R&D space may also buck the trend. Many of these facilities can be specialized, however, to the point of being profitably used by only one company. That implies that these buildings are risky investments.

Policy Implications
The decline in commercial real estate demand will pose serious challenges to governments. We’re already seeing states and local governments struggle with loss in retail taxes from internet sales . Declining revenues are just the beginning, though. Expenses will increase.

Empty buildings generate crime. In the case of retail centers, the crime will be very public. Nearby residential property values could decrease, with additional lost revenue to governments. Residents will not stand idly by. They will demand effective action — action that could be very expensive.

To minimize the fiscal damage, local governments will need to be nimble, a characteristic that few governments possess. They will need to be willing to change zoning codes to adapt to the decline in commercial real estate. They need to allow owners of existing space to redevelop or change their product mix. They may need special tax districts to deal with the blight created by vacant properties.

Growing population and an eventual real recovery will eventually fix the residential real estate problem. Commercial real estate’s challenges will not be so easily addressed. The impacts are not only on owners, developers, and contractors . All of us will be affected. The time to plan for those changes is now.

Bill Watkins is a professor at California Lutheran University and runs the Center for Economic Research and Forecasting, which can be found at clucerf.org

Photo by Mark Lyon -- Full Floor For Rent.

Britain Needs a Better Way to Get Rich Than Looting

$
0
0

Mark Duggan, father of four, was armed with a Bruni BBM semi-automatic pistol when he was shot dead by armed police on 4 August. Despite initial reports Duggan did not fire on the officers from the Trident Police Unit, an armed force dedicated to dealing with “gun related murders within London’s black communities”.

Duggan’s family were not told by police that he had died from his injuries but learned it from the news, in a report designed to deflect blame for the killing onto the victim. The vigil that Duggan’s friends and family held outside the Tottenham police station was a spark that set off rioting across Britain for the last week, and at the time of writing is still not under control.

Any political character to the initial rioting – as a protest against police brutality – quickly gave way to looting.

Looting broke out in urban centres, mostly those with a large black community – Tottenham, Enfield, Dalston and Croydon in London. The looters were for the most part young, and of all races, and they sought out popular clothing stores, like foot locker, jewellers and department stores. Some people were attacked in their homes. The “Gay’s the Word” bookshop in Marchmont Street was attacked on 8 August.

Later, looting spread to Leeds, Birmingham, Manchester and Nottingham – where a police station was firebombed.

One feature of the looting was the use of mobile phones, blackberries and Twitter accounts to rally looters to sites where, they rightly predicted, the police could be outmanoeuvred.

Still, it is worth pointing out that as rioting goes this recent outbreak, though widespread, has not been all that violent. Instead it has been more of a Feast of Fools, with the mob enjoying the humiliation of the authorities, as it raids the supermarkets for booze and clothes.

The Prime Minister, David Cameron has cut short his holiday in Tuscany to recall Parliament, and the London Mayor has come back too. The Drama Queen Cameron, sensing his big moment, promises tough measures to stop the rioting, issuing rubber bullets and water cannon to the police.  London courts processed 167 prisoners in unprecedented overnight sittings on 9-10 of August.

The cause of the riots has been identified by the Prime Minister and the London Mayor as a breakdown in authority – and they have a point. It is the British social system as a whole that has lost its way, with a collapse in authority in every level, from the police, the political system, school and parental authority but most severely in the system of work and reward.

Britain’s police force has most decidedly lost authority in recent times. The force used to have an authoritarian culture that was thuggish and racist under reactionary Chief Constables like Sir James Anderton in Manchester and Sir Kenneth Newman in London. But investigations into the police’s “institutional racism” have opened the way to a newer layer of technocratic leaders who were more interested in process than upholding a particular vision of public order.

Nobody would want to see the return of the old authoritarian policing, but the cadre that replaced them have lacked a guiding esprit de corps. The police have been seen as being corrupted by payments from News International’s investigators for personal information and designed to sideline an investigation into phone hacking.

Nor has the force’s new face stopped the problem of police brutality. Uncertain of how to deal with the public order challenges of middle class protest (environmental, or more recently student-based), the police have swung irrationally from a hands-off approach that only encouraged greater disorder to excessive force when that failed. The fear of Islamic terrorism has also led to police overreaction.

The killings of Jean Charles De Menezes (in a terrorism panic), Ian Tomlinson (at a G20 protest) and the vicious assault on Alfie Meadows at a student demonstration have all undermined respect for the police.

Political leaders have pointedly failed to engage with younger and less well-off groups in society, too. After more than a decade in power the Labour Party is a shell of its former self, but the coalition that replaced it is a bodged compromise whose most attractive radical figure, mould-breaking Liberal Democrat Nick Clegg, managed to turn himself overnight into the most hated man in Britain by joining the government and voting for an increase in student fees (the very thing he had campaigned against). All in all, the political class are stiff, besuited, and incapable of talking in ordinary English, preferring a weird gabble of municipal-speak.

Lower down the scale teachers, parents and youth leaders have seen their authority undermined by a culture that disparages discipline, and sees “abuse” everywhere. Teachers’ unions have pointed out that changes in the law mean that a substantial minority are being investigated for allegations of abuse made by students at any time, meaning that they are reluctant to uphold discipline in the classroom. At the same time, teachers and social workers challenge parental discipline at every opportunity.

Perhaps most disturbingly British society has broken the link between hard work and success. Once the “workshop of the world” Britain has a shrinking manufacturing base (around ten percent of all employment). As the analyst Andrew Smithers pointed out, the City of London’s specialisation in financial intermediation took up the slack left by her shrinking industrial sector, but now that is looking like having all your eggs in the wrong basket.

For a decade or more booming markets and a credit-fuelled economy covered up the weaknesses. Trainers, clothes and electronic devices shipped in from China and paid for on credit kept Britons happy, while a growth in government jobs and the educational maintenance allowance to keep 16-19 year olds in school kept unemployment down.

The British system of rewards is far from being straightforward. How do you get rich in Britain in 2011?

  • Sir Paul Stephenson, the disgraced chief of the Metropolitan Police retired this July with full pension and benefits on a final salary of £250,000 – having been exposed for taking favours from journalists under investigation for hacking phones.
  • Susan Boyle grabbed the public’s affection on a TV talent show and made £10 million.
  • Beresfords Law firm skimmed £30 million from the Miners Industrial Injury Compensation scheme.
  • Geordie singer turned X-factor judge Cheryl Cole became Britain’s highest paid TV star.
  • Independent consultants raided the National Health Service’s budget of £4.3 billion to build a national database which still does not work.
  • City chiefs like Barclays Bob Diamond and HSBC’s Bob Duggan were awarded bonuses of £6.5 and £9 million last year, from funds boosted by the government’s £200 billion quantitative easing policy.

The link between work and reward is not easy to fathom. Young people dream unrealistically of success in the world of entertainment, as the most compelling example to them. The more astute know that law and the other professions have done better at securing their incomes – and for them higher education is the route.

Now the British system of rewards is threatened by the pressure on credit and on government spending. Nervous teenagers and parents see a much higher cost for higher education threatened (though the small print, surprisingly, is more generous than the headline fees). The consumer goods sector has been the one point of connection between younger people and wider society that worked – but recent financial difficulties make many fear that it will soon be out of reach.

Britain’s radical leaders have in recent times failed to speak to the material aspirations of the greater mass of people. Trade union wage claims are not the fighting point they once were. Left wingers are more likely to be hostile to consumerism than supportive. On the other side, conservatives have abandoned their narrative of hard work to earn well, thinking it too judgmental and mean-spirited.

Anxiety about the route to material betterment, along with a failure of political answers to that problem and a falling respect for authority have led to disorder. Earlier this year the middle classes rioted on student protests over rising fees. Now some amongst the inner city poor are rioting and looting, in search of a less deferred gratification.

The looters have taken advantage of the crisis of public authority to make their own short-cut to material success, but it is a self-defeating one. A looted Debenhams or Footlocker will think twice about re-stocking – or at least until they have improved security. Worse still, many family firms and communities have been wrecked by rioters.

Mark Duggan’s family needs a good answer to why he was shot, and why they had to learn that he had died through the media. Britain needs a less crazed answer to the question of how to meet people’s wants, and it needs a stronger restatement of the value of social solidarity.

James Heartfield’s latest book The Aborigines' Protection Society: Humanitarian Imperialism in Australia, New Zealand, Fiji, Canada, South Africa, and the Congo, 1836-1909 is published by Columbia University Press, and Hurst Books in the UK.

Photo "Tottenham riots" by Nico Hogg

Biggest Boomer Towns

$
0
0

The boomer generation, spawned (literally) in the aftermath of the Second World War, will continue to shape the American landscape well into the 21st Century. They may be getting older, but these folks are still maintaining their power. Those born in the first ten years of the boomer generation  — between 1945 and 1955 — number 36 million, and they will continue to influence communities and real estate markets across the country, especially as they contemplate life after kids and retirement.

Much has been written about where “empty nesters” might move as their children move off on their own. One longstanding favorite is the notion that, having jettisoned their children, the boomers will also desert their suburban communities for the bright city lights.

Unfortunately for developers — some of whom have invested heavily in high-end housing for urbanizing “empty nesters” — the actual data do not support this thesis. Indeed, our analysis of migration by this cohort in the past 10 years shows a 10.3% decline among core city dwellers, a loss of some 1.3 million people over the past decade. For this analysis, Forbes, with the help of demographer Wendell Cox, looked at population numbers from the Census for boomers aged 45 to 54 in 2000 and compared them with the numbers for those ages 55 to 64 in 2010.

These population changes include reductions due principally to deaths. Census data do not include mortality information. This cohort lost 3.2% of its population over the 10 years. This would only marginally reduce the changes between 2000 and 2010, while the scale of differences between the metropolitan areas would be identical.

So where are these surviving boomers settling as they enter their likely extended golden years?  The results may surprise urban boosters who have confidently expected them to flock downtown.

To be sure, a few of the highly affluent — the ones mentioned in the mainstream media — may purchase homes, or pied-à-terres, in places like Manhattan, Chicago’s Gold Coast or San Francisco. But these areas actually have suffered an exodus of boomers over the past decade. In our ranking of the 51 largest metros in the U.S., the urban cores of San Jose, San Francisco, Los Angeles and Chicago scored near the bottom, suffering double-digit percentage losses of boomers. According to the last Census, New York’s urban core, which the Daily News suggested is packed with aspiring seniors, lost 12% of boomers in their mid-50s to mid-60s  — or about 274,000 people.

Over the past three years  you could blame this loss on the economy, which has postponed retirements brought home many of the boomers’ young, largely unemployed or underemployed children back to the suburban homestead. Or you can credit it to more active lifestyles among boomers who appear to working later than ever. According to a Careerbuilder.com survey, over 60% of workers over 60 indicated they are postponing retirement.

Yet perhaps something more profound is at work here. An analysis of those who were 55 to 65 in 2000 and 65 to 75 in 2010 reveals an even stronger anti-urban bias, with an over 12% drop in city dwellers. Since these folks are far less likely to have kids at home and more properly retired, this cohort’s behavior suggests that aging boomers are if anything less likely to move to the cities in the next decade.

Indeed, if boomers do move, notes Sandi Rosenbloom, a noted expert on retirement trends and professor of Planning and Civil Engineering at the University of Arizona, they tend to move to less dense and more affordable regions. The top cities for aging boomers largely parallel those that appealed to the “young and restless” in our earlier survey. The top ten on our list are all affordable, generally low-density Sun Belt metros:

  1. Las Vegas, Nev.
  2. Phoenix, Ariz.
  3. Tampa-St. Petersburg, Fla.
  4. Orlando, Fla.
  5. Riverside-San Bernardino, Calif.
  6. Raleigh, N.C.
  7. Austin, Texas
  8. San Antonio, Texas
  9. Jacksonville, Fla.
  10. Charlotte, N.C.-S.C.

But according Sandi Rosenbloom, a noted expert on retirement trends and a professor of planning and civil engineering at the University of Arizona, most boomers are staying put, largely in the suburbs they settled in decades ago.  The propensity to move, she points out, starts to drop precipitously as people leave their early 30s. Roughly 1 in 3 people in their 20s move in a given year; by the time they enter their 40s, that figure slides to about 1 in 10. As people age into their 50s and beyond, the percentage drops to roughly 5%, or 1 in 20.

“The boomers are staying put more than anyone thought,” Rosenbloom says. “People of that generation tend to own their own homes and stay there. The idea that they are moving to the city really comes from the wishful thinking school of planning.”

The recession has exacerbated this stay-at-home trend. The number of people moving is at its lowest level since the early 1960s. When boomers do decide to move, Rosenbloom notes, they do so largely for prosaic reasons, such as being closer to children or, more important, grandchildren.

Others succumb to the temptation to cash out expensive housing in metros like New York, Los Angeles, the Bay Area or Boston for less costly residences in Sun Belt locales. Housing in and around these core cities, particularly in attractive neighborhoods, Rosenbloom adds, are simply too expensive for the vast majority of budget-conscious seniors.

Much of this also has to do with the lifestyle preferences of both boomers and seniors, which appear far different than those put forth by urban pundits. People over 55 that Rosenbloom has interviewed usually express a preference to stay or relocate in places that are less crowded and congested. Furthermore, most are reluctant to give up their cars, and many are less able to walk than drive. This may explain why most retirement communities end up on the urban fringe or farther.

This trend — which Rosenbloom has also encountered in the U.K., Australia, Canada and New Zealand — is also reflected by the growing shift to smaller towns and cities among both aging boomers and seniors. The “young and restless” may head to suburbs, particularly in the lower-cost Sun Belt cities, but some older Americans appear headed to even less densely populated regions. Over the past decade over 1 million aging boomers and seniors moved to more smaller cities and rural locations from suburban or urban locations.

What do these trends suggest for the future of our communities and real estate? For one, the big opportunities for selling to aging boomers will remain primarily in the suburbs and some select more rural locations. We also can expect the new senior citizens to move to more affordable places close to their children.

These findings do provide some long-term hope for the housing market, particularly in suburbs. Leading demographers have been busy predicting a massive drop-off in single-family homes as boomers retire and their children leave. Yet our analysis on the Census reveals that most boomers — as well as those older than them — are staying in the suburbs a lot longer than expected. Many will likely to stay in their homes and old neighborhoods well into their 70s or even 80s, leaving either their home either in an ambulance or to an assisted living facility.

Developers and planners anxious to service aging boomers should, instead of building downtown towers, address the needs of this generation precisely where they now live and are likely to stay. This could include adding to new residential options in the suburbs to enlivening local shopping districts while boosting senior services in everything from recreation and public safety to health care. As the rock and roll generation heads toward its dotage, both business and communities need to adjust their strategies based not on fantasies but on the realities so clearly evidenced by the Census.

This piece originally appeared at Forbes.com.

Joel Kotkin is executive editor of NewGeography.com and is a distinguished presidential fellow in urban futures at Chapman University, and an adjunct fellow of the Legatum Institute in London. He is author of The City: A Global History. His newest book is The Next Hundred Million: America in 2050, released in February, 2010.


Who Lost the Middle Class?

$
0
0

Forty years from now, politicians, writers, and historians may struggle to understand how America, once the quintessential middle-class society, became as socially stratified as Europe or even Brazil. Should that dark scenario come to pass, they would do well to turn their attention first to New York City and New York State, which have been in the vanguard of middle-class decline.

It was in mid-1960s New York—under the leadership of a Barack Obama precursor, Hollywood-handsome John Lindsay—that the country’s first top-bottom political coalition emerged. In 1965, Gotham had more manufacturing jobs than any other city in the country.programs failed. New York City responded by inflating its unionized public-sector workforce to incorporate minority workers.

Higher taxes to pay for bigger government joined higher crime to produce a massive exodus of manufacturing and middle-class jobs. Over the last 45 years, New York has led the country in outmigration. A recent study by E. J. McMahon and Robert Scardamalia of the Empire Center for New York State Policy notes that since 1960, New York has lost 7.3 million residents to the rest of the country. For the last 20 years, “New York’s net population loss due to domestic migration has been the highest of any state as a percentage of population.”

New York City, meanwhile, solidified its standing as the most unequal city in America. Twenty-five percent of New York was middle-class in 1970, according to a Brookings Institution study. By 2008, that figure had dropped to 16 percent, and the numbers have only plunged further since the financial crisis, with virtually all the new jobs in the city’s hourglass economy coming at either the high end or the low. Only high-end businesses can succeed in a local economy that has the nation’s highest taxes and highest cost of living—and even those businesses, in many cases, weathered the downturn only by living off the Fed’s policy of subsidizing banks. Despite the federal largesse, more of the city’s new jobs are in the low-wage hospitality and food-services industries than in the financial sector. The middle has lost its political voice in a city dominated by the politically wired wealthy and the public-sector unions that service the poor.

New York is the picture of what the Tea Party fears for the country at large. In the 1970s, liberal mandarins seized the high ground of American institutions in the name of managing social, racial, gender, and environmental justice on behalf of the disadvantaged. Their job, as they saw it, was to protect minorities from the depredations of middle-class mores. In the wake of the Aquarian age, the U.S. developed the first mass upper-middle class in the history of the world. These well-to-do, often politically connected professionals—including the increasingly intertwined wealthy of Wall Street, Hollywood, and Silicon Valley—espoused what might be called gentry liberalism, a creed according to which the middle classes had to be punished for their racism, sexism, and excess consumption.

And they have been punished—with job losses. These losses are the inevitable result of the costs of an ever-expanding, European-style public sector; environmental restrictions on manufacturing, mining, and forestry, which push high-paying jobs offshore; and illegal immigration, which reduces overall wage levels. At the same time, the decline in the quality of K–12 schools has undermined what was once a ladder of economic ascent. After completing high school today, students are likely to require a raft of remedial courses in college. Then, after college, many middle-class students graduate not with an education but with a credential—and a bag of enormous college loans that paid for the intermittent attention of a highly paid, tenured faculty.

The private-sector middle class’s plight has been exacerbated by international competition and technological innovation, which have undermined job security, including for unionized manufacturing workers, who had enjoyed an unprecedented prosperity for about a quarter-century. Median household incomes have grown only marginally since the early 1970s, despite the mass movement of women into the workplace. Many dual-earner families have been caught in the two-income tax trap: on the one hand, they pay for services once performed by the homemaker; on the other, notes economist Todd Zywicki, they’re pushed into a higher tax bracket when the wife’s salary is added to the husband’s.

Adding to the woes of the middle and lower classes is that their families are far less stable than they were a generation ago. The decline of marriage has been driven not only by changing mores but also by a decline in male employment. In 1970, only one of 14 working-age men was out of the workforce. Today, notes Nina Easton, one in five is either “collecting unemployment, in prison, on disability, operating in the underground economy, or getting by on the paychecks of wives or girlfriends or parents.” Whites who don’t attend college have out-of-wedlock birthrates approaching those that triggered Daniel Patrick Moynihan’s concerns about the black family in 1965. Today, four in ten American babies are born out of wedlock.

During the current downturn, the black and Hispanic middle class has been particularly hard hit. From 2005 to 2009, according to a recent Pew survey, inflation-adjusted wealth fell by 66 percent among Hispanic households and by 53 percent among black households, compared with 16 percent among white households. These families worry with good reason that in the face of continuing high unemployment, they may fall out of the middle class. For the Obama administration and the public-sector unions, the solution to this slide is to force the nearly one in four employers that have contracts with the federal government to pay above-market wages. Here again, New York has been a pacesetter. Recently, public-sector unions and their allies tried to force a developer rebuilding a decayed Bronx armory to follow their wage and hiring guidelines; the deal collapsed, leaving one of the poorest sections of Gotham in the lurch.

There’s a major difference, though, between New York and the country as a whole. The New York option—move somewhere else—doesn’t apply to private-sector middle-class workers fighting adverse conditions that exist throughout America. So they’ve exercised the classic democratic right of political action, organizing themselves to compete in elections. The Tea Party is the national voice of the private-sector middle class—despite the demonizations heaped upon it by public-policy elites whose own judgment and competence leave much to be desired.

Middle-class decline should be front and center in 2012, which is shaping up as a firestorm of an election. It’s likely to be a bitter contest, in which the polarized class interests of those who identify with the growth of government and those who are being undermined by its expansion face off without the buffer of mutual goodwill. Liberals, unless they change their tune, will blame Tea Party “terrorists” for the tragedy of a fading middle class. They will continue to delude themselves into thinking, as Al Gore said in 2000, that their rivals represent “the powerful” and that they themselves act on behalf of “the people,” even though President Obama’s policies have poured money into Wall Street and the politically connected “green” businesses that form the upper half of his top-bottom electoral coalition. The question is whether the country will buy this line and, more broadly, whether it will follow the New York model. Should it do so, those future historians will no doubt look at the election of 2012 as the contest in which the middle class staggered past the point of no return.

This piece originally appeared in The City Journal.

Fred Siegel is a contributing editor of City Journal, a senior fellow at the Manhattan Institute, and a scholar in residence at St. Francis College in Brooklyn.

Photo by SEIU International.

The U.K. Riots And The Coming Global Class War

$
0
0

The riots that hit London and other English cities last week have the potential to spread beyond the British Isles. Class rage isn’t unique to England; in fact, it represents part of a growing global class chasm that threatens to undermine capitalism itself.

The hardening of class divisions    has been building for a generation, first in the West but increasingly in fast-developing countries such as China. The growing chasm between the classes has its roots in globalization, which has taken jobs from blue-collar and now even white-collar employees; technology, which has allowed the fleetest and richest companies and individuals to shift operations at rapid speed to any locale; and the secularization of society, which has undermined the traditional values about work and family that have underpinned grassroots capitalism from its very origins.

All these factors can be seen in the British riots. Race and police relations played a role, but the rioters included far more than minorities or gangsters. As British historian James Heartfield has suggested, the rioters reflected a broader breakdown in “the British social system,” particularly in “the system of work and reward.”

In the earlier decades of the 20th century working class youths could look forward to jobs in Britain’s vibrant industrial economy and, later, in the growing public sector largely financed by both the earnings of the City of London and credit. Today the industrial sector has shrunk beyond recognition. The global financial crisis has undermined credit and the government’s ability to pay for the welfare state.

With meaningful and worthwhile work harder to come by — particularly in the private sector — the prospects for success among Britain working classes have been reduced to largely fantastical careers in entertainment, sport or all too often crime. Meanwhile, Prime Minister David Cameron’s supporters in the City of London may have benefited from financial bailouts arranged by the Bank of England, but opportunities for even modest social uplift for most other people have faded.

The great British notion of idea of working hard and succeeding through sheer pluck — an idea also embedded in the U.K.’s former colonies, such as the U.S. — has been largely devalued.  Dick Hobbs, a scholar at the London School of Economics, says this demoralization  has particularly affected white Londoners. Many immigrants have thrived doing engineering and construction work as well as in trades providing service to the capital’s affluent elites.

A native of east London himself, Hobbs  maintains that the industrial ethos, despite its failings, had great advantages. It centered first on production and rewarded both the accumulation of skills. In contrast, by some estimates, the pub and club industry has been post-industrial London’s largest source of private-sector employment growth, a phenomena even more marked in less prosperous regions. “There are parts of London where the pubs are the only economy,” he notes.

Hobbs claims that the current “pub and club,” with its “violent potential and instrumental physicality,” simply celebrates consumption often to the point of excess. Perhaps it’s no surprise that looting drove the unrest.

What’s the lesson to be drawn?  The ideologues don’t seem to have the answers. A crackdown on criminals — the favored response of the British right — is necessary but does not address the fundamental problems of joblessness and devalued work. Similarly the left’s favorite panacea, a revival of the welfare state, fails to address the central problem of shrinking opportunities for social advancement.  There are now at least 1 million unemployed young people in the U.K., more than at any time in a generation, while child poverty in inner London, even during the regime of former Mayor “red Ken” Livingstone last decade, stood at 50% and may well be worse now.

This fundamental class issue is not only present in Britain. There have been numerous outbreaks of street violence across Europe, including in France and Greece. One can expect more in countries like Italy, Spain and Portugal, which will now have to impose the same sort of austerity measures applied by the Cameron government in London.

And how about the United States? Many of the same forces are at play here. Teen unemployment currently exceeds 20%; in the nation’s capital it stands at over 50%. Particularly vulnerable are expensive cities such as Los Angeles and New York, which have become increasingly bifurcated between rich and poor. Cutbacks in social programs, however necessary, could make things worse, both for the middle class minorities who run such efforts as well as their poor charges.

A possible harbinger of this dislocation, observes author Walter Russell Mead, may be the recent rise of  random criminality, often racially tinged, taking place in American cities such as Chicago, Milwaukee and Philadelphia.

Still, with over 14 million unemployed nationwide, prospects are not necessarily great for white working- and middle-class Americans. This pain is broadly felt, particularly by younger workers. According to a Pew Research survey,  almost 2 in 5 Americans aged 18 to 19 are unemployed or out the workforce, the highest percentage in three decades.

Diminished prospects — what many pundits praise as the “new normal” — now confront a vast proportion of the population. One indication: The expectation of earning more money next year has fallen to the lowest level in 25 years. Wages have been falling not only for non-college graduates but  for those with four-year degree as well.   Over 43% of non-college-educated whites complain they are downwardly mobile.

Given this, it’s hard to see how class resentment in this country can do anything but grow in the years. Federal Reserve Chairman Ben Bernanke claimed as early as 2007 that he was worried about growing inequality in this country, but his Wall Street and corporate-friendly policies have failed to improve the grassroots economy.

The prospects for a widening class conflict are clear even in China, where social inequality is now among the world’s worse . Not surprisingly, one survey conducted  the Zhejiang Academy of Social Sciences   found that 96% of respondents “resent the rich.”  While Tea Partiers and leftists in the U.S. decry the colluding capitalism of the Bush-Obama-Bernanke regime, Chinese working and middle classes confront a hegemonic ruling class consisting of public officials and wealthy capitalists. That this takes place under the aegis of a supposedly “Marxist-Leninist regime” is both ironic and obscene.

This expanding class war creates more intense political conflicts. On the right the Tea Party — as well as rising grassroots European protest parties in such unlikely locales as Finland, Sweden and the Netherlands — grows in large part out of the conviction that the power structure, corporate and government, work together to screw the broad middle class. Left-wing militancy also has a class twist, with progressives increasingly alienated by the gentry politics of the Obama Administration.

Many conservatives here, as well as abroad, reject the huge role of class.  To them, wealth and poverty still reflect levels of virtue — and societal barriers to upward mobility, just a mild inhibitor. But modern society cannot run according to the individualist credo of Ayn Rand; economic systems, to be credible and socially sustainable, must deliver results to the vast majority of citizens. If capitalism cannot do that expect more outbreaks of violence and greater levels of political alienation — not only in Britain but across most of the world’s leading countries, including the U.S.

This piece originally appeared at Forbes.com.

Joel Kotkin is executive editor of NewGeography.com and is a distinguished presidential fellow in urban futures at Chapman University, and an adjunct fellow of the Legatum Institute in London. He is author of The City: A Global History. His newest book is The Next Hundred Million: America in 2050, released in February, 2010.

Photo by Beacon Radio.

California’s Jobs Engine Broke Down Well Before the Financial Crisis

$
0
0

Everybody knows that California’s economy has struggled mightily since the 2008 financial crisis and subsequent recession. The state’s current unemployment rate, 12.1 percent, is a full 3 percentage points above the national rate. Liberal pundits and politicians tend to blame this dismal performance entirely on the Great Recession; as Jerry Brown put it while campaigning (successfully) for governor last year, “I’ve seen recessions. They come, they go. California always comes back.”

But a study commissioned by City Journal using the National Establishment Time Series database, which has tracked job creation and migration from 1992 through 2008 (so far) in a way that government statistics can’t, reveals the disturbing truth. California’s economy during the second half of that period—2000 through 2008—was far less vibrant and diverse than it had been during the first. Well before the crisis struck, then, the Golden State was setting itself up for a big fall.

One of the starkest signs of California’s malaise during the first decade of the twenty-first century was its changing job dynamics. Even before the downturn, California had stopped attracting new business investment, whether from within the state or from without.

Economists usually see business start-ups as the most important long-term source of job growth, and California has long had a reputation for nurturing new companies—most famously, in Silicon Valley. As Chart 1 shows, however, this dynamism utterly vanished in the 2000s. From 1992 to 2000, California saw a net gain of 776,500 jobs from start-ups and closures; that is, the state added that many more jobs from start-ups than it lost to closures. But during the first eight years of the new millennium, California had a net loss of 262,200 jobs from start-ups and closures. The difference between the two periods is an astounding 1 million net jobs.

Between 2000 and 2008, California also suffered net job losses of 79,600 to the migration of businesses among states—worse than the net 73,800 jobs that it lost from 1992 through 2000. The leading destination was Texas, with Oregon and North Carolina running second and third (see Chart 2). California managed to add jobs only through the expansion of existing businesses, and even that was at a considerably lower rate than before.

Graph by Alberto Mena

Graph by Alberto Mena

Another dark sign, largely unnoticed at the time: California’s major cities became invalids in the 2000s. Los Angeles and the San Francisco Bay Area had been the engines of California’s economic growth for at least a century. Since World War II, the L.A. metropolitan area, which includes Orange County, has added more people than all but two states (apart from California): Florida and Texas. The Bay Area, which includes the San Francisco and the San Jose metro areas, has been the core of American job growth in information technology and financial services, with San Jose’s Silicon Valley serving as the world’s incubator of information-age technology. During the 1992–2000 period, the L.A. and San Francisco Bay areas added more than 1.1 million new jobs—about half the entire state total. But between 2000 and 2008, as Chart 3 indicates, California’s two big metro areas produced fewer than 70,000 new jobs—a nearly 95 percent drop and a mere 6 percent of job creation in the state. This was a collapse of historic proportions.

Graph by Alberto Mena

Not only did California in the 2000s suffer anemic job growth; the new jobs paid substantially less than before. Chart 4 reveals the sad reversal. From 2000 to 2008, California had a net job loss of more than 270,000 in industries with an average wage higher than the private-sector state average. That marked a turnaround of nearly 1.2 million net jobs from the 1992–2000 period, when 908,900 net jobs were created in above-average-wage industries. Further, during the earlier period, more than 707,000 net jobs were created in the very highest-wage industries—those paying over 150 percent of the private-sector average.

Chart 5, which indicates job growth or decline in selected industries, again suggests that a lopsided amount of California’s economic growth in the 2000s was in below-average-wage fields. It included nearly 590,000 net jobs in “administration and support”—clerical and janitorial jobs, for example, as well as positions in temporary-help services, travel agencies, telemarketing and telephone call centers, and so on. The largest losses in the state during the 2000s were in manufacturing, which traditionally provided above-average wages. After adding a net 64,900 manufacturing jobs from 1992 to 2000, California hemorrhaged a net 403,800 from 2000 to 2008. But information jobs also went into negative territory, while professional, scientific, and technical-services employment experienced far lower growth than in the previous decade.

The chart also shows that California’s growth in the 2000s, such as it was, took place disproportionately in sectors that rode the housing bubble. In fact, 35 percent of the net new jobs in the state were created in construction and real estate. All those jobs have vaporized since 2008, according to Bureau of Labor Statistics data. They are unlikely to come back any time soon.

These are troubling numbers. Fewer jobs and lower wages do not a robust economy make. A continuation of this trend, even if California’s recession-battered condition improves, would result in a far more unequal economy, shrunken tax revenues, and a likely increase in state public assistance—all at a time when officials are struggling with massive deficits.

Graph by Alberto Mena

Graph by Alberto Mena

A final indicator of California’s growing economic weakness during the 2000–2008 period is that the average size of firms headquartered in the state shrank dramatically. As Chart 6 shows, California had a huge increase over the 1992–2000 period in the number of jobs added by companies employing just a single person or between two and nine people, even as larger firms cut hundreds of thousands of jobs. Many of the single-employee companies may simply be struggling consultancies: if they were doing better, they’d likely have to start hiring at least a few people. While start-ups are indeed crucial to economic growth, small companies are especially vulnerable to economic downturns and often feel the brunt of taxes and regulations more acutely than larger firms do. The awful job numbers for the bigger companies—including a net loss of nearly 450,000 positions for firms with 500 or more employees—suggest the toxicity of California’s business climate. After all, bigger firms have the resources to settle and expand in other locales; in the 2000s, they clearly wanted nothing to do with the Golden State.

Graph by Alberto Mena

What is behind California’s shocking decline—its snuffed-out start-ups, unproductive big cities, poorer jobs, and tinier, weaker, or fleeing companies—during the 2000–2008 period? Steven Malanga’s “Cali to Business: Get Out!” identifies the major villains: suffocating regulations, inflated business taxes and fees, a lawsuit-friendly legal environment, and a political class uninterested in business concerns, if not downright hostile to them. One could add to this list the state’s extraordinarily high cost of living, with housing prices particularly onerous, having skyrocketed in the major metropolitan areas before the downturn—thanks, the research suggests, to overzealous land-use regulation.

One thing is for sure: California will never regain its previous prosperity if it leaves these problems unaddressed. Its profound economic woes aren’t just the result of the Great Recession.

This piece originally appeared in City Journal. City Journal thanks the Hertog/Simon Fund for Policy Analysis for its generous support of this issue’s California jobs package.

Wendell Cox is a Visiting Professor, Conservatoire National des Arts et Metiers, Paris and the author of “War on the Dream: How Anti-Sprawl Policy Threatens the Quality of Life

Photo by Altus via Flickr

The Secret of Where Good Energy Comes From

$
0
0

In the wake of Solyndra's failure, pundits have latched on to a simple, compelling narrative: government can't do energy right.

From synfuels to solar panels to "clean coal" (written, inevitably, with knowing quotation marks), demonstration projects funded by the Department of Energy are described as one failed white elephant after another. Today the DOE is the agency everyone loves to hate (and, at least in Texas Gov. Rick Perry's case, the agency to forget).

What gets left out (and forgotten) is that virtually every one of today's major energy technologies exists thanks to sustained US government investments in research, development, and demonstration. Consider:

To be sure, not every DOE investment has succeeded. But even the projects frequently named as failures were often secret successes.

Take synfuels. After the oil shocks of the 1970s, the US government created the synthetic fuels program. The program worked to produce fuel competitive with oil at $60 a barrel -- the program's objective. But when the price of oil dropped to $10 a barrel in the early 1980s, Congress sensibly abandoned the program. The total amount spent by Congress on SynFuels ended up being just $2 billion -- cheap insurance against future oil embargoes and price shocks, which had sent the United States into a costly recession.

Most people are surprised to learn that the SynFuels program was a success in another way: it led to the development of the technologies today used for coal gasification and carbon capture and storage, which captures coal plant emissions.

Clean coal is ridiculed by greens and libertarians alike as pie-in-the-sky. In fact, carbon capture and storage has been demonstrated around the world. One descendent of SynFuels, Dakota Gasification, is to this day still producing gas and sequestering several million tons of CO2 each year at Weyburn in Canada.

Or consider the case of an abandoned next generation nuclear plant on the Clinch River. The Washington Post singled it out to make a sweeping case against all public investments in advanced energy. What the Post didn't mention is that, since 1949, the U.S. government has successfully demonstrated and tested more than 50 experimental reactor designs at the National Reactor Testing Station (now Idaho National Labs). One of them -- the EBR-II -- ran for 30 years at the testing station and was the technological predecessor to the integral fast reactor (IFR), which is increasingly viewed by experts as promising since it is so efficient, burning conventional nuclear reactor waste as fuel.

Sometimes pundits point to natural gas drawn from shale as an example of how the private sector does the job better. They claim fracking and horizontal drilling were developed by a solitary entrepreneur named George Mitchell in the 1980s. In fact, the key breakthroughs in the development of shale gas technologies occurred thanks to intensive DOE demonstration efforts pursued by President Jimmy Carter, the frequent butt of energy-related jokes, in response to the 1970s oil embargoes.

Look at what industry and independent experts say. "The Department of Energy was there with research funding when no one else was interested," said the head of Julander Energy, a member of the National Petroleum Council, "and today we are all reaping the benefits." A Senior Director at Halliburton said, "In the early 1980s, the industry as a whole did not have a clear vision for producing gas from shales, and benefited from DOE involvement and funding of [electro-magnetic telemetry] EMT technology... there is a clear line of sight between the initial research project and the commercial EMT service available today." Dr. Terry Engelder of Penn State calls the DOE's Eastern Gas Shales Research Program "one of the great examples of value-added work led by the DOE."

In the case of the "shale gas revolution," as in so many examples of breakthrough American innovations, it is this key interplay between public sector research, demonstration, and testing and private sector ingenuity and entrepreneurship that drives major advances in technology.

To be sure, US investments in energy must be reformed. We should stop bluntly subsidizing the deployment of more of the same energy technologies -- whether current-generation wind, solar, biofuels, or nuclear -- and retool energy incentives to demand steady and continual innovation and cost improvements. Firms that out-innovate their competitors with next-generation clean energy improvements should be rewarded, and clean tech industries should put themselves on a clear path to subsidy independence over time. The big story about energy innovation remains unwritten. For most insta-experts on energy, it's easier to just recycle the old one.

Shellenberger and Nordhaus are co-founders of the Breakthrough Institute, a leading environmental think tank in the United States. They are authors of Break Through: From the Death of Environmentalism to the Politics of Possibility.

Image from BigStockPhoto.com

Do Standardized Tests Raise Dropout Rates?

$
0
0

The No Child Left Behind Act became law in 2002. Among other things, it required standardized testing of students, beginning in 2003. The scores are used to evaluate the quality of the schools.

It sounds reasonable. Congress certainly thought so. It was co-authored in the Senate by Edward Kennedy (D-MA) and Judd Gregg (R-NH), while John Boehner (R-OH) and George Miller (D-CA) introduced it into the House. It passed both houses by huge bi-partisan majorities, 91-8 in the Senate and 384-45 in the House.

The Act’s passage also marked the low point in California's High School dropout rate.

In 2002, California’s High School dropout rate had been declining for several years. After the act’s passage, the dropout rate trend experienced an unprecedented reversal. What had been a declining trend became an increasing trend, one that continues today. After bottoming out at less than 11 percent in 2002, California’s High School dropout rate is now approaching 22 percent.

The costs of dropouts are enormous, both for the students who leave school and for society. A person without a High School education is economically crippled. For all but the very exceptional few, dropping out of High School is a sentence to a lifetime of poverty and drudgery. For many dropouts, a lifetime of poverty and drudgery is the best possible outcome. Far too many will be involved in drug abuse, dysfunctional or violent relationships, teenage pregnancies, and crime.

The costs to society are large. They include losses to crime, and the direct costs of subsidies, social programs, healthcare, prisons, and law enforcement. Those costs may be exceeded by the dropout’s output deficiency, that is, the difference between what the dropout would have produced with a decent education and what he or she actually produces.

One way to improve standardized test scores is to increase the retention of tested topics by the students. An easier way is to prohibit students who would perform poorly from taking the test. Since all students have to take the test, this means converting poorly-performing students into non-students, letting them drop out.

It looks to me like California’s educational establishment has opted for the easy way.

On the chart below, the purple line shows California’s dropout rate from 1997 through 2009; you can see the percentages on the right-hand side of the chart. The other lines show the percentage — on the left side of the chart — of California’s students who passed the standardized tests for Math, Language, and Science. California’s passing percentage in each field has increased lockstep as dropouts increased.

It is worse than that, though. The percentage of students passing the standardized tests has increased by about 15 percent, on average, while the percentage of students dropping out has just about doubled. That’s an extraordinarily expensive improvement.

Did the schools follow this strategy deliberately? You can't rule it out. People react to incentives, and the Act provides an incentive to abandon those who will likely perform poorly on the tests. Teachers will probably object to that, but we have no reason to believe that they should somehow be different that most people and ignore the incentives. Besides, we’ve already seen examples of teachers and administrators cheating on these tests.

Teachers assert that the solution to all of No Child Left Behind problems is to abandon it. The other solution, of course, is to fix the incentives. The way to do that would be to assign the schools a huge financial penalty for dropouts. Teachers and administrators would scream. They would tell us that dropouts result from problems at home and socioeconomic conditions.

No doubt, many students have terrible home conditions that put these children at a huge disadvantage, but those are exactly the children that we should be giving the most attention. A lousy home environment doesn't explain the sudden increase in dropouts. These issues have been with us for a very long time. I took my first college economics class, The Economics of Poverty, in the 1969-1970 school year. There is nothing about poverty today that we didn't discuss in that class, except that the returns to education have increased dramatically since then.

Failure to educate disadvantaged children guarantees that the perverse cycle of poverty and despair is perpetuated. Providing them with quality education, even with the active resistance of family, friends, culture, and the students themselves, is the only way to provide them with even the minimum hope for the upward mobility that government-provided education implicitly promises.

Abandoning our least advantaged children is unconscionable. If we are to have an egalitarian and merit-based society, we must reduce the dropout rate. The way to ensure that no one is abandoned is to penalize the school for dropouts. It sounds harsh, but we owe it to the students, and we owe it to ourselves.

Bill Watkins is a professor at California Lutheran University and runs the Center for Economic Research and Forecasting, which can be found at clucerf.org

Flickr Photo by kerryj.com: "On national standardised testing, from a brilliant educator in Western Australia - a student's view of national summative assessments".

Viewing all 3794 articles
Browse latest View live


Latest Images