Quantcast
Channel: Newgeography.com - Economic, demographic, and political commentary about places
Viewing all 3789 articles
Browse latest View live

America's Largest Commuter Sheds (CBSAs)

$
0
0

Core Based Statistical Area (CBSA) is the Office of Management and Budget’s (OMB) way of defining metropolitan regions.  The OMB (not the Census Bureau) defines criteria for delineating its three metropolitan concepts, combined statistical areas, metropolitan statistical areas, and micropolitan statistical areas. The CBSA has obtained little use since this adoption for the 2000 census. According to OMB:

"A CBSA is a geographic entity associated with at least one core of 10,000 or more population, plus adjacent territory that has a high degree of social and economic integration with the core as measured by commuting ties."

In this context, core means urban area. If an urban area has 50,000 or more population, OMB defines a metropolitan area around it. If an urban area has 10,000 or more population but fewer than 50,000 residents, OMB defines a micropolitan area around it.

It is also important to understand that CBSAs, whether CSAs, metropolitan areas, or micropolitan areas are not urban areas. In fact, 94% of the area in CBSAs is rural --- only 6% is urban (built-up urban cores and suburbs).

Combined statistical areas (CSAs) are made up of adjacent CBSAs that have a significant amount of commuting between them, but less than required for a metropolitan area or a micropolitan area. In some cases the CSAs seem so obvious as to make the smaller metropolitan area definitions seem ludicrous. One keen observer, Michael Barone of the Washington Examiner, put San Francisco and San Jose, as well as Los Angeles and Riverside-San Bernardino together in his recent analysis of population growth, because, as he rightly pointed out, they seem to "flow together."

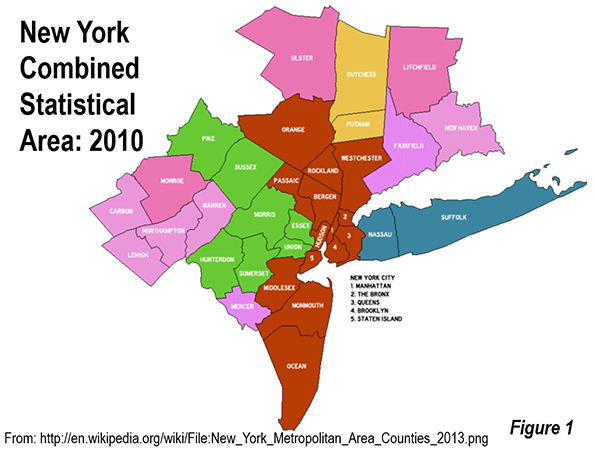
Some CSAs are very large. For example the New York CSA is composed of 8 metropolitan areas (New York (NY-NJ-PA), Bridgeport (CT), New Haven (CT), Trenton (NJ), Allentown (PA-NJ), Kingston (NY). Torrington (CT) and East Stroudsburg (PA). On the other hand, many major metropolitan areas are not a part of a CSA, such as Phoenix and San Diego.

Since the term CBSA seems unlikely to achieve popular usage, this article uses the term "commuter shed" to denote the highest local level of metropolitan definition.  The highest level for the largest regions are is the combined statistical area (CSA). In others they are defined as a metropolitan area or micropolitan area. The result is a consistent standard of economic geography defined by commuting. Yet such lists are rare or non-existent. A table of all 569 commuter sheds (over 1,000,000 population) is posted to demographia.com.

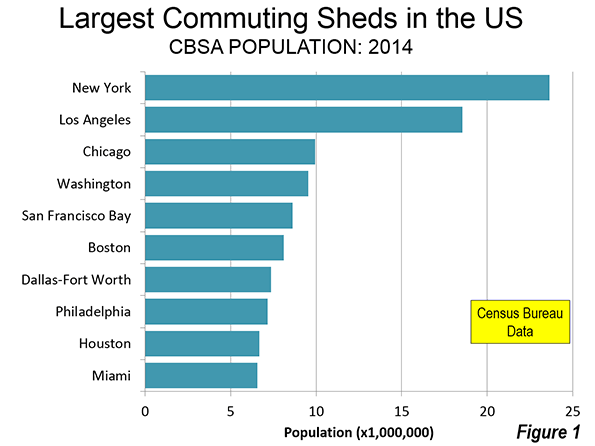
10 Largest Commuter Sheds

As a 2014, there were 60 commuter sheds in the United States with more than 1 million population (Table).

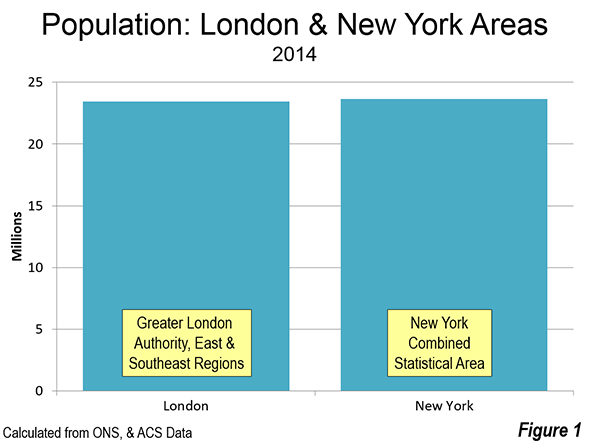
Not surprisingly, the nation's largest commuter shed is New York. New York stretches from New Haven and Bridgeport, and Connecticut which are separate metropolitan areas out to Allentown which is principally in Pennsylvania and Trenton in New Jersey. The New York commuter shed has a population of 23.6 million. In fact, given the extensive suburban rail transit service between Southwestern Connecticut and New York City, it may be surprising that New Haven and Bridgeport are separate metropolitan areas, both with nearly 1,000,000 population. Moreover, there is virtually no break in the continuously built-up area between New York and southwestern Connecticut (Fairfield and New Haven counties) --- they "flow together" to use Barone's term. Since 2010, the Allentown metropolitan area, with nearly 1,000,000 population, was added to the New York CSA.

The second largest commuter shed is Los Angeles-Inland Empire, with 18.6 million residents. This includes the Los Angeles metropolitan area (Los Angeles and Orange Counties, Ventura County and the Riverside San Bernardino metropolitan area (Inland Empire, including Riverside and San Bernardino County), which is one of the largest in the nation, with more than 4 million population. Here, as in New York, there is virtually no break in the built-up urbanization between the two urban areas, Los Angeles and Riverside-San Bernardino.

Chicago is the third largest commuter shed, though its adjacent metropolitan areas are far smaller than in New York and Los Angeles. Chicago is also growing very slowly, with its population increase over the last year so small that it will take nearly to 2020 to reach 10 million, even though it only has 72,000 to go.

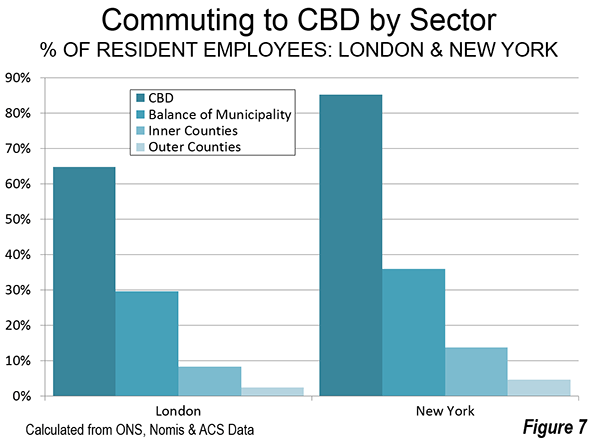
Just below Chicago, Washington and Baltimore combine to form nation's fourth largest commuter shed. Already with more than 9.5 million residents and strong growth this decade, Washington-Baltimore could pass 10 million population and Chicago by 2020. Washington-Baltimore is unique in combining two of the nation's historically largest and most intensely developed core municipalities along with the much more extensive suburbs (which contain 85% of the population). Washington-Baltimore now extends to Franklin County, Pennsylvania.

The fifth largest metropolitan complex is the San Francisco Bay Area with a population of 8.6 million. This includes the San Francisco, San Jose, Vallejo, Santa Rosa, Santa Cruz metropolitan areas and the recently added Stockton metropolitan area.. There is no break in the urbanization between San Francisco and San Jose.  

The Boston CBSA was enlarged during the last decade to include Providence, a major metropolitan area in its own right. Boston also includes the Worcester metropolitan area, which is nearing 1,000,000 population. Boston-Providence has a population of 8.1 million.

The top 10 is rounded out by Dallas-Fort Worth (7.4 million), Philadelphia (7.2 million), Houston (6.7 million), and Miami (6.6 million).

The largest metropolitan complex in the nation that is not a part of a CSA is Phoenix, which is ranked 14th. Only one other commuter sheds in the top 20 is not a CSA (San Diego) and only six of the 60 commuter sheds with more than 1,000,000 population is not a CSA.

Fastest Growing Commuter Sheds

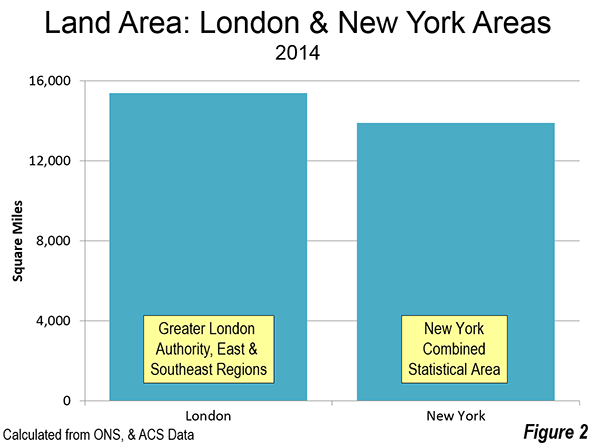
The fastest commuter shed growth rates are in the South, which accounts for eight of the ten fastest growing commuter shed's. Austin ranks number one in annual percentage growth between 2010 and 2014, a position it also holds among major metropolitan areas. Cape Coral (Florida) ranks second. Cape Coral also ranks as the fastest growing among the midsized metropolitan areas (from 500,000 to 1,000,000 population). Houston ranks third in growth rate. Houston and Dallas-Fort Worth are the only commuter sheds with more than 5 million population that are among the top 10 in growth. The two non-Southern top 10 entries are from the West: Denver and Phoenix (Figure 2).

Slowest Growing Commuter Sheds

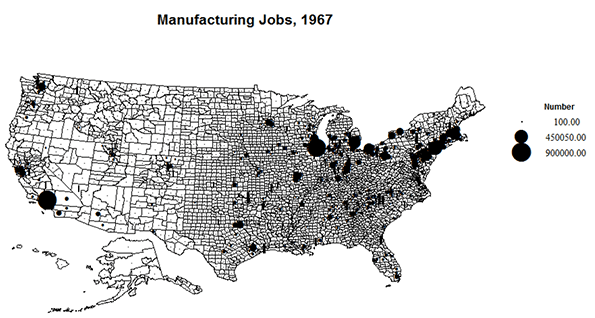
All of the 10 slowest growing major commuter sheds are in the old industrial heartland of the Northeast and Midwest. Cleveland-Akron is the slowest growing, having lost approximately 0.1 percent of its population annually. Pittsburgh, Dayton, Buffalo and Detroit have also lost population.

Continuing Dispersion

The dispersion of US metropolitan areas continues, with perhaps the ultimate example of Portland (Oregon), which was recently combined with four other metropolitan areas (see: Driving Farther to Quality in Portland). The "flowing together" suggest that the combined statistical area may be an increasingly important in assessing regional trends.


Core Based Statistical Areas (Commuter Sheds): United States
Over 1,000,000 Population in 2014
2014 Population RankMetropolitan Area20102014Annual % Change: 2010-2014Growth Rank
1New York-New Haven, NY-NJ-CT-PA CSA23.07723.6330.56%41
2Los Angeles-Inland Empire, CA CSA17.87718.5500.87%30
3Chicago, IL-IN-WI CSA9.8419.9280.21%50
4Washington-Baltimore, DC-MD-VA-WV-PA CSA9.0529.5471.26%18
5San Fransicsco-San Jose, CA CSA8.1548.6071.28%17
6Boston-Providence, MA-RI-NH-CT CSA7.8948.1000.61%38
7Dallas-Fort Worth, TX-OK CSA6.8187.3531.79%8
8Philadelphia, PA-NJ-DE-MD CSA7.0687.1650.32%47
9Houston, TX CSA6.1156.6862.13%3
10Miami-West Palm Beach, FL CSA6.1686.5581.46%14
11Atlanta, GA CSA5.9106.2591.36%16
12Detroit, MI CSA5.3195.315-0.02%56
13Seattle, WA CSA4.2754.5271.36%15
14Phoenix, AZ MSA4.1934.4891.62%9
15Minneapolis-St. Paul, MN-WI CSA3.6853.8350.94%26
16Cleveland-Akron, OH CSA3.5163.498-0.12%60
17Denver, CO CSA3.0913.3451.88%6
18San Diego, CA MSA3.0953.2631.25%20
19Portland-Salem, OR-WA CSA2.9213.0601.10%23
20Orlando-Daytona Beach, FL CSA2.8183.0461.84%7
21Tampa-St. Petersburg, FL MSA2.7842.9161.10%22
22St. Louis, MO-IL CSA2.8932.9110.15%52
23Pittsburgh, PA-OH-WV CSA2.6612.654-0.06%59
24Charlotte, NC-SC CSA2.3762.5381.57%11
25Sacramento, CA CSA2.4152.5130.94%27
26Salt Lake City-Ogden, UT CSA2.2722.4241.54%12
27Kansas City, MO-KS CSA2.3432.4120.68%36
28Columbus, OH CSA2.3092.3980.90%28
29Indianapolis, IN CSA2.2672.3540.89%29
30San Antonio, TX MSA2.1432.3291.98%4
31Las Vegas, NV-AZ CSA2.1952.3151.26%19
32Cincinnati, OH-KY-IN CSA2.1742.2080.37%46
33Raleigh-Durham, NC CSA1.9132.0751.94%5
34Milwaukee, WI CSA2.0262.0440.21%51
35Austin, TX MSA1.7161.9432.97%1
36Nashville, TN CSA1.7881.9131.59%10
37Norfolk-Virginia Beach, VA-NC CSA1.7791.8190.53%43
38Greensboro-Winston-Salem, NC CSA1.5891.6300.60%39
39Jacksonville, FL-GA CSA1.4701.5431.14%21
40Louisville, KY-IN CSA1.4601.4990.62%37
41Hartford, CT CSA1.4861.4880.02%55
42New Orleans, LA-MS CSA1.4141.4801.09%24
43Grand Rapids, MI CSA1.3791.4210.71%34
44Greenville, SC CSA1.3621.4100.81%33
45Oklahoma City, OK CSA1.3221.4091.50%13
46Memphis, TN-MS-AR CSA1.3531.3700.29%48
47Birmingham, AL CSA1.3031.3170.27%49
48Richmond, VA MSA1.2081.2601.00%25
49Harrisburg, PA CSA1.2191.2400.39%45
50Buffalo, NY CSA1.2161.215-0.02%57
51Rochester, NY CSA1.1751.1770.05%54
52Albany, NY CSA1.1691.1740.10%53
53Albuquerque, NM CSA1.1461.1660.40%44
54Tulsa, OK CSA1.1061.1390.69%35
55Fresno, CA CSA1.0811.1210.84%32
56Knoxville, TN CSA1.0771.1040.58%40
57Dayton, OH CSA1.0801.078-0.05%58
58Tucson, AZ CSA1.0281.0510.53%42
59El Paso, TX-NM CSA1.0131.0500.85%31
60Cape Coral, FL CSA0.9401.0282.13%2
In millions
Data from US Census Bureau
Metropolitan Statistical Areas shown only if not in a Combined Statistical Area.


Wendell Cox is Chair, Housing Affordability and Municipal Policy for the Frontier Centre for Public Policy (Canada), is a Senior Fellow of the Center for Opportunity Urbanism (US), a member of the Board of Advisors of the Center for Demographics and Policy at Chapman University (California) and principal of Demographia, an international public policy and demographics firm.

He is co-author of the "Demographia International Housing Affordability Survey" and author of "Demographia World Urban Areas" and "War on the Dream: How Anti-Sprawl Policy Threatens the Quality of Life." He was appointed to three terms on the Los Angeles County Transportation Commission, where he served with the leading city and county leadership as the only non-elected member. He served as a visiting professor at the Conservatoire National des Arts et Metiers, a national university in Paris. 

Photo: Albany (NY) City Hall (by author)


Small Towns: The Value of Unique Places

$
0
0

Rural and small towns suffer from a loss of faith in their place, and seem desperate to be recognized in our new, standardized world. Plenty of our developed land remains specific and even unique, but the highway does not go to it. Outside the cities, unpretty feed stores, the availability of tractor parts, and the presence of cattle hardly contribute to scientifically measured success. The refuge of the individual, the ability of a person to see his or her life as meaningful while it is separate and apart from a larger mass, is crippled. You’re only as good as your income; you’re only as witty as your social media posts, and you’re only red or blue.

In Sanford, Florida, the mayor recently sat down with my urban design students and discussed the future of this small town. Sanford, once larger than Orlando, was a significant port, loading Central Florida’s farm produce onto ships and railroad cars for hungry Northeasterners. Now diminished, its quaint downtown reeks of history, beautifully preserved, but only a few jobs exist. Today’s brick-paved Main Street, with its galleries, bookstores, and restaurants, caters to a trickle of visitors, but Sanford feels the effects of being on Orlando’s periphery.

“People come to me,” said Mayor Jeff Triplett, “and ask me to help bring jobs to Sanford. They wish we had a national chain drugstore like a Walgreens or CVS on Main Street. That,” he declared,” is their measure of having arrived.” Sanford citizens, he explained, see something like this as true progress.

“That would kill your Main Street,” protested one student. Enjoying Sanford’s originality, the students encouraged the Mayor to consider that Sanford could do better than a franchise’s low-paying jobs. The quest, however, for some sign of progress continues.

The conversation reflects how meaning, or a sense of place, is measured only in relation to a greater national homogeneity. People petition their leaders to bring meaning to their towns via a national chain. This monolithic built environment is, by itself, a giver of meaning. To someone living in a small town, the standardization of our lifestyle is the normal condition, and the lack of homogeneity is seen as impoverishment. It is somehow a disease, a condition of malnutrition, to be deprived of the physical structures of standardization.

Today’s homogeneity can be a strength, providing a level playing field for society. Its virtues are equity, efficiency, and supermobility. As a single, unified scaffold, our homogenous built environment has grown outward and filled our land to the edges, and it places cities at the focal points of a grand grid. Mainstream literature extols the virtues of this grid, and celebrates today’s urban life. But homogeneity has its downsides, and places that are outside of this grand grid of progress suffer deeply. Variety is subsumed by today’s great global culture.

Once, writers like Alvin and Heidi Toffler, and George Orwell, warned against this kind of growth, citing the hazards of the rational, scientific underpinnings of modernity. Objectifying everything and extinguishing the mystery of life seemed to them to be an exercise in nihilism. Other thinkers in the 1930s and 1940s also foresaw that the monolith of western civilization would consume everything in its path. Indeed, this consumption of unique places has been largely accomplished, and those that remain are considered stunted and backward. Everywhere one looks, the loss of variety and individualism is profound.

And so small towns suffer in silence, their best and brightest arriving like refugees into bigger cities. Smooth, suburban density levels set our current standards, while agriculture and ranching seem unable to retain people.

Science has brought us to this point, but blaming science is like blaming the trash can for the garbage within it. If the manmade environment we’ve created is imperfect, then it is a reflection of us. It probably isn’t going away anytime soon. We now exist in a nearly wholly manmade environment. Even the most rural exurban dweller lives in a substantially more technological and manmade environment — house, car, job — than the most urbane city dweller did a century ago.

No, this crisis of is not a failure of science. It is a lack of quality. What we’ve built is everywhere, but it isn’t very good… yet.

What to do with this homogenous world is the next generation’s big task. But we, too, must act now to confront the physical evidence of this imperfection. Change will come when we accept that we must fix it, and not wait for a deus ex machina to swoop down. Those longing for an apocalypse are seeking the easy way out: let flood, fire, or epidemic take care of the mess.

I’d rather take responsibility for what has been created, and take better care of it. This monolithic, homogenous latticework of roads and buildings is the new frontier. Where man has already strongly modified nature, there is plenty of room for improvement.

More cities that nurture native industry will create this new future. Balancing that approach with the Jeffersonian ideals of a strong, rural economy will bring equity to areas that are suffering. And that will build upon our strength.

Richard Reep is an architect with VOA Associates, Inc. who has designed award-winning urban mixed-use and hospitality projects. His work has been featured domestically and internationally for the last thirty years. An Adjunct Professor for the Environmental and Growth Studies Department at Rollins College, he teaches urban design and sustainable development; he is also president of the Orlando Foundation for Architecture. Reep resides in Winter Park, Florida with his family.

Photo of Sanford by Christine Wood

A Selectively Golden State Jobs Outlook

$
0
0

Every year, I, along with Pepperdine’s Michael Shires, have what has become the often-dispiriting job – for a 40-year California resident – of evaluating the nation’s metropolitan regions in terms of both short-term and midterm job growth. Yet, this year, the results for our state’s metros are somewhat improved, as California’s post-recession job-growth rate now equals, and could surpass, the still-somewhat insipid national average.

After years of subpar growth, California is reaping the advantages of a fortuitous economic alignment of ultralow interest rates, high stock values and growing investments in high-end residential real estate. Vast sums are pouring into the state for new tech ventures, speculative hotel and residential developments. Low borrowing rates allow the state to keep pace with its massive debts, while buoyant stocks help the massive government pension plans, which invest in the market.

Read the entire piece at The Orange County Register.

Joel Kotkin is executive editor of NewGeography.com and Roger Hobbs Distinguished Fellow in Urban Studies at Chapman University, and a member of the editorial board of the Orange County Register. He is also executive director of the Houston-based Center for Opportunity Urbanism. His newest book, The New Class Conflict is now available at Amazon and Telos Press. He is also author of The City: A Global History and The Next Hundred Million: America in 2050.  He lives in Orange County, CA.

Photo by Thomas Pintaric (Own work) [GFDL or CC-BY-SA-3.0], via Wikimedia Commons

Commuting in New York

$
0
0

The New York commuter shed (combined statistical area) is the largest in the United States, with 23.6 million residents spread across 13,900 square miles in New York, New Jersey, Connecticut and Pennsylvania. It includes 35 counties, in eight metropolitan areas, including New York (NY-NJ-PA), Allentown-Bethlehem (PA-NJ), Bridgeport-Stamford (CT), East Stroudsburg (PA), Kingston (NY), New Haven (CT), Torrington (CT) and Trenton (NJ). The criteria for designation of combined statistical areas is here and Figure 1 is a map of the New York CSA.

This article examines employment and commuting in the New York area by broad geographic sector. The core sector, of course, is Manhattan (New York County). The second sector is the balance of the city of New York, the outer boroughs of the Bronx, Brooklyn, Queens and Staten Island. The inner counties are Westchester and Nassau in New York as well as Bergen, Essex, Hudson, Middlesex, Passaic and Union in New Jersey. The balance of the CSA is in the outer counties.

Distribution of Employment

The New York CSA is home to the world's second largest central business district (CBD). Only Tokyo's Yamanote Loop has more employment. Overall, Manhattan (New York County) has 2.4 million jobs, with approximately 2.0 million jobs in the CBD, which covers virtually all of the area to the south of 59th Street. Yet, despite this impressive statistic, unmatched anywhere in the country, Manhattan contains only 22 percent of the employment in the New York area. The largest portion of employment is in the outer counties, with 32 percent (Figure 2). Combined, the inner and outer county suburbs represent 60 percent of the jobs in the New York commuting shed.

Where People Live and Work

The distribution of employee residences contrasts sharply with that of employment. Manhattan displays the most extreme imbalance between jobs and where people live. (Figure 3). There are nearly three times as many jobs as resident employees in Manhattan (2.8 jobs per resident employee). The most evenly balanced sector is the outer counties, which are at near parity, with 0.97 jobs for every resident employee. The outer counties are relatively balanced, with 0.87 jobs per resident employee. The balance of New York City has 2.7 million resident workers and only 1.9 million jobs. There are only 0.68 jobs per resident employee. When the entire city is considered, including Manhattan, there is a much closer balance, with 1.16 jobs per resident worker.

Most employees work in their sector of residence. About 85 percent of Manhattan residents work in Manhattan. Nearly 79 percent of outer county residents work in the outer counties, while 71 percent of inner county residents work in the inner counties. Perhaps surprisingly, nearly two-thirds as many inner county residents work in the outer counties as work in Manhattan. Only 55 percent of resident workers in the four outer boroughs of New York City work in the outer boroughs (Figure 4)

Commuting to Manhattan

One of the most enduring urban myths is built around the idea of the monocentric city. This is the conception that most people work downtown (the CBD). This has been an inaccurate characterization for decades, even in New York. In New York, as noted above, the CBD accounts for little more than 20 percent of employment. By comparison, however, this is a substantial number compared to other large North American commuter sheds. The Chicago CSA, for example (the Loop) has about 11 percent of its employment downtown (the Loop), Toronto has less than 15 percent and Los Angeles is under two percent.

The overwhelming majority of jobs in Manhattan are filled by local residents or nearby commuters. According to American Community Survey "flow" data for 2006-2010, 73 percent of Manhattan commuters live in Manhattan or in the balance of New York City. Another 18 percent of commuters travel from the inner counties. This leaves less than eight percent of commuters traveling from the outer counties. Less than two percent of commuters travel to Manhattan from outside the CSA (Figure 5).

How Commuters Travel

New York relies on transit far more than any other US commuter shed. Overall approximately 27 percent of work trip travel is on transit. However, the extent of transit use varies widely by sector. Transit accounts for 75 percent of work trip travel to Manhattan employment. Transit also has a significant market share to jobs in the outer boroughs (38 percent). Jobs in the city of New York account for 88 percent of the transit commuting in the CSA. Outside the city, transit carries a much smaller share. In the inner counties, transit captures nine percent of commuters, while accounting for a much smaller 2.6 percent in the outer counties. In the outer counties, transit's market share is slightly more than one-half the national average (Table).

Cars have the largest work trip market share in every commuter shed in the nation, including the New York area, where they provide 61 percent of trips. Again, however, there is a very wide variation between the sectors. Cars provide less than 15 percent of commute trips to jobs in Manhattan. They provide a larger 44 percent share in the outer boroughs. In the inner counties and outer counties, cars are strongly dominant, providing for 80 percent and 88 percent of the commutes respectively.

The walking commuter share is lower than might be expected in famously pedestrian oriented Manhattan. Manhattan has by far the densest urbanization in the United States. With more than 70,000 residents per square mile (28,000 per square kilometer), Manhattan is nearly four times as dense as San Francisco, which has the highest density of any large municipality in the US outside New York. With such a high density, and a job density of more than 100,000 per square mile (nearly 40,000 per square kilometer), it may be surprising that workers in the outer boroughs rely on walking to work to a greater extent. Walking has a 7.4 percent commuting share in Manhattan, and a 9.6 percent share in the outer boroughs, despite their much lower population and employment densities.


Table
New York CSA Means of Transportation: Work Location: 2013
AreaDrive AloneCar PoolTransitBicycleWalkOtherWork at Home
Manhattan10.0%2.7%74.7%1.0%7.4%1.8%2.4%
Balance: NYC37.0%7.3%38.7%1.1%9.6%1.4%4.8%
Inner Counties71.6%8.6%9.4%0.3%4.2%1.7%4.2%
Outer Counties79.6%8.6%2.6%0.3%2.8%1.1%5.0%
New York CSA54.3%7.1%26.9%0.6%5.4%1.5%4.2%
Exhibit: United States76.4%9.4%5.2%0.6%2.8%1.3%4.4%
Calculated from American Community Survey


The faster work commute trips of cars is illustrated in the sectoral analysis. Automobile commuting is most dominant in the outer county suburbs, which have the largest number of resident workers and jobs. The average one-way work trip travel time is 24.7 minutes in the outer counties, little more than one half the 49.7 minute one way trip to jobs in Manhattan. The inner counties have the second shortest travel time, at 28.5 minutes. Jobs in the outer boroughs of New York City have an average work trip travel time of 36.4 minutes (Figure 7).

A Dispersed Commuter Shed

Despite its reputation for monocentricity, and its primacy in terms of the sheer numbers of core area employees, the New York combined statistical area remains surprisingly dispersed when it comes to jobs, contrary to popular accounts, although less so than others.

-----

Wendell Cox is Chair, Housing Affordability and Municipal Policy for the Frontier Centre for Public Policy (Canada), is a Senior Fellow of the Center for Opportunity Urbanism (US), a member of the Board of Advisors of the Center for Demographics and Policy at Chapman University (California) and principal of Demographia, an international public policy and demographics firm.

He is co-author of the "Demographia International Housing Affordability Survey" and author of "Demographia World Urban Areas" and "War on the Dream: How Anti-Sprawl Policy Threatens the Quality of Life." He was appointed to three terms on the Los Angeles County Transportation Commission, where he served with the leading city and county leadership as the only non-elected member. He served as a visiting professor at the Conservatoire National des Arts et Metiers, a national university in Paris. 

Photograph: Inner County New York CSA: City of Elizabeth, seat of Union County, New Jersey (by author)

Havana, Cuba–The City Of Scarcity

$
0
0

1. I’m now a week removed from my Cuba trip, where I spent 4 days in Havana biking through the city’s near-hourly mix of high heat and torrential rainfall, returning to my bed & breakfast each night covered in soot. My first few days back in Miami I spent sick and exhausted in a hotel, but managed in the latter half to pump out a Forbes article on Miami’s inequality. The piece was slammed the next morning by the Miami New Times–a local alternative rag–for making arguments that staff writer Kyle Munzenrieder found “structurally racist.” I sent an email asking him to elaborate on the racism charge (since he didn’t in the article), but haven’t heard back.

2. That said, my mind mostly remained in Cuba. It would be hard to summarize on this page everything that I learned there, since the nation has a complex history, and enforces a dizzying array of Communist-inspired regulations that would mystify Americans, and that has impoverished average Cubans. In coming weeks, I’ll explore these economic policies–and the effects of the U.S. embargo–in depth for other publications. But I’ll say a quick word here about Havana’s living conditions, peppered with a few of the more than 300 photographs I took.

While exploring Havana’s neighborhoods, the thing that jumped out was not the city’s poverty (although there was plenty of that), but its scarcity. Because Cuba’s government does not value or comprehend mass production–namely not for agriculture–there are shortages of everything. In America, we take for granted that any basic convenience is but a short drive away. But in Havana, running errands isn’t that simple. City residents have limited mobility: the bus system is cheap but unreliable, the newly-private taxi system is efficient but costly, and for most Cubans, owning a bicycle–much less an automobile–requires years of savings. So they must stick to neighborhood stores with minimal inventory, and even if they did all have cars, there would still be few outside options.

To understand why, just imagine a city where every store is literally 1% of what it would be in America.

A typical bakery in Havana.

A typical bakery in Havana.


While a U.S. pharmacy like Walgreens or CVS sells not only drugs, but numerous foods, beverages, household goods, etc., the average Havana farmacia has a few shelves with maybe 100 drugs–and that’s it. Modern U.S. grocery stores often exceed 50,000 square feet, and sell thousands of products. In Havana, different food types are sold separately in small, rickety stores that often contain one or two items. Mercados sell fruit and veggies; carnicerias sell meat; and many panaderias (pictured above) sell a low-nutrition roll that would be served as a side at a crappy American road diner. The typical gas station had not even one-tenth of what you would find in a 7-Eleven.

A mercado that sold only mangos and potatoes.

A mercado that sold only mangoes, plantains and potatoes.


Half of the available meat supply at a downtown carniceria

Half of the available meat supply at a downtown carniceria


This isn’t surprising, since most Cubans earn about $20/month, and thus have minimal spending power. But the scarcity effects all income groups. For example, as an American tourist, I was considered massively wealthy by Cuban standards. That said, my expenditures were mostly limited to my B&B, my bike rental, bottled water, cheap cafes, and cab fares. My one splurge was taking a local couple who I had befriended out to a restaurant that, by Cuban standards, was exquisite, but that didn’t exceed the quality or cost of an Applebee’s. Over 4 days, all this cost $360. Compared to the few other U.S. tourists I met, this was an extremely economical budget–but was still more than what many Cubans spend annually.

Yet despite this, I found myself unable to buy basic things. For example, during my first night in Havana, I didn’t realize–until it was too late–that the B&B landlord had not provided toilet paper. In America, this would be a glaring oversight, but in Havana, I would discover, is normal. This forced me to navigate my neighborhood at 3am, offering pesos to the many teenage boys still standing outside, to bring out “papel higienico” from their houses. Every time I tried this, they would each explain, in rather comical fashion, that none was available. Finally I found a teenager who spoke passable English, and asked him how this could be. After sending his little brother in to find something, he explained that “in Havana, toilet paper is a delicacy–like chocolate,” and that most residents don’t just have any sitting around. So how did people cope?

“Here in Havana, we have a saying,” he quipped. “We say, ‘Cubans have a good ass. Our asses work for all kinds of paper. Toilet paper, newspaper, book paper–any kind of paper’.”

When his younger brother reemerged from the house, he was holding for me a single sheet torn from his school journal. I would later learn while interviewing impoverished Cubans that other “delicacies” included soap, meat, milk, cheese, and ice cream, not to mention the hundreds of gadgets and appliances found in a typical American home.

3. One thing I mentioned before leaving for Havana was that I wanted to see how urban street life functioned in a city suffering from 50 years of stagnation. I found much that was good and bad, but for the sake of brevity, will describe this week what was good.

Havana, both in downtown and the neighborhoods, offers a scintillating street culture dominated by people, music, and commerce (spartan as it may be). In many ways, it is an urban flaneur’s dream, as one can spend hours weaving through crowded streets full of friendly people who will spill their life details to a stranger. There are, in fact, few places one can go without finding numerous people on each block, and rather than ignoring one another, many are in perpetual communication, often yelling to each other from adjacent buildings.

Just blocks from the Capitol building.


A busy street in the southwestern Havana slum where I stayed.

A busy street in the southwestern slum where I stayed.


This atmosphere continues well into the early morning, as mostly teenagers stand on corners to laugh, drink and sing. For them, a rich gringo passerby is not a target, but a source for amusing dialogue, especially since they will bend over backwards to try overcoming the language barrier.

But this street life seems less rosy when you consider that it is rooted in hardship. Many Cubans are forced by poverty to live cramped together–sometimes 10 to a house, according to one person I spoke with–so naturally they would escape to the street. Because some cannot afford front doors and windows, much less advanced security, there is little privacy, and people treat sidewalks like their extended living rooms. Because so few people own cars–and because those cars run slower than in America–traffic is less menacing, allowing pedestrians to linger in roadways. Because parks are in such disrepair, sporting children instead compete in the streets. And the built fabric itself is so narrow because modern buildings are seldom constructed.

An equally fascinating aspect of Havana’s street culture, to be covered next week, was the physical decline. It was not difficult to tell that Havana was once a very advanced society indeed, defined by a merchant and governing class who had sophisticated urbanist sensibilities. At times while biking through Havana’s mild hills, I would get these weird flashbacks of San Francisco, when observing large, elaborate Spanish architecture that interspersed gracefully alongside pocket parks, public stairways and boulevards. But imagine if San Francisco had undergone 50 years of Detroit-style decline and neglect, and you’ll get an idea of the blight that pervades Havana. Many of the photos I provide next week will alarm you.

4. I could go on and on about other aspects of Havana’s street life, but here are a few tidbits that readers will find interesting.

– As might be expected from a Communist dictatorship, there were few religious symbols, but numerous political insignia celebrating the Revolution’s enduring strength. Ironically, many of these signs were in disrepair.

OLYMPUS DIGITAL CAMERA

Translation: 'study, work, rifle.'

Translation: “study, work, rifle.”


A celebration of CDRs, the network of neighborhood watchdogs tasked with upholding the Communist order

A celebration of CDR, the network of neighborhood watchdogs tasked with upholding the Communist order


– Cuba’s many old automobiles might be charming, but are terrible for the environment. Old age and poor maintenance mean that many spew out toxic exhaust that blows into pedestrians’ faces. In the central parts of Havana, where streets were narrow and buildings taller, the stench lingers, making life unbreathable.

They also frequently break down; it’s hard to bike 10 blocks without finding some car on the side of the road, hood popped.

– In America, farmer’s markets have become boutique destinations that sell products of greater quality and expense than what is found in a supermarket. Tables are often run by “gentlemen farmers” who view their activity as a hobby. In Havana, by contrast, such markets expose the desperation of the Cuban people, as many tables offer screws, dishes, spare auto parts, and whatever else a family may have scavenged.

– Street drainage is terrible after it rains.

– And more:

OLYMPUS DIGITAL CAMERAOLYMPUS DIGITAL CAMERAOLYMPUS DIGITAL CAMERAOLYMPUS DIGITAL CAMERA

Here I am with my host family

Here I am with my host family

This piece originially appeared at Market Urbanism.

Scott Beyer is traveling the nation to write a book about revitalizing U.S. cities. His blog, Big City Sparkplug, features the latest in urban news. Originally from Charlottesville, VA, he is now living in different cities month-to-month to write new chapters.

Havana, Cuba–Stagnation Doesn’t Preserve Cities, Nor Does Wealth Destroy Them

$
0
0

Before taking my trip to Havana, one thing that I was curious about was how a half-century of Communism had affected the built fabric. While there are obvious disadvantages to economic stagnation, I figured that it would have at least created a charming-looking city. There are, after all, a handful of U.S. cities, and numerous European ones, that have resisted growth, modernization, and the automobile, only to remain quaint and historic. But it didn’t take even a 10-minute cab ride from the airport to realize that my assumption about Havana had been naïve—even if it is still held by many of the city’s blissfully uncurious tourists.

In fact, very little about Havana has been “preserved.”  Instead, everything in the city is merely old, and because little gets produced, nothing is replaced. This applies to the automobiles, furniture, hand tools, manufacturing equipment—and most certainly the buildings. Collectively, this stagnation has destroyed the look of the city, with a physical blight that stretches nearly every block from downtown to the outer slums.

OLYMPUS DIGITAL CAMERA

If I could define in one statement what Havana looks like, after four days of extensively biking and walking through, I’d call it the Latin American Detroit. It was a once-great city that declined because of bad policies, and its pervasive ruination serves as a constant reminder of this. The houses themselves, while large and ornate, are almost uniformly inadequate by U.S. standards. If they have not crumbled to the ground altogether, many are caving in. The foundations are crooked, full of holes, and marred by broken windows and doors. Because of Havana’s European roots, stucco is a common material, but on most buildings is falling off, or in some cases has disappeared. Almost every building has dirt and grime, while some are covered in it.

And this is for Havana’s nice parts. Once I began biking out of the central neighborhoods and into the slums, I found that symbols of past wealth disappeared altogether, and were replaced with what in the U.S. would be considered shacks. These structures were usually patched up with knotted wood, metal scraps, and thatching. One gentlemen who lived in the poor neighborhood of Cerro, and who I spoke with at length, described his area as akin to a Brazilian favela—which I found believable. The two pictures I took below were from his front porch, and mirrored the aesthetic of such areas.

So what is it like to live and work in these buildings? As one might expect, the outside decay permeates to the inside. The best access I got was through a 24-year-old working-class woman named Indira. I met Indira on my first night in Havana when stopping to ask directions, and after noticing that she spoke good English, took her to dinner. We became friends, and she invited me into her downtown apartment, where she lived with her mother and father-in-law. The apartment was roughly 150 square feet—far smaller than a typical New York City micro-unit. Because it had a high ceiling, the family had built a horizontal wooden floorboard halfway up the wall that served as the second floor, and built a makeshift staircase leading up. This upstairs “room” was for the mother and father-in-law, while Indira lived in the main room below, sleeping crammed against the kitchen.

Even in such a small space, there were numerous malfunctions. There was no hot water, either for cooking or showering. In fact, the shower did not even work, meaning that the family instead took scrub baths. Because the toilet didn’t flush, they had to pour water into it each time after use to accelerate the draining. The built-in wooden floorboard was clearly sagging under the weight of the upstairs furniture, raising concerns that it would one day collapse. As for the actual roof—it had been crumbling for years, and was fixed recently by a neighborhood handyman. To pay for the work, the family had to spend over a year saving up $150.


The main story of Indira's apartment.

The main story of Indira’s apartment.


The second story, upheld by a wood board

The second story, upheld by a wooden board


Public Infrastructure

Just as peoples’ private houses were crumbling, so too was the public infrastructure—again, much like Detroit. The public spaces, while well-used, were typically full of trash, overgrown weeds, and broken objects. Many parks, for example, were defined more by concrete than grassland. Streets, if they were even completely paved, were filled with potholes and had such poor drainage that, after it rained, they would gather huge puddles.

A water-less pool

A water-less pool

I wasn’t able in my short time there to analyze the underground infrastructure. But if it is like everything else in Havana, I would assume that it, too, is crumbling. For example, contrary to what tourist brochures say, Havana’s tap water is considered undrinkable by locals, and I was routinely offered bottled water to avoid catching chlorida.

Indeed, the substandard nature of Havana’s built entities were so common that after awhile I stopped noticing. For example, when I attended a rainy futbol match at a renowned Havana stadium, I sat underneath a roof that leaked constantly, getting soaked alongside other fans. Can anyone imagine this being tolerated at a U.S. arena? When I used bathrooms even in nice establishments, I would find that there often weren’t toilet seats, door locks, or (you guessed it) toilet paper. Schoolyards had swimming pools without water and basketball hoops without rims. And on it went.

This is how life is in Havana. And I soon realized, given this, how buffoonish it would have been to go around looking for examples of “historic preservation.” Such preservation is an aesthetic notion from the First World, driven by those who are willing to pay more to retrofit attractive old housing. But in a city of extreme poverty, preservation is the pragmatic steps people take to prevent their roofs from caving in.

a public park...

and a public waterfront

So How Does Havana Compare To…San Francisco?

Have you ever read an article that was so hilariously wrong that you wanted to pick your laptop up and chuck it across the room? This was my reaction to one article I read several days after returning from Havana, with the city’s horrific conditions still on my mind. On June 8, MarketWatch.com published an article by columnist Therese Poletti called “New Tech Money Is Destroying The Streets Of San Francisco.” Poletti explained that a flood of wealthy executives were moving into San Francisco, buying old homes, and altering the interiors.

It is now hard to find a Victorian home for sale that has not been gutted, its architectural details stripped and tossed. And owners or developers — looking to sell at a premium in the frenzied real estate market to “techies with cash” — hope to appeal to the tastes (or lack thereof) of current buyers, by turning once-charming homes with detailed woodwork, built-ins and art glass, into clones of Apple’s minimalist retail stores.

This trend has been developing for several years, but it seems far more prevalent today, with construction sites sprouting across the Bay Area and especially in San Francisco. And in addition to the remodeling frenzy, older buildings appear to be disappearing at a scary pace.

Before even addressing Poletti’s point, let me just set the record straight: San Francisco is not being “destroyed.” I can testify from having lived there in 2012, and visiting several times more, that the city is an architectural gem that has largely stayed in character since being rebuilt after the 1906 earthquake. Much of the city—including almost the entire northeast portion—is an oasis of historic Italianate, Queen Anne, Craftsman, and Art Deco construction. These buildings roll along the hills flanked by clean, well-paved streets, and small, impeccably-landscaped yards. From a purely aesthetic standpoint, San Francisco surpasses any other major U.S. city, and perhaps any European one.

The reason for this is two-fold. San Francisco has expansive historic preservation laws that make it difficult or illegal to alter thousands of structures. Compelling arguments have been made that the city takes this preservationist impulse too far, to the detriment of adding new housing supply–although such laws help maintain its unique character. But the other factor—to which Poletti seems oblivious—is that the city has a large professional class with the financial wherewithal to maintain these homes.

I would argue that this second factor, more than the first, has preserved San Francisco. You could put a historic overlay designation across Detroit, and it wouldn’t change much. The Motor City suffers from decay because it has undergone six decades of depopulation, and this has left no one around to preserve its own large historic stock. But the Bay Area has been flooded with capital during this period, and this has strengthened its culture of preservation. Maintaining a historic home, after all, can be an expensive endeavor that requires ripping out floorboards, replacing pipes, and other structural changes. It is usually done by educated, well-off households who have either the money to fund repairs, or the time to dedicate sweat equity. Perhaps not every family preserves their homes precisely to Poletti’s specifications, and I don’t blame them, since it is difficult to live in a floor plan that was laid out a century ago. But she should not miss the broader point, which is that San Francisco has remained as it is because of the demographics it attracts.

Instead, she claims that these groups are “destroying” the city. She is thus spouting the same myth that is advanced about historic preservation by urban progressives, who seem to think that wealth and gentrification works against preservation. But a fair-minded look at U.S. cities demonstrates the opposite. If one looks at America’s most notable historic neighborhoods–the Back Bay in Boston; Capitol Hill in DC; the French Quarter in New Orleans; much of northern San Francisco; much of Manhattan and northern Brooklyn; downtown Savannah; and downtown Charleston–a unifying feature is that they have great residential wealth. Meanwhile, there are numerous cities—Baltimore, Philadelphia, Detroit, St. Louis, Cleveland—that have a similar number of historic structures. But many of them sit hollowed-out because of decline.

The same could be said when comparing Havana with Poletti’s San Francisco. Both cities have similar architecture and planning, but their differing economic histories have led to opposite preservationist destinies. Wealthy and growing San Francisco is a city where thousands of structures remain in superb shape, and where people grieve over minor alterations. Havana’s system has produced a crumbling city where the desire for preservation gets lost in a sea of basic needs. If Poletti really wants to see a “destroyed” city, she should visit the latter.

a public housing complex from the outside...

a public housing complex from the outside…


and from the inside.

and from the inside.


OLYMPUS DIGITAL CAMERA

OLYMPUS DIGITAL CAMERA

OLYMPUS DIGITAL CAMERA

OLYMPUS DIGITAL CAMERA

This piece originially appeared at Market Urbanism.

Scott Beyer is traveling the nation to write a book about revitalizing U.S. cities. His blog, Big City Sparkplug, features the latest in urban news. Originally from Charlottesville, VA, he is now living in different cities month-to-month to write new chapters.

Hooray For the High Bridge

$
0
0

My latest article is online in City Journal and is a look at the restoration and reopening of the High Bridge in New York City. Part of the original Croton Aqueduct system that first brought plentiful clean water to New York, portions of the High Bridge are the oldest standing bridge in the city. Here’s an excerpt:

It’s worth asking whether, with its $61 million price tag, the High Bridge project was really needed. Strictly speaking, the answer is: No. The structure was in no danger of falling down. And, just a half mile to the north, the Washington Bridge provides a functional, if unpleasant, pedestrian crossing over the Harlem River. Yet, the High Bridge is an important part of New York history and deserves its loving restoration. Spending serious money on outlying neighborhoods that are mostly minority and heavily poor to give their residents a humane environment instead of a minimalistic one shows that New York does care about all its citizens. Great cities don’t just do great things in a sanitized downtown Green Zone for visitors. They create greatness in their workaday neighborhoods, too, with projects that speak not merely to the pragmatic, but to the human spirit. The High Bridge restoration again shows what great commercial success allows a city to do for its citizens.

Click through to read the whole thing.

Here are some additional pictures I took. First, the High Bridge peeking through the trees from the Manhattan heights. You can see both the original stone arch spans and the longer steel arch span.


Looking south:


Embedded seal in the bridge pavement with historical info. There are quite a few of these discussing various aspects of the project.


The neighbors are fans:

Aaron M. Renn is a senior fellow at the Manhattan Institute and a Contributing Editor at City Journal. He writes at The Urbanophile, where this piece first appeared.

Australia’s Recipe for Urban Decay

$
0
0

Across federal, state, and local levels, Australian urban planning authorities have emphasized the need for policies that seek to limit urban fringe development and create densely-populated urban centers. This process is called ‘urban consolidation’ and has been a goal of Australian authorities for more than three decades. More specifically, urban consolidation is defined by efforts to concentrate housing, jobs, and amenities around “activity centers” such as a traditional downtown, satellite urban centers, and elongated strategic corridors. These high-density areas are to be separated by green belts of undeveloped land and connected by public transport links such as trains and light rail systems.

Australian planners’ efforts to establish a high-density urban form have been effective, at least from their point of view. From 1981 to 2011, housing stock in Sydney, Melbourne, and Brisbane saw a large shift towards high-density units. A net total of 640,000 new multi-unit dwellings were built during this time, representing an increase of over 115%. This surge forced the proportion of multi-unit housing to increase to nearly one-third of the total housing supply in cities that have historically been dominated by single-family dwellings.1

As Australia moves toward higher-density cities, what will be the result? Urban planners assert that their policy decisions are thoroughly researched and provide the “best” outcomes, but evidence from Australia’s largest cities tends to refute that claim. Among the numerous issues that arise due to consolidation ideology, perhaps the most disturbing are the severe impacts on housing affordability, poverty, and housing quality.

Urban consolidation policies, by definition, are aimed at choking the supply of new single-family detached housing by limiting urban fringe growth as a means of minimizing the urban footprint. This is intended to drive more and more of the urban population into compact living situations. Thus, by limiting the supply of single-family detached housing and pushing more households into the market for multi-family housing, urban consolidation causes home prices to rise in both markets. As Figures 1 through 5 show, this is exactly what has happened in cities that adopt consolidation ideology. The Australian Bureau of Statistics reports that “the price of established houses in the capital cities rose by almost half (46%) between 2002-03 and 2008-09, with prices increasing at an average of 6.5% per year.”2 From 2001 to 2011, the number of dwellings in Sydney costing less than AUD $275 in rent per week decreased by 52% while the number of dwellings costing more than $275 in weekly rent surged by 269%; in Melbourne, the number of dwellings that cost at least $650 per week in rent more than tripled. Homeowners in Sydney and Melbourne have also seen tremendous increases in mortgage payments. In the same ten-year period, there was a seven-fold increase in the number of households in Sydney and Melbourne paying more than $4,000 per month in mortgage payments, while the number of households paying less than $1,000 per month was cut in half.3 At a time when wages and income have been stagnant, this means a severe decrease in housing affordability, meaning fewer Australians are able to afford the highly sought-after stability of homeownership.

Given the profile of buyers and sellers, the market for dense multi-family housing is predominantly driven by investors, landlords, and institutional property owners.4 Thus the large majority of occupants are renters, not owner-occupiers, and there is no reason to infer that this ownership pattern will change.  As Australian cities continue to densify, ownership demand – that is, the market for the purchase and sale of housing units – will be driven less by owner-occupiers and more by investors and landlords, who have historically been the dominant players in multi-unit dwelling markets. This latter group of owners responds to market conditions in a different way than the owner-occupier group, and the shift is likely to have a profound impact on economic and socio-political outcomes in the long-term.

In housing markets, there are two groups of consumers: investors, who intend to lease the units after buying, and owner-occupiers, who intend to live in the residences themselves. Owner-occupiers purchase homes for personal consumption; their decision about which home to buy is driven by the quality of the housing, access to transportation and employment, amenities in the surrounding area, and the sense of financial stability provided by owning one’s own home. Investors, on the other hand, are quite different. By definition, investors are driven by profit. They are seeking rental income from tenants as well as appreciation in the value of both the property and the underlying land. They evaluate properties based on the potential cash flows from renting and the price they can receive when they sell the property sometime in the future.

But investors’ motives may become distorted in Australia due to a policy known as ‘negative gearing.’ Negative gearing, in terms of real estate investment, allows any negative cash flow from a single property to be deducted from the investor’s total taxable income.5 This gives investors   an incentive to purchase properties where the mortgage payments exceed rental income, especially if value of the property is appreciating. This pushes up the after-tax returns to investors which inflates housing prices even further. It also provides investors with greater incentive to make speculative purchases, which increases home price volatility and instability.

What happens when you throw urban consolidation policies into the mix? As urban planners continue to choke the supply of new land, the price of existing land continues to accelerate upward. When investor profits are increasingly driven by speculating on the land value rather than income from the tenants, investors are more inclined to purchase lower-value properties which require less maintenance and fewer capital expenditures yet enjoy the same increases in underlying land value. By this logic, we could expect that low-income housing would increase in value at a faster pace than higher-quality housing as investors bid up the prices, which is exactly what happened in Sydney’s last real estate boom.6 Low-value properties are also more likely to provide investors with the support of negative gearing since they typically provide the lowest rental revenues. But investors, looking primarily at tax advantages, are less likely to improve the properties or even maintain existing structures. Thus, we can see how more and more investors not only have the incentive to compete for low-value housing units, where there is already insufficient supply, but also neglect those units in the long-term. Such market pressures are already noticeable in Sydney and Melbourne, where urban consolidation has been occurring for a longer time, and will certainly arise in Brisbane, in the state of Queensland, as planners establish growth boundaries for its booming population.7

But it doesn’t stop there. This problem is exacerbated by the nature of Strata title plans, which have come to dominate the market for higher density housing in Australia. Essentially, strata titling comes from legislation passed in the 1960s whereby each apartment unit or flat on a parcel of land can be owned individually, and thus a mortgage could be taken out in order to purchase individual high-density housing units. This is similar to a condominium ownership structure in the United States, but with a few key shortcomings. Although strata titling allows a few individuals living in high-density areas to enjoy homeownership, it primarily benefits investors who now only have to purchase single units instead of entire multi-family buildings. Even worse, strata titling’s lack of consideration for common areas poses a serious issue in the long run for the maintenance of high-rise buildings and their surrounding neighborhoods, especially in areas of lower income. According to Bill Randolph, Director of the City Futures Research Center at the University of New South Wales, “the strata system may come badly unstuck in lower value areas where investor landlords have little incentive to reinvest in their property and home owners do not have the wherewithal to afford major repair costs.”8

Putting it all together, what can we expect to be the future for Australia? Urban consolidation policies continue to push more Australians out of suburban homes and into cramped apartments, where housing markets are dominated by investor-landlords instead of owner-occupiers. The consolidation policies will squeeze the supply of land and force dwelling prices to rise regardless of rental revenue, promoting speculative behavior among investors. Negative gearing and strata titling programs incentivize these investors to neglect their properties, causing high-density areas (especially low-income neighborhoods) to deteriorate. The end result is slum-like conditions, social tension, and perpetual poverty for the neighborhood’s inhabitants. Even in higher-value neighborhoods, a lack of necessary upkeep will erode housing quality, even as prices continue to inflate. This is the reality of urban consolidation; it takes ownership out of the hands of Australians and puts it in the hands of speculative and neglectful investor-landlords. It is nothing short of a recipe for urban decay.

Clinton Stiles-Schmidt graduated magna cum laude from Chapman University where he earned a Bachelor of Science in Business Administration (emphasis in Real Estate and Finance) and a Bachelor of Arts in Economics. His experience includes several internships in real estate investment and development as well as studying abroad in both Spain and Australia. Clinton recently joined Cushman & Wakefield as an Analyst in their Corporate Finance & Investment Banking Group.


Figure 1: Ratio of Housing Debt to Disposable Income in Australia9

Figure 2: Weekly Rent Payments in Sydney10


Figure 3: Monthly Mortgage Payments in Sydney11

Figure 4: Weekly Rent Payments in Melbourne12


Figure 5: Monthly Mortgage Payments in Melbourne13


1"Community Profiles." ABS Census 1986-2011. Australian Bureau of Statistics, 1 Oct. 2014. http://www.abs.gov.au/websitedbs/censushome.nsf/home/communityprofiles.

2"Measures of Australia's Progress, 2010." Australian Bureau of Statistics, 15 Sept. 2010. http://www.abs.gov.au/ausstats/abs@.nsf/Lookup/by%20Subject/1370.0~2010~Chapter~House%20prices%20(5.4.4.1)

3"Community Profiles." ABS Census 1986-2011. Australian Bureau of Statistics, 1 Oct. 2014. http://www.abs.gov.au/websitedbs/censushome.nsf/home/communityprofiles.

4 Randolph, Bill. "Delivering the Compact City in Australia: Current Trends and Future Implications." City Future Research Centre, University of New South Wales, 1 June 2006.

5 Koulizos, Peter. "How Negative Gearing Works." The Realestate.com.au Blog. Realestate.com.au, 21 Oct. 2013. http://www.realestate.com.au/blog/how-negative-gearing-works/.; "Real Estate." Australian Tax Office. Australian Government, 22 Jan. 2013. https://www.ato.gov.au/General/Capital-gains-tax/In-detail/Real-estate/

6 Hill, Robert J., Daniel Melser, and Iqbal Syed. "Measuring a Boom and Bust: The Sydney Housing Market 2001–2006." Journal of Housing Economics 18.3 (2009): 193-205. ScienceDirect. Web. http://www.sciencedirect.com/science/article/pii/S1051137709000321

7 Yu, Xiaojiang. "‘The Great Australian Dream’ Busted on a Brick Wall: Housing Issues in Sydney." Cities 22.6 (2005): 436-45. ScienceDirect. Web. http://www.sciencedirect.com/science/article/pii/S0264275105000879 ; Stimson, Robert J., and Shane P. Taylor. "City Profile: Brisbane." Cities 16.4 (1999): 285-95.ScienceDirect. Web. http://www.sciencedirect.com/science/article/pii/S0264275199000104

8 Randolph, Bill. "Delivering the Compact City in Australia: Current Trends and Future Implications." Urban Policy and Research 24.4 (2006): 473-90. City Futures, June 2006. Web. https://www.be.unsw.edu.au/sites/default/files/upload/researchpaper6.pdf

9"RBA: Statistical Tables." Reserve Bank of Australia, 26 Sept. 2014. http://www.rba.gov.au/statistics/tables/.

10"Community Profiles." ABS Census 1986-2011. Australian Bureau of Statistics, 1 Oct. 2014. http://www.abs.gov.au/websitedbs/censushome.nsf/home/communityprofiles.

11 Ibid.

12 Ibid.

13 Ibid.

Sydney suburb photo by BigStockPhoto.com.


Commuting in London

$
0
0

According to the 2011 census, the London commuter shed --- defined here as the of London (the Greater London Authority, or GLA) and the East and Southeast regions of England --- had a 2013 population of 23.2 million, spread over an area of 15,400 square miles (39,800 square miles).

For this analysis, the area is divided into five parts, including the central business district (CBD), the balance of Inner London, Outer London, the inner counties, which are largely adjacent to London and the outer counties. Counties are largely only ceremonial at this point and used for geographical convenience. In many counties, unitary local authorities have been established that replace part or all of the previous county geographic authority.

The central business district is situated in a wide corridor on both sides of the Thames River. It is contained in five local authority areas, including the city of London, the city of Westminster and the boroughs of Camden, Southwark and Lambeth. All of central London's eight largest rail stations are in these five areas, and central business district commuters rely to a substantial degree on its suburban rail system.

Inner London roughly corresponds to the London County Council area as it existed before creation of the Greater London Council (GLC) in 1965. Outer London includes the boroughs that were added in the establishment of the GLC which was abolished in 1986. A new, London authority (the GLC) was created  in 2000, with a considerably scaled back portfolio of responsibilities, principally transport, police, fire, emergency services and planning. GLA has 33 local authorities, 32 of which are popularly referred to as boroughs, plus the City of London (the one square mile historic core). The local authorities which are responsible for a many local public services, and constituted London's only local government between 1986 and 2000.

The inner counties border on the metropolitan greenbelt, which surrounds London (Note). They are Berkshire Buckinghamshire, Essex, Hertfordshire, Kent and Surrey. The outer counties are Cambridgeshire, East Sussex, Hampshire, Isle of Wight, Norfolk, Oxfordshire, Suffolk and West Sussex.

Distribution of Employment

As of the 2011 census, the local authority areas containing the central business district had approximately 1.4 million jobs, or approximately 15 percent of the jobs in the London area. The rest of GLA, including the balance of inner London and Outer London has 25 percent of the employment. The outer counties have the largest number of jobs, at 2.7 million, comprising 30 percent of London area employment. The inner counties have nearly as many jobs, at 2.6 million, or 29 percent of employment. Thus, the suburban areas outside the Greenbelt have nearly 60 percent of the London area employment (Figure 1).

Where People Live and Work

The local authority areas containing the CBD have the greatest imbalance between resident workers and jobs. There are 3.35 jobs for each resident worker in these areas. The ratio of jobs to resident workers is much closer in the balance of Inner London, with a ratio of 1.04 jobs per employee. The least balanced is Outer London, with only 0.73 jobs per employee. The inner counties have the second highest ratio, at 0.93 jobs per employee. Surprisingly, the outer counties have the ratio closest to 1.00, at 0.99 jobs per employee (Figure 2). This parallels our findings of America’s only city with anything like London’s pedigree, New York.

Most employees work in the sector of their residence. About 65 percent of CBD local authority area residents work in the CBD area (Figure 3). Outside-the-greenbelt commuters work in their own sector to a greater degree. In the outer counties 88 percent work in their home sectors, while 75 percent of inner counties commuters work in their own sectors. The balance of Inner London has the lowest percentage of employees working in their own sectors (41 percent), while Outer London is somewhat higher, at 50 percent.

Commuting to Central London

Despite its strong CBD, the London area is anything but monocentric. Approximately 85 percent of London area jobs are outside the central business district. Yet London comparative data from nearly two decades ago placed London's CBD at fourth largest in the world, trailing Tokyo, New York and slightly behind Osaka. With London's strong economic growth since that time, London has probably passed Osaka, which has faced more difficult economic times.

The overwhelming majority of jobs in the London CBD are filled by GLA residents, with more than 75 percent of commuters living in the balance of Inner London or Outer London (Figure 4). This leaves only a quarter living in the exurban areas beyond the greenbelt. Approximately 17 percent of CBD commuters travel from the inner counties, adjacent to the Greenbelt. Only 5 percent travel from the outer counties. Less than three percent of CBD commuters travel from beyond the London area, which may be surprising given the plentiful higher speed (as opposed to genuine high speed) rail services.

How Commuters Travel

More than half of Londoners commute to work by car or other light vehicles (including car pools). Transit accounts for about a quarter of commuting, while about 10 percent of commuters walk to work. Approximately six percent usually labor mainly at or from home (Figure 5).

Among mass transit commuters, suburban rail systems account for the largest share, at 37 percent, underground (metro) and light rail 33 percent and buses 30 percent. Over the past three decades there has been a substantial increase in bus ridership, principally from expanded services financed with savings from competitive tendering (also called competitive contracting) and additional services added later in conjunction with London's inner congestion pricing zone. Competitive contracting involves use of competitively selected private companies to operate services. London's "red bus" system --- which is fully integrated in its fare, route structure and vehicle livery with its many double deck buses is virtually all operated by the private sector through competitive tendering.

Minicentric London?

In some ways, London is one of the world's most dispersed cities, largely due to the discontinuous development encouraged by the greenbelt. The greenbelt imposes a substantial distance penalty for commuters from the inner and outer counties to the CBD, whether by car or train. This is in considerable contrast to Western Europe's other megacity, Paris, which is far more compact in its metropolitan development, despite having a considerably weaker CBD. London also demonstrates that the age of the monocentric metropolitan area is largely a thing of the past in high income world cities. With less than one-sixth of metropolitan employment in the CBD, "minicentric" might be a more accurate characterization.

Note: Housing development is prohibited on the metropolitan greenbelt, which surrounds London (GLA). The metropolitan greenbelt covers three times the land area of the GLA. Virtually all population growth over the past 85 years in the London area has occurred outside the greenbelt. The inner and outer counties have added more than 7 million residents over the since the 1931 census, while London itself has added approximately 500,000 residents.

The metropolitan is a cornerstone of London's urban containment policy, which also applies throughout the United Kingdom. Housing development is banned on the greenbelt and the U.K.'s urban containment policy has been associated with a substantial rise in house prices relative to incomes (see: The Barker Review of Housing Supply, the Barker Review of Land Use Planning and The Costs of Smart Growth: A 40 Year Perspective).

Wendell Cox is Chair, Housing Affordability and Municipal Policy for the Frontier Centre for Public Policy (Canada), is a Senior Fellow of the Center for Opportunity Urbanism (US), a member of the Board of Advisors of the Center for Demographics and Policy at Chapman University (California) and principal of Demographia, an international public policy and demographics firm.


He is co-author of the "Demographia International Housing Affordability Survey" and author of "Demographia World Urban Areas" and "War on the Dream: How Anti-Sprawl Policy Threatens the Quality of Life." He was appointed to three terms on the Los Angeles County Transportation Commission, where he served with the leading city and county leadership as the only non-elected member. He served as a visiting professor at the Conservatoire National des Arts et Metiers, a national university in Paris. 

Photo: Traffic in London (by author)

Where Do We Still Make Stuff in America?

$
0
0

The deindustrialization of the United States has been widely considered to be a major force in shaping the economy. It’s one thing to measure where decline has been greatest but where has manufacturing survived or even grown? I use Bureau of Labor Statistics data on manufacturing jobs by county for 1967 and 2014. The results were so surprising that I at first could not believe it.

In 1967 the US had 19,423,000 manufacturing jobs, 25% of an employed labor force of 76 million, while in 2014 there were 11,900,000 such jobs, constituting only 8.3 % (that is one-third of the 1967 share). Almost 12 million is still a lot of jobs, and higher productivity probably means that the sheer amount of stuff produced may not have fallen, but the role of manufacturing in employment has certainly shrunk and as we shall see, greatly relocated.

I reproduce a large table, because it is so interesting, indeed so astounding. There are three sections, first counties  with over 25,000 manufacturing jobs in 2014 ( there were far more in 1967), then counties with over 50,000 jobs in 1967, but under 25,000 in 2014,  and third, a few counties with over 4000 manufacturing jobs in 2014, and where these were a high share (over 40%) of the local labor force. These were the some of the winners from geographic relocation.  I also map these changes. The maps include three additional sets of counties: counties with between 10 and 25,000 jobs in 2014, counties with between 25 and 50,000 jobs in 1967, and counties from 33 to 40% in manufacturing in 2014.  These groups are summarized in Table 1.


Table 1: Manufacturing Change 1967-2014 (Measured in 1,000s)
Set# of CountiesCharacter2014 jobs%1967 jobs%Change%% Change
1A
19
> 25k in 2014, gain1,10271838554
1B
50
> 25k in 2014 loss2,6166,698-4,082-61
2
26
> 50k in 19674352,828-2,403-85
3 & 6
58
> 33% manuf in 201434323211148
4A
65
10 to 25K in 2014, gain1,16468248271
4B
71
10 to 25k in 2014, loss1,0181,909-841-44
5
26
25 to 50k, 19673551,029-674-66
Mapped
315
7,0836013,55570-6,47287-48
Unmapped
2,835
4,822405,75830-97613-17
US
3,170
ALL11,90019,323-7,423-38


The 315 mapped counties include 60% of the 2014 manufacturing jobs and some 70% of the jobs in 1967. It is evident that the counties with high numbers of manufacturing jobs in 1967 bore the brunt of losses from 1967 to 2014. In contrast,   the smaller, mostly unmapped counties lost only modestly as a set. Many larger counties did gain or hold steady, largely outside the traditional manufacturing belt of the north, or from older core counties into new growing suburbs, as we shall see.  Since the losses in the larger mapped counties are so much higher a share of the total jobs in 1967 than in 2014, we have a yet stronger indication of de-concentration.

I’ll begin with the biggest losers, who are on table 2.  Now New York City may be thriving in 2014, but it has utterly transformed from an industrial dominance to a minor backwater -- the four boroughs dropping their industrial employment from almost 900,000 to a paltry 67,000 jobs, a drop of 92.5%.  In New York County (Manhattan) the fall was even more precipitous: 96%. This is not a misprint. Do not turn off your computer! These are joined by an 84% decline for the New Jersey suburbs: 416,000 to 65,000.  Philadelphia, greater Boston, St. Louis, and, yes, especially Baltimore, city and county, experienced the same kind of precipitous decline. Can we begin to understand the basis for riot and unrest in these core cities, whose manufacturing departed as soon as integration opened manufacturing jobs to black workers! As a set, these counties lost 2.83 million manufacturing jobs, a drop of 85%.


Table 2
Set 1:  More than 25,000 Manufacturing Jobs in 1967
County Manuf Jobs 1967Manuf Jobs 2014Change% Change
United States19,323,00011,900,000-7,423,000-38.2
Snohomish County, Washington16,00060,15644,156276.0
Harris County, Texas123,000164,47941,47933.7
San Diego County, California64,00097,34633,34652.1
Maricopa County, Arizona59,30091,34832,04854.0
DuPage County, Illinois24,50053,91329,413120.1
Riverside County, California17,00041,51924,519144.2
Orange County, California126,000150,02024,02019.1
Waukesha County, Wisconsin20,00043,23223,232116.2
Elkhart County, Indiana31,30053,70522,40571.6
Salt Lake County, Utah26,00046,40220,40278.5
San Bernardino County, California30,00046,82216,82256.1
Washington County, Oregon12,00027,91915,919132.7
Ottawa County, Michigan16,00031,83115,83198.9
El Paso County, Texas19,00031,00012,00063.2
Pinellas County, Florida18,00028,30510,30557.3
Fresno County, California15,50025,2699,76963.0
Bexar County, Texas26,00030,4744,47417.2
Suffolk County, New York49,00051,9672,9676.1
Newport News city, Virginia25,00026,5031,5036.0
Sum of gaining counties717,6001,102,210384,61054.0
Tulsa County, Oklahoma39,00037,197-1,803-4.6
Kent County, Michigan60,00057,371-2,629-4.4
Tarrant County, Texas76,00070,421-5,579-7.3
Lake County, Illinois41,00035,174-5,826-14.2
Kane County, Illinois39,00030,327-8,673-22.2
Bucks County, Pennsylvania40,00027,061-12,939-32.3
Greenville County, South Carolina41,00026,782-14,218-34.7
Hillsborough County, New Hampshire40,00025,287-14,713-36.8
Sedgwick County, Kansas56,00040,629-15,371-27.4
Alameda County, California80,00063,679-16,321-20.4
Multnomah County, Oregon49,00032,206-16,794-34.3
Santa Clara County, California120,000100,981-19,019-15.8
York County, Pennsylvania51,00031,890-19,110-37.5
Lancaster County, Pennsylvania54,00033,212-20,788-38.5
Guilford County, North Carolina54,00032,428-21,572-39.9
Winnebago County, Illinois49,00025,024-23,976-48.9
Berks County, Pennsylvania56,00029,439-26,561-47.4
Miami-Dade County, Florida58,00030,387-27,613-47.6
Macomb County, Michigan94,00059,114-34,886-37.1
Hennepin County, Minnesota109,00072,307-36,693-33.7
Dallas County, Texas138,00094,078-43,922-31.8
Oakland County, Michigan94,00047,243-46,757-49.7
Franklin County, Ohio76,00028,991-47,009-61.9
Jefferson County, Kentucky90,00040,666-49,334-54.8
Bristol County, Massachusetts78,00026,935-51,065-65.5
Middlesex County, New Jersey82,00028,277-53,723-65.5
Essex County, Massachusetts94,00038,451-55,549-59.1
Jackson County, Missouri85,00025,870-59,130-69.6
St. Louis County, Missouri97,00035,884-61,116-63.0
Summit County, Ohio93,00027,965-65,035-69.9
King County, Washington146,00079,631-66,369-45.5
Montgomery County, Pennsylvania106,00039,566-66,434-62.7
Hamilton County, Tennessee95,00025,092-69,908-73.6
Bergen County, New Jersey107,00033,434-73,566-68.8
Marion County, Indiana120,00042,808-77,192-64.3
New Haven County, Connecticut115,00031,792-83,208-72.4
Montgomery County, Ohio110,00026,188-83,812-76.2
Erie County, New York134,00042,606-91,394-68.2
Hartford County, Connecticut151,00057,332-93,668-62.0
Monroe County, New York133,00038,958-94,042-70.7
Fairfield County, Connecticut130,00035,507-94,493-72.7
Hamilton County, Ohio152,00045,901-106,099-69.8
Middlesex County, Massachusetts166,00059,454-106,546-64.2
Worcester County, Massachusetts165,00034,677-130,323-79.0
Milwaukee County, Wisconsin181,00048,963-132,037-72.9
Allegheny County, Pennsylvania195,00036,428-158,572-81.3
Cuyahoga County, Ohio277,00069,606-207,394-74.9
Wayne County, Michigan396,00071,526-324,474-81.9
Los Angeles County, California855,000359,532-495,468-57.9
Cook County, Illinois831,000181,315-649,685-78.2
Sum of losing counties6,698,0002,615,592-4,082,408-61.0
Table 2, set 2: Over 50,000 in 1967 and Under 25,000 in 2014
  Manuf Jobs 1967Manuf Jobs 2014Change% Change
BronxNY59,0006,000-53,000-89.8
KingsNY220,00018,000-202,000-91.8
OnondagaNY59,00019,000-40,000-67.8
QueensNY132,00022,000-110,000-83.3
WestchesteNY73,00012,000-61,000-83.6
New York,  NYNY482,00021,000-461,000-95.6
LucasOH62,00016,000-46,000-74.2
StarkOH63,00023,000-40,000-63.5
PhiladelphiaPA264,00023,000-241,000-91.3
ProvidenceRI93,00022,000-71,000-76.3
FultonGA65,00018,000-47,000-72.3
NwcastleDE53,00013,000-40,000-75.5
LakeIN98,00023,000-75,000-76.5
BaltimoreMD68,00011,000-57,000-83.8
BaltimoecityMD107,00012,000-95,000-88.8
HampdenMA65,00021,000-44,000-67.7
NorfolkMA58,00021,000-37,000-63.8
SuffolkkMA85,0008,000-77,000-90.6
RamseyMN72,00023,000-49,000-68.1
EssexNJ124,00018,000-106,000-85.5
HudsonNJ107,0008,000-99,000-92.5
PassaicNJ83,00018,000-65,000-78.3
UnionNJ102,00021,000-81,000-79.4
StLouis cityMO132,00017,000-115,000-87.1
San FranciscoCA52,1007,500-44,600-85.6
DelawarePA59,60013,000-46,600-78.2
2,837,700434,500-2,403,200-85
Table 2, set 3: High Manufacturing Share, Over 4,000 Jobs
Manuf Jobs 1967Manuf Jobs 2014Change% Change
Jackson County, Alabama3,2005,1961,99662.4
Boone County, Illinois8,3007,619-681-8.2
DeKalb County, Indiana4,2008,1283,92893.5
LaGrange County, Indiana1,2005,1413,941328.4
Noble County, Indiana4,7008,3513,65177.7
Whitley County, Indiana2,0004,5412,541127.1
Marion County, Iowa1,4006,1284,728337.7
Ford County, Kansas1,0006,2725,272527.2
Pontotoc County, Mississippi1,1006,1995,099463.5
Scott County, Mississippi2,0004,8832,883144.2
Alexander County, North Carolina2,6003,28468426.3
Bladen County, North Carolina1,0005,5654,565456.5
Auglaize County, Ohio5,3007,3392,03938.5
Shelby County, Ohio7,90010,0522,15227.2
Williams County, Ohio5,9006,3374377.4
Elk County, Pennsylvania9,4006,587-2,813-29.9
Newberry County, South Carolina3,7004,8311,13130.6
Titus County, Texas8005,8655,065633.1
Box Elder County, Utah2,3006,2063,906169.8
Trempealeau County, Wisconsin1,2006,4185,218434.8
69,200124,94255,74280.0


The first set of counties include some winner and more losers.   The winners grew from 718,000 to 1,102,000 jobs, or up 54%, but this is dwarfed by the colossal loss of 4.1 million out of 6.7 million jobs, a loss of 61% in manufacturing jobs.  The losers are somewhat like set 2, just not quite so extreme. Included are the two counties which lost the most—Cook (Chicago) and Los Angeles-  650,000 and 500,000!  Other big losses include Wayne (Detroit), 324,000, Cuyahoga (Cleveland), 207,000, Milwaukee, 132,000, Hamilton (Cincinnati), 106,000, Allegheny (Pittsburgh), 159,000, and Worcester, MA, 136,000.  

The gaining larger counties are the beneficiaries of two forms of de-concentration – from the north to the south and west, and from older core counties to their suburbs.  Growing industrial centers in the south and west include Harris (Houston), San Diego, Maricopa (Phoenix), Fresno, Bexar (San Antonio),  Salt Lake, and Pinellas, FL (St. Petersburg), but as or more important is the growth of suburbs, notably Orange, CA, Suffolk, NY (way out there), San Bernardino-Riverside, Waukesha, WI, Washington, OR, and the biggest winner of all, Snohomish, WA, where Boeing builds big jets, and the home of the late Senator Henry Jackson. This leaves two growing smaller metro areas of the north: Ottawa, MI, and Elkhart, IN, one of the fastest growing and most successful examples of manufacturing and income growth.

Sets 1 and 2 represent the larger manufacturing cores of 1967, 2014 or both. But in 1967 they held 57% of all manufacturing jobs, while in 2014, their share dropped to 35% (10.3 million versus 4.2 million), again illustrating the basic geography of de-concentration.

Sets 3 and set 6 counties, with high manufacturing shares in 2014, include many successful micropolitan or suburban counties in all regions. A few counties with high manufacturing shares in 2014 are suburban, often to smaller metropolitan areas, e.g. Scott, KY, (Lexington). Many more are exurban to medium sized metro areas, as to Springfield, MO, Raleigh, NC, Des Moines, IA or Jackson, MS, and especially 3 counties in northeastern IN, in exurban territory beyond Ft. Wayne and Elkhart.

Some success stories are in more remote small town areas, as AL, AR, TN, MO, OH, SD, NC, SD, TX, and KS, for example, Ford County (Dodge City) and McPherson (Hutchinson Space Center).   

Set 4 counties, with 10,000 to 25,000 manufacturing jobs in 2014, again include both losers (71 counties, losing 841,000 jobs, or 44%) and winners, gaining 682,000 jobs, or 71%.  Losses are not so severe as for the sets 1, 2, and 5 counties, but are still significant, as in PA, 6 more counties, OH, 3 more, NJ, 3 more, MI, 3 more, and 1 each in MN, CT, IN, KS, CO (Denver), and also several in the south, as in AL (Jefferson-Birmingham), TN, (Shelby-Memphis) and Knox, and NC, 2 counties.

Counties gaining the most include 6 TX counties, Travis (Austin), 2 Houston suburbs, 2 Dallas suburbs, and Potter (Amarillo), 5 CA counties, Kern and Merced in the central valley, and suburban Sonoma, Ventura and Napa, 3 Atlanta suburban counties, 3 UT counties, suburban or exurban to Salt Lake, 2 in CO, Weld (Greeley) and Larimer (Ft. Collins), 2 in LA, and in OH (exurban and small town in the west of the  state). Thus almost all are large metro suburbs or smaller independent metro counties. From the list it is clear that these counties well represent the twin trends of suburban-exurban spillover or relocation, as well as the broader de-concentration from the north to the south and west.        

Several set 5 counties, 25,000 to 50,000 jobs in 1967, are also in the set 4 list (10,000 to 25,000 job in 2014), often with significant losses. Some with even higher losses, to under 10,000 manufacturing jobs in 2014, include counties in IL, IN, LA (Orleans), MI, NJ, NY (4 more), and PA (4 more).

What do the maps tell us?

The preceding discussion has probably induced the curious reader to peruse the maps to find places of decline versus growth. The maps show data for only 10 percent of US counties, 315 of 3170.  Yet these contained 70% of manufacturing jobs in 1967, and 60% in 2014.

The 1967 and 2014 maps of jobs in manufacturing depict the broad distribution of loss. Although the sheer density and size of places in the traditional industrial belt of the north stand out, a few big losses in the west, notably Los Angeles and San Francisco, appear. But the rests of the south, the plains and the west suggest a widespread if modest expansion, often in proximity to larger declining counties.

The pattern of change from 1967 to 2014 displays the patterns of change in numbers and rates of growth versus decline.  Losses are largest and almost continuous from Detroit east to Boston, while in the south, the Midwest and west, the big losers are in older, long standing large centers, Like, LA, SF, New Orleans, St. Louis, Minneapolis, Chicago, Cincinnati, and Indianapolis. These are interspersed with growing centers of manufacturing in TX, across the west, but also quite prominent in suburban and exurban and new industrial places in the south and Midwest, e.g. MS, AL, GA, TN, LA and AR,  but in substantial numbers in different areas of OH, IN, MI, WI, IL and MN, KS and MO. While the growth in the burgeoning west and TX might be an expected product of sheer population, and located both in suburbs, as around LA, SF, Portland and Seattle, much was in new independent place such as Boise, Phoenix, Tucson, Salt Lake, Greeley and Ft. Collins, Reno and Las Vegas. In contrast, a pattern of core decline but impressive suburban-exurban growth occurred in parts of the Midwest, in MI, IN, OH, WI, MN, and MO.

Conclusion

Yes, the decline of manufacturing as a dominant part of the labor force is large and rea. But America still makes a lot of stuff, much in quite different places, so that there is no longer a distinctive industrial belt, but in a more dispersed pattern. Many of the older centers of manufacturing, like NY, Boston, Philadelphia, and Chicago and Los Angeles, have long since transformed into world centers of services, while others, like Pittsburgh, Detroit and Cleveland appear to be in a process of transformation.

Some may view this transformation and the huge decline in manufacturing jobs as a benign market effect in which the US specializes in services while much of making things is out-sourced to lower cost countries. But in much of the real America far too few equivalent middle class jobs have replaced the lost jobs. Perhaps what the US needs now is serious innovation in making new kinds of things, and bring manufacturing up to 19 million and beyond! Instead I suspect the ever-wise market will innovate with robots, presaging a time when the country will complete its transformation to an owner and servant society.

Richard Morrill is Professor Emeritus of Geography and Environmental Studies, University of Washington. His research interests include: political geography (voting behavior, redistricting, local governance), population/demography/settlement/migration, urban geography and planning, urban transportation (i.e., old fashioned generalist).

Who Should Immigration be Helping?

$
0
0

Recent revelations about the firing of American tech workers and their replacement by temporary visa holders reveal, in the starkest way, why many Americans are wary of the impact of untrammeled immigration. Workers in American companies have been removed from their jobs not because they could not perform them, but because their replacements, largely from India, are simply cheaper and, likely, more malleable.

The H-1B temporary visa program was purportedly designed to help tech firms hire specialized talent to fill needs not adequately addressed by the U.S. labor market. But what it has really become is a way to lay off workers for cheaper ones.

Silicon Valley’s Phony War

A looming shortage of domestic tech talent has long been a siren song played in Silicon Valley by grandees such as Facebook’s Mark Zuckerberg. It is common to hear them claim the visa program must be expanded for them to compete.

Immigrant entrepreneurs and technical staff are hugely important, but the notion about “shortages” of IT workers is dicey at best. A 2013 report from the labor-aligned Economic Policy Institute found that the country is producing 50 percent more IT professionals each year than are being employed. EPI estimates “guest workers” now account for one-third to one-half of all new IT job holders, much of them through contracts with Infosys and Tata Consultancy Services, both based in India. These two firms, according to EPI, have cost over 12,000 U.S. workers their jobs this year alone.

Read the entire piece at The Orange County Register.

Joel Kotkin is executive editor of NewGeography.com and Roger Hobbs Distinguished Fellow in Urban Studies at Chapman University, and a member of the editorial board of the Orange County Register. He is also executive director of the Houston-based Center for Opportunity Urbanism. His newest book, The New Class Conflict is now available at Amazon and Telos Press. He is also author of The City: A Global History and The Next Hundred Million: America in 2050. He lives in Orange County, CA.

Photo by telwink

Some Kindly Advice From an Old White Guy

$
0
0

Last month I bought an old fixer-upper for $15,000 in Cincinnati. It was originally offered at $17,000, but I got the sellers down a bit. The place is a complete disaster. All the copper pipes and wires have been stripped out of the building. It hasn’t seen paint for decades. Every window and door needs to be replaced. The roof is shot. There’s no insulation of any kind. The yard is a mess. And there are plenty of similar houses in the neighborhood. So why exactly did I buy it? I’ll get to that in a minute.


Screen Shot 2015-06-20 at 2.39.06 PMGoogle

Screen Shot 2015-06-20 at 3.43.32 PMGoogle

Screen Shot 2015-06-20 at 2.51.09 PMGoogle

But first I want to relate a conversation I had with a contractor this morning. He’s an older man who lives in the distant suburbs and has very definite opinions about the city. He spoke to me in a kindly grandfather voice. “Do you understand where this house is? Do you know what kind of people live there?” He used some colorful language which I won’t repeat. Let’s just say he’s a white guy of a particular generation from the South… He advised me to take the money I’m about to spend renovating the house and use it to buy a nice big new home on a good sized piece of land across the river in Kentucky instead.

If this were 1980, or 1990, or 2000 this man’s recommendation would have been entirely valid from an economic perspective. Inner city neighborhoods all over the country were hemorrhaging population, jobs, and revenue for decades. It would have been a disastrous investment. But times have changed. Not everyone has noticed.

Screen Shot 2015-06-20 at 1.15.34 PMGoogle

Screen Shot 2015-06-20 at 1.16.17 PMGoogle

Screen Shot 2015-06-20 at 1.11.49 PMGoogle

Screen Shot 2015-06-20 at 1.12.31 PMGoogle

Screen Shot 2015-06-20 at 2.12.12 PMGoogle

Screen Shot 2015-06-20 at 2.12.43 PMGoogle

Screen Shot 2015-06-20 at 2.19.56 PMGoogle

Screen Shot 2015-06-20 at 2.20.21 PMGoogle

Here are some before and after photos of buildings in the immediate neighborhood curtesy of Google Street View. Since the Google van has driven by a few times in the last decade it’s possible to see the same buildings from the perspective of different years. People have consistently been buying up cheap run down properties, fixing them up, and incrementally improving the neighborhood. This is no longer a place of permanent decline and disinvestment. The area hit bottom a few years back and it’s already on the way back up. It’s not entirely there yet, but it’s well on its way.

Screen Shot 2015-06-20 at 1.17.02 PMGoogle

Screen Shot 2015-06-20 at 1.17.35 PMGoogle

In addition to recently renovated older buildings, vacant lots are sprouting quality new construction. These two homes are LEED certified for energy efficiency.

Screen Shot 2015-06-20 at 2.30.02 PMGoogle

GantryUAV21gantrylife.com / bayerbecker.com

CornerView copy1_0csoinc.net / bayerbecker.com

A few blocks away a larger vacant parcel is currently being redeveloped into a market rate multi-million dollar mixed use building by an out-of-state firm. I’ve noticed that local companies don’t always appreciate their own assets, but plenty of well funded ventures from other metro areas are taking advantage of the opportunities on offer in Cincinnati.

Screen Shot 2015-06-20 at 4.57.52 PMGoogle

Screen Shot 2015-06-20 at 4.56.41 PMGoogle

unnamed-3

unnamed-1

Right next door is the American Can Lofts building which was completely transformed in 2011 after siting empty since 1978. I arrived in Cincinnati for the first time a few years ago just as this building was having its grand reopened. That takes me to how a guy from San Francisco ended up looking at property in Cincinnati in the first place. Which takes me to why I think Cincinnati is such a great investment.

Screen Shot 2014-12-05 at 1.11.18 AM

Screen Shot 2014-12-05 at 1.05.23 AM

Screen Shot 2014-12-05 at 1.11.59 AM

I have long time friends-of-the-family in Los Angeles. Their daughter graduated from university, got married, and promptly left California. She and her husband explored the country looking for a place to live that they both liked and could afford. (That ruled out nearly every inch of California.) They lived in Baltimore, Maryland for a while and then Portland, Oregon for a year before moving to Cincinnati. They could afford Baltimore and appreciated its gritty charm. But they really loved Portland – give or take the ridiculously high rent and real estate values. What they wanted was Portland at a Baltimore price.

And then they moved to Cincinnati. Ahhhhhh. They bought a charming century old four bedroom house in perfectly good condition for $50,000. It was the best thing any young couple could have done, both financially and in terms of their quality of life. If they had stayed in Los Angeles or Portland they would still be renting (with room mates) and just scraping by. In Cincinnati they became comfortably middle class home owners at the tender age of twenty five. Their mortgage is $400 a month. And they’ve had no trouble finding good work or like minded friends. They aren’t the only young people making this kind of move. Which is probably why out-of-state developers are investing in the city.

The odd thing about Cincinnati is that while the existing housing stock is very reasonably priced, good quality space is commanding fairly high rents. Apartments in the America Can building go for $610 for a one bedroom up to $1,480 for a three bedroom – and there’s a waiting lists. My inner capitalist sees a generous spread between affordable property and the potential for solid rent from solvent tenants. If I can provide a high quality building I believe I can find good people to occupy the space at a rent that’s reasonable for them and profitable for me. And I can do it without taking on debt and without being a slumlord. Try that in San Francisco and see how far you get…

I just hired a young local architect to help with the reconstruction. This is going to be a fun little adventure. And I’m really happy that old guy who was trying to give me advice lives in the distant suburbs. He’d be a terrible neighbor.

John Sanphillippo lives in San Francisco and blogs about urbanism, adaptation, and resilience at granolashotgun.com. He's a member of the Congress for New Urbanism, films videos for faircompanies.com, and is a regular contributor to Strongtowns.org. He earns his living by buying, renovating, and renting undervalued properties in places that have good long term prospects. He is a graduate of Rutgers University.

Green Pope Goes Medieval on Planet

$
0
0

Some future historian, searching for the origins of a second Middle Ages, might fix on the summer of 2015 as its starting point. Here occurred the marriage of seemingly irreconcilable world views—that of the Catholic Church and official science—into one new green faith.

As Pope Francis has embraced the direst notions of climate change, one Canadian commentator compared Francis’s bleak take on the environment, technology, and the market system to that of the Unabomber. “Doomsday predictions,” the Pope wrote in his recent encyclical “Laudato Si,” “can no longer be met with irony or disdain.”

With Francis’s pontifical blessing , the greens have now found a spiritual hook that goes beyond the familiar bastions of the academy, bureaucracy, and the media and reaches right into the homes and hearts of more than a billion practicing Catholics. No potential coalition of interests threatened by a seeming tsunami of regulation—from suburban homeowners and energy firms to Main Street businesses—can hope to easily resist this alliance of the unlikely.

Historical U-Turn?

There are of course historical parallels to this kind of game-changing alliance. In the late Roman Empire and then throughout the first Middle Ages, church ideology melded with aristocratic and kingly power to assure the rise of a feudal system. Issuing indulgences for the well-heeled, the Church fought against the culture of hedonism and unrestrained individualism that Francis has so roundly denounced. The Church also concerned itself with the poor, but seemed not willing to challenge the very economic and social order that often served to keep them that way.

Historically Medievalism represented a “steady state” approach to human development, seeking stability over change. Coming after the achievements of the classical age—with its magnificent engineering feats as well as an often cruel, highly competitive culture—the Middle Ages ushered in centuries of slow growth, with cities in decline and poverty universal for all but a few.

To be sure, the Church played an important, if difficult role, in preserving classical culture and, in the Renaissance, often nurtured a resurgence in some classical values of human self-improvement, science and inquiry, and individual enterprise. But ultimately, as Max Weber noted, it could not compete with a Protestantism that fit more easily with the emerging capitalist spirit. Protestant countries—the Netherlands, northern German, Britain, and America—took the lead in the development of the modern world. 

Capitalism, particularly during the early industrial revolution, often abused human dignity and engendered huge poverty. This still happens today, as the Pope suggests, but this system has also been responsible for lifting hundreds of millions of people—most recently in China and East Asia—out of poverty. Without the resources derived from capitalist enterprise, there would have been insufficient funds to drive the great improvements in sanitation, housing, and education that have created huge pockets of relative affluence across the planet.

The Coalition for Anti-Growth

What makes the Pope’s position so important—after all, the world is rejecting his views on such things as gay marriage and abortion—is how it jibes with the world view of some of  the secular world’s best-funded, influential, and powerful forces. In contrast to both Socialist and capitalist thought, both the Pope and the greens are suspicious about economic growth itself, and seem to regard material progress as aggression against the health of the planet.

The origins of this world view back to the ’40s. An influential group of scientists, planners, and top executives voiced concern about the impact of an exploding population on food stocks, raw materials, and the global political order. In 1948, environmental theorist William Vogt argued that population was outstripping resources and would lead to the mass starvation predicted in the early 19th century by Thomas Malthus.

The legacy of Malthus, himself a Protestant clergymen, dominates environmental thinking. As historian Edward Barbier notes, Malthusianism presumes that a culture or society lacks all “access to new sources of land and resources or is unable to innovate,” thus is “vulnerable to collapse.” In his seminal 1968 book,The Population Bomb, Paul Ehrlich predicted imminent mass starvation in much of the world and espoused draconian steps to limit fertility, which he saw being imposed by a “relatively small group” of enlightened individuals. He even raised the possibility of placing “sterilants” in the water supply and advocated tax policies that discouraged child-bearing.

Ehrlich’s dire predictions proved widely off the mark—food production soared, and starvation declined—but this appears not to have dissuaded the Church from embracing Ehrlich’s contemporary acolytes. This is not to say that environmentalism has not achieved much in terms of cleaning the air and water, restoring wildlife and expanding open space. Yet these triumphs are not seen as sources of inspiration by a movement that seems to live off pointing to a doomsday clock. 

Given their lack of faith in markets or people, the green movement has become ever less adept at adjusting to the demographic, economic, and technological changes that have occurred since the ’70s. Huge increases in agricultural productivity and the recent explosion in fossil fuel energy resources have been largely ignored or downplayed; the writ remains that humanity has entered an irreversible “era of ecological scarcity” that requires strong steps to promote “sustainability.”

The green movement’s views on population represent the most difficult contradiction in the new alliance. Many environmental organizations and pundits favor strong steps to discourage people from having children. The Church and Francis are now allied to the likes of Peter Kareiva, chief scientist for the U.S.-based Nature Conservancy, who has concluded that not having children is the most effective way for an individual in the developed world to reduce emissions, although he adds that he himself is a father. In the United Kingdom, Jonathan Porritt, an environmental advisor to Prince Charles, has claimed that having even two children is “irresponsible,” and has advocated for the island nation to reduce its population by half in order, in large part, to reduce emissions.

The Poor will always be with us. But they might not go along with the plan.

Another flash point between papal concerns and those of their new best friends lies in addressing poverty. The Pope is correct in identifying inequality and poverty as major concerns, but it’s hard to say how green strategies—particularly when they make energy, housing, and industry far more expensive—actually alleviate the plight of the poor or the middle class.

Ultimately the green platform seeks not to increase living standards as we currently understand them (particularly in high income countries) but to purposely lower them. This can be seen in the calls for “de-development,” a phrase employed by President Obama’s science advisor John Holdren for all “overdeveloped” advanced countries, in part to discourage developing countries from following a similar path. This way of thinking is more mainstream among European activists who seek to promote what is called “de-growth,” which seeks to limit fossil fuels, suburban development, and replace the current capitalist system with a highly regulated economy that would make up for less wealth through redistribution.

We are not talking here about not socialism, as some right-wingers suggest. Marxism, for all its manifest flaws, justified itself by promising to improve living standards; it was passionate about technology, which is one reason Marx called it “scientific socialism.” Instead, Francis seems closer to Peronism, the dominant state ideology of his native Argentina. Even before his most recentpronunciamento, Francis widely disparaged capitalism, which he equated with the cronyism dominant throughout South America.

Peron himself may have battled the Church of his day, but Francis’s relations with the current Peronist regime have warmed considerably, particularly since his ascension. As the Guardian reports, when he was named pontiff, posters quickly appeared around Buenos Aires with the image of Francis over the words "Argentine and Peronist." Peronism embraces the ideal of an economy where justice is mandated through the state’s redistribution of wealth.

This is not reassuring. Since the last century, Argentina has been one of the world’s greatest economic failures, a country that despite a talented and educated populace and huge natural resources, has tumbled from rich country status to a second or third world country. In essence, replacing the American dream with an Argentinian one sounds less than appealing.

Trying to sell anti-growth green ideology may prove a tougher in the developing world. Not surprising then that, no matter what the rhetoric that is adopted by the climate conference to be held in Paris this month, critical figures like India’s Prime Minister Narendra Modi will not restrict building new coal plants—the country has tripled coal imports three fold since 2008. In the sweltering cities of the subcontinent, moves to ban air conditioning are simply not good politics. And Chinese President Xi Jinping, the leader of the world’s largest carbon emitter and user of coal, clearly has no real intention of reversing rapid development, based in large part fossil fuels, till 2030, when reasonably priced alternatives may well be generally available.

In contrast, many greens now seem to embrace ever continuing poverty for emerging countries. Prince Charles, for example, embraces the “intuitive grammar” of ultra-dense slums such as Mumbai’s Dharavi, which, he claims, have perfected more “durable ways of living” than those in the suburbanized west. Similarly, the influential environmental group Friends of the Earth applauds recycling in Dharavi as an “inspiration” for the urban future. California’s Stewart Brand openly endorses the notion “Save the Slums” because they will save the planet.

Given the reluctance of still poor countries to further impoverish themselves, the burden of the Catholic-green alliance will necessarily fall on the middle and working classes. As we can already see in California (the state with the most draconian environment laws), long-term economic growth has been tepid, despite the occasional tech and property bubbles. At the same time, the state suffers not only among the highest unemployment rates in the country, but the highest level of poverty, when cost of living is addressed, and has become home to one-third of the nation’s welfare recipients.

Overcoming the “Poverty of Ambition”

Architect Austin Williams suggests that sustainability, the new prayer word of spiritual greenism, “is an insidiously dangerous concept, masquerading as progress.” It poses an agenda that restricts industry, housing and incomes in a manner that severely undermines social aspiration. Indeed, Williams argues, greens and their allies—now including the world’s most important church—have created “a poverty of ambition.” Williams suggests the common green view is that humanity is “destructive and in need of reduction” rather than “a source of innovation, creativity, imagination and socialization.”

What matters little to the green movement are the economic ramification of their preferred policies, such as forcing a large percentage of the population into “fuel poverty.” Loss of jobs in trucking and manufacturing would hit blue-collar workers and neighborhoods hardest, according to most studies. How this jibes with meeting the high welfare and retirement costs with an urban population increasingly dominated by immigrants, their offspring, and other poor children, seems problematical at least.

The new feudal order that is being proposed, like the original, is based as much on powerful self-interest as fulsome good intentions. Tech oligarchs love a regime where they can invest in renewables with the guarantee of public subsidy. The Trustifarians promote subsidies and renewable use through their foundations and feel personally vindicated for their efforts. The media can celebrate the enlightening shift towards sustainable power. Academics receive grants and churn out studies in support. And the lawyers and the upper bureaucracy achieve ever greater job security to administer the entire program. The Church, by embracing the strongest intellectual current, gets a shot at renewed relevance, and even “hipness.”

This confluence of private interest, public power and the clerical class is suggestive of a new feudal epoch. Bankrolled by inherited money, including from the oil-rich Rockefellers as well as Silicon Valley, the green alliance has already shown remarkable marketing savvy and media power to promote its agenda. Now that their approach is officially also the ideology of the world’s largest and most important church, discussion of climate change has become both secular and religious dogma at the same time. 

What we seem to have forgotten is the historic ability of our species—and particularly the urbanized portion of it—to adjust to change, and overcome obstacles while improving life for the residents. After all, the earliest cities of Mesopotamia and Egypt arose, in part, from a change in climate that turned marshes into solid land, which could then be used for intensive, irrigated agriculture.  

Similarly,  pollution and haze that covered most cities in the high income world—St. Louis, Pittsburgh, Dusseldorf, Osaka, Los Angeles—only a few decades ago has greatly improved, mostly through the introduction of new technology and, to some extent, deindustrialization. In recent decades, many waterways, dumping grounds for manufacturers since the onset of the industrial revolution and once considered hopelessly polluted, have come back to life.

This notion that people can indeed address the most serious environmental issues is critical. We should not take, as Francis does, every claim of the climate lobby, or follow their prescriptions without considerations of impacts on people or alternative ways to address these issues. As we have seen over the past few decades, many of the assertions of environmental lobbyists have turned out to be grossly exaggerated. Similarly, concerns over “sprawl” in the high-income world, for example, have focused on such things as the disappearance of forests, yet, with enlightened policies, both green spaces and forest lands have expanded. Similarly, “sprawl” has not impinged much on farmland or harmed food stocks; indeed both the European Union and the United States continue to produce vast surpluses of food. Rather than suffering from “peak oil,” we are awash in oil and gas.

At the same time, new technologies like low emission cars, solarizing homes, more efficient monitoring of energy use and some intelligent planning—for example, dispersing work or planting trees—make the draconian steps being proposed by many greens and their allies moot.  There is simply no reason, as a recent McKinsey study has shown, for a shift to denser urban housing, a critical element in contemporary climate change thinking.

The key issue may be how Catholics embrace his views, and how willing they are to work with environmentalists whose views on family, fecundity, abortion, and gay marriage are polar opposites of church dogma. As one influential lay Catholic explained, many do not look to the Church for scientific and political direction but for spiritual and moral leadership. “The Church speaks with moral authority, at least to me,” this prominent Catholic suggested, “but it does not possess a special scientific authority—a fact well established by its history (see Galileo).”

Certainly the Church that built so many of the world’s great hospitals, universities, and charities could contribute greatly to grassroots environmental efforts that do not depress the prospects for the poor. In seeking to improve conditions for its flock, the Church needs to make sure that they also don’t get fleeced and driven further into poverty. Social justice may be an important value, but it is dubious that the Church’s credibility will be well served by a neo-feudal alliance dominated by those who abhor the Church’s other core values such as family, the sanctity of human life and some degree of social prudence.

The Church, as well as those of us outside of it, would do better to develop morehumane, and less hysterical, responses to climate-related issues, and in ways that do not stomp on human aspiration. We should avoid the march full-speed backward in time, to the glorious elitism, mass poverty, and class stagnation of the Medieval era. The world’s people, and Francis’s flock, deserve better than that.

Joel Kotkin is executive editor of NewGeography.com and Roger Hobbs Distinguished Fellow in Urban Studies at Chapman University, and a member of the editorial board of the Orange County Register. He is also executive director of the Houston-based Center for Opportunity Urbanism. His newest book, The New Class Conflict is now available at Amazon and Telos Press. He is also author of The City: A Global History and The Next Hundred Million: America in 2050. He lives in Orange County, CA.

Pope Francis photo by presidencia.gov.ar [CC BY-SA 2.0], via Wikimedia Commons

Comparisons: Commuting in London and New York

$
0
0

The world's two leading Global Cities, London and New York are, according to most indicators, remarkably similar in their patterns of regional commuting. This is the conclusion from our recent review of commuting in London and commuting in New York. This analysis contrasts the results between the London Area (Greater London Authority, East and Southeast regions) and the New York combined statistical area, which stretches from New York state, to New Jersey, Connecticut and Pennsylvania. (A unique animated graphic illustrates the London commuting pattern, at "undertheraeder.com." The map is here and illustrates the size of the greenbelt in the London area).

Population and Area

The London and New York areas had almost identical populations in 2014. New York had 23.663 million residents and London had 23.431 million residents, just one percent less. London, however, is growing more rapidly, adding 1.1 percent per year since the 2011 census, while New York's increase has been 0.8 percent annually since the 2010 census (Figure 1).

The land areas are also similar (Figure 2). The London commute shed covers 15,400 square miles (39,800 square kilometers). The New York area is about 10 percent smaller, covering 13,900 square miles (36,000 square kilometers).

Broadly, the two cities can be divided into similar sectors. Both have among the largest central business districts (downtowns or CBDs) in the world. The two central municipalities, the Greater London Authority and the city of New York both have somewhat over 8 million population. There is a first ring of counties located outside the Greater London Authority and the city of New York. Finally there are outer counties in both areas. The geographic areas are described in the "Geographical Note" below.

Distribution of Employment

In the distribution of employment between the two cities is remarkably similar (Figure 3). In each case, the suburban counties account for 60% of employment. In both London and New York, the outer counties have slightly more employment than the inner counties, though in both cases the inner counties and outer counties have approximately 30% of employment.

This leaves approximately 40% of the employment for the central cities. In New York, 22% of the employment is in Manhattan, which contains the central business district. In London, a somewhat smaller 16% of the employment is in the five local authority areas that include the central business district (Camden, Lambeth, city of London, Southwark and the city of Westminster). The balance of the city of New York --- the outer boroughs of the Bronx, Brooklyn, Queens and Staten Island, has just 18% of the area's employment, while the balance of the Greater London Authority --- outer London and the balance of inner London --- has 25% of the area's employment.

Where People Live and Work

The distribution of the jobs are relative to resident workers is also similar between London and New York. In both cities, the inner counties and the outer counties have nearly the same number of jobs as resident workers. In the case of London, there are 99 jobs per 100 resident workers in the inner counties and a somewhat smaller 92 in the outer counties. In New York, there are 97 jobs per resident worker in the inner counties and 87 in the outer counties. The largest imbalances in both areas occur in the core municipalities. There are approximately 330 jobs per 100 resident workers in the local authority areas containing London's central business district. Manhattan, with New York's central business district has a somewhat smaller 280 jobs per 100 resident workers. Indicating the draw of the central business district for workers living in the balance of both core municipalities, there are only 83 jobs for each 100 workers in the balance of the Greater London Authority and 68 in the balance of the city of New York (Figure 4).

In the two cities, most resident workers are employed in their home sector, 68% in New York and 67% in London. This is also the case in each of the sectors of the two cities. In New York, the largest percentage of resident workers (85%) is employed in Manhattan, with the central business district. The number is considerably smaller (64%) in the jurisdictions containing London's central business district. In London, the largest share of resident workers employed in their own sector is 88% in the outer counties. In both cities, the inner counties also have a relatively strong balance of local residents, with 71% working in their home sector in New York and 75% in London. In both cities, the smallest number of resident workers employed in their home sectors are in the balance of the core municipality, 62% in London and 55% in New York (Figure 5).

Commuting to the Central Business Districts

The data indicates a surprisingly limited draw for the two central business districts. Often media articles and even academics presume that cities are monocentric --- that most employees work in the central business district. This isn't even close to being the case. In fact, the analysis of commuting in the New York and London areas shows that only in the sectors containing the central business districts does the central business district attract most of the resident workers. Even in the relatively jobs-poor balance of the two core municipalities, only 36% in New York and 30% in London work in the jurisdictions containing the CBDs. In the inner counties, the numbers are much smaller. Only 14% of New York inner county resident workers have employment in Manhattan, with an even smaller number, 8% of London's inner county resident workers commuting to CBD jurisdictions. The numbers are even smaller in the outer counties, where only 4.6% of New Yorkers commute to Manhattan and 2.4% of Londoners commute to the CBD jurisdictions (Figure 6). 

In both cases, approximately 75% of CBD employees are drawn from the core municipality. In New York, approximately 30% of the central business district employees are from Manhattan, while 43% are from the outer boroughs. In London, 19% of the central business district employees are from the five CBD jurisdictions and 57% are from the balance of the Greater London Authority.

Manhattan is a somewhat stronger draw to the suburban counties, with 18% of employees from the inner counties and 8% from the outer counties. The London CBD draws 17% of its workers from the inner counties and 5% from the outer counties. Despite the comprehensive suburban rail system in New York and both suburban and national rail system in London, comparatively few workers commute from beyond the outer counties --- 2.6% in London in 1.5% and New York (Figure 7).

How Commuters Travel

There are also similarities between the commuting methods in the London and New York areas. In both cases, cars, vans and other light vehicles carry the majority of commuters, 53% in London and 62% in New York (Figure 8). Mass transit carries virtually the same share of commuters in both cities, at 26%. Many more Londoners walk to work the New Yorkers, at 10%, compared to less than 6%. Approximately 5.8% of London workers report working at home, somewhat more than New York's 4.1% (Since the two nations use different census survey instruments, the data may not be completely comparable).

Widely Dispersed Global Cities

Ultimately the key finding is that the world's two greatest Global Cities are widely dispersed. Despite the strength of their cores, the overwhelming majority of employment is in the suburbs. Only a small percentage of resident employees in the suburban areas work in the central business districts. A majority of resident workers is attracted to the CBDs only from the jurisdictions containing the CBDs themselves.

-----

Geographical Note: The geographical sectors are as follows:

London (Greater London Authority, Southeast England and East England): The central business district is situated in a wide corridor on both sides of the Thames River. It is contained in local authority areas, including the city of London, the city of Westminster and the boroughs of Camden, Southwark and Lambeth. The inner counties border on the metropolitan greenbelt, which surrounds the Greater London Authority. They are Berkshire Buckinghamshire, Essex, Hertfordshire, Kent and Surrey. The outer counties are Cambridgeshire, East Sussex, Hampshire, Isle of Wight, Norfolk, Oxfordshire, Suffolk and West Sussex.

New York (New York Combined Statistical Area): The area includes 35 counties, in eight metropolitan areas, including New York (NY-NJ-PA), Allentown-Bethlehem (PA-NJ),  Bridgeport-Stamford (CT), East Stroudsburg (PA), Kingston (NY), New Haven (CT), Torrington (CT) and Trenton (NJ). 

-----

Wendell Cox is Chair, Housing Affordability and Municipal Policy for the Frontier Centre for Public Policy (Canada), is a Senior Fellow of the Center for Opportunity Urbanism (US), a member of the Board of Advisors of the Center for Demographics and Policy at Chapman University (California) and principal of Demographia, an international public policy and demographics firm.

He is co-author of the "Demographia International Housing Affordability Survey" and author of "Demographia World Urban Areas" and "War on the Dream: How Anti-Sprawl Policy Threatens the Quality of Life." He was appointed to three terms on the Los Angeles County Transportation Commission, where he served with the leading city and county leadership as the only non-elected member. He served as a visiting professor at theConservatoire National des Arts et Metiers,a national university in Paris. 

Photograph: Traffic in Bergen County, New Jersey (a  New York inner suburban county), by author.

Homebuyers Confront China Syndrome

$
0
0

China has hacked our government, devastated or severely challenged our industries and enjoyed one of the greatest wealth transfers in history – from our households to its. China also benefits from by far the largest trade surplus with the United States and also owns 11 percent of our national debt.

Sometimes it seems to be increasingly China’s world, and we just happen to live in it. Some, such as columnist Thomas Friedman and Daniel A. Bell, author of the newly published “The China Model,” even suggest we adjust our political system to more closely resemble that of the Chinese.

Yet, a funny thing has happened on the way to global domination – the Chinese are coming here with their money, and, often, with their families. Rather than seeing China as the land of opportunity, more Chinese have been establishing homes in America, particularly in California, where they account for roughly one-third of foreign homebuyers, with upward of 70 percent paying cash. Overall Chinese investment in U.S. real estate has grown from $50 million in 2000 to $14 billion in 2013, surpassing all other foreign investors.

Read the entire piece at The Orange County Register.

Joel Kotkin is executive editor of NewGeography.com and Roger Hobbs Distinguished Fellow in Urban Studies at Chapman University, and a member of the editorial board of the Orange County Register. He is also executive director of the Houston-based Center for Opportunity Urbanism. His newest book, The New Class Conflict is now available at Amazon and Telos Press. He is also author of The City: A Global History and The Next Hundred Million: America in 2050. He lives in Orange County, CA.


Identifying Black Urbanists

$
0
0

There are black urbanists.  There are African-Americans who have invested their life's work toward the betterment of cities.  They haven't always gotten the exposure and acknowledgement that others have received, but they have nonetheless contributed to an improved understanding of how cities work, especially in an African-American context. 

Today, I'm putting forth a nomination list of ten individuals whose work may not conventionally fall in the realm of urbanism as it's known today, but certainly stands out as urban-oriented.  And why is that?  The work of the people listed below doesn't fall in the fields or disciplines most people associate with today's urbanists -- architects, landscape architects, urban designers, economists, and enlightened public works officials or policymakers.  The ten I'm nominating as leading black urbanists tend to have sociological or activist backgrounds, often rooted in the Chicago School of sociology, which emphasizes the study of human interactions as opposed to the impacts of design, economy or policy on the built environment.  And of course, the human interactions they most frequently observed were those of African-Americans within major cities.

Here they are, in (roughly) chronological order.

W. E. B. DuBois.  As a sociologist, historian, civil rights activist and founder of the NAACP who was the first African-American to earn a doctorate (from Harvard, in sociology), DuBois' work as an activist is well-known.  However, DuBois rose to prominence in 1899 with the publication of The Philadelphia Negro.  The study, which helped to cement the field of sociology as an academic discipline, examined the form and function of Philadelphia's black community, which operated nearly completely out of the context of other urban communities.  DuBois' study was among the first to openly say that discrimination was at the heart of problems within isolated black urban communities.

Horace Cayton, Jr./ St. Clair Drake.  Cayton and Drake followed up the work of DuBois with their own Northern city sociological study, Black Metropolis: A Study of Negro Life in a Northern City.  Using Chicago's Bronzeville neighborhood as their laboratory, Cayton and Drake provided not only a "generalized analysis of black migration, settlement, community structure, and black-white race relations in the early part of the twentieth century, but also tell us what has changed in the last hundred years and what has not."  Cayton was the grandchild of America's first elected African-American senator who later went on to become a sociologist, newspaper columnist and author.  Drake was a sociologist and anthropologist who later founded the African-American Studies program at Stanford University.  The two met at the University of Chicago and produced their famed study.

John Hope Franklin.  As an historian at several institutions throughout his career, Franklin did not specialize in cities per se.  However, in works such as From Slavery to Freedom, first published in 1947, and his lecture series Racial Equality in America, he more than touches upon the African-American experience in cities, and how discrimination shapes the experience of black residents, and indeed the entire city.

Gordon Parks.  A photographer, writer and filmmaker, Parks specialized in documenting the everyday lives of African-Americans, especially in cities.  His work often made a statement on the conditions of blacks in cities, and forced viewers to reflect on their condition:


Parks became known for much more with his later work in fashion photography and film making.  However, his early work brought plenty of attention to race matters in American cities.

Dorothy Mae Richardson.  Richardson was a community activist who fought against redlining in her neighborhood in Pittsburgh, PA.  Richardson challenged local Pittsburgh banks to issue conventional loans for mortgages and housing rehabs in her Central North Side neighborhood.  That led to the founding of Neighborhood Housing Services in Pittsburgh, and the national group now known as NeighborWorks America, one of the nation's leading community development institutions.

Rev. Dr. Calvin Butts.  Rev. Dr. Butts is the pastor of Abyssinian Baptist Church in New York, but in this context is more well-known as the founder and chairman of Abyssinian Development Corporation in New York as well.  Founded in 1989, ADC is one of many community development corporations in New York and across the country that have sought to fill the investment void -- for housing, for commercial development, for community services -- in distressed communities.  In ADC's case, the organization is credited with bringing in more than $500 million in housing and commercial development to New York's Harlem neighborhood since 1989.

William Julius Wilson.  Following in the earlier sociological tradition of the study of blacks in cities, Wilson is sociology professor at Harvard University.  Wilson is the author of many works, but perhaps his most influential include The Truly Disadvantaged: The Inner City, The Underclass and Public Policy, which once again brought African-American community isolation to the forefront, and When Work Disappears: The World of the New Urban Poor, which examines the impact of job loss on poor communities.  More recently, Wilson published More Than Just Race: Being Black and Poor in the Inner City, which more closely links urban poverty with discriminatory practices whose impacts linger today.

Geoffrey Canada.  Canada is credited with vastly expanding the role of a traditional family-oriented social service agency to the Harlem Children's Zone, an organization that tightly tracts the academic success and family support of all families within a 24-block area in Harlem.  The program is resource-intensive, but it is credited with stemming the tide against poverty in Harlem.

Mary Pattillo.  Pattillo is a professor of sociology and African-American Studies at Northwestern University.  She's added two important works that illustrate how blacks operate in today's urban environment.  In 1999 she published Black Picket Fences: Privilege and Peril for the Black Middle Class, which documents how the black middle class has a far more difficult time achieving "escape velocity" from the ills of the inner city, and Black on the Block: The Politics of Race and Class in the City, which illustrates how a uniquely African-American version of gentrification emerged in Chicago's North Kenwood-Oakland neighborhood on the South Side. 

So there's ten black urbanists.  I know there are many more; some who work with lots of notoriety as they address issues like police brutality, housing, public transit, environmental justice, food deserts and the like.  And there are others who toil in anonymity, working in block clubs, CDCs and other organizations, working steadfastly to make their community a better place.

I made a statement three years ago that takes a shot as to why there are "no prominent black urbanists" today:

"I believe no nationally prominent black urbanist has emerged in large part because of differing worldviews held by whites and blacks. Very, very, very broadly speaking, with many caveats, I believe whites have a history of believing they can impact cities, while blacks have a history of believing that cities impact them."

By that I mean that I see many white urbanists surveying the urban landscape and developing rather abstract solutions that flow downward into actual policy, while many black urbanists assess conditions on the ground and develop solutions that they believe will rise up into actual policy.  I hope at some point the two can meet and work together.

This post originally appeared at Corner Side Yard on July 7, 2015.

Pete Saunders is a Detroit native who has worked as a public and private sector urban planner in the Chicago area for more than twenty years.  He is also the author of "The Corner Side Yard," an urban planning blog that focuses on the redevelopment and revitalization of Rust Belt cities.

Top photo: Google Earth view of Chicago's Bronzeville neighborhood, on the South Side lakefront.  Source: Google Earth.

How To Justify Spending $8M On Something Nobody Wants

$
0
0

The Minneapolis-St. Paul Metropolitan Council is gambling $8.7 million on a project to alleviate pedestrian congestion that might exist in 5 to 10 years if we’re somehow able to build two additional light rail lines and they are operating at full capacity for 10 days a year.

That’s like buying flood insurance on the house you have yet to buy.

The below $8.7 million piece of public infrastructure is intended to create a more safe passageway for travelers at the Downtown East station during Vikings home games. It’ll serve west and northbound train passengers and other pedestrians looking to enter a new football stadium. It is deemed this will be an important pedestrian overpass once all four major light rail lines completed.

Download the Downtown East Plan Met Council PowerPoint here [PDF].

Those reading this should have at least two questions:

  1. How did this come to be a thing?
  2. Why is it all of a sudden getting $8.7 million?

I pay particularly close attention to local projects. I read blogs, forums and newspapers daily. I know and follow local decision-makers on social media, track development proposals, and pay attention to those boring committees few care about. I also work in the industry and talk to other people who work and follow the industry across related professions. It’s fair to say that I have a very good idea of what’s going on in the Twin Cities and the transportation and development needs of the community.

Never once have I heard of this project until a few days ago. And now, out of the blue, we’re dropping $8.7 million on a bridge that’ll be needed 10 days a year starting in 2019.

I wrote a blog post last year titled The Politics of Dumb Infrastructure. It was well received, and is even being used as required reading in an undergrad planning course in California. In the article I theorize as to why we make bad decisions when it comes to receiving other people’s money on transit projects;

It’s the orderly, but dumb system that makes planners and politicians play to a bureaucratic equation that is supposed to guide officials towards the best alternative. Only it never actually works out that way and it usually forces smart people into making highly compromised and less-than-ideal decisions.

The pedestrian bridge is different. It may deal with Federal grants, but is also come from local and regional coffers. Regardless, this project is being pushed forward. According to the Star Tribune,

“The transit agency will likely devote $6 millon from its coffers for the project (this figure could be offset by federal grants), with the Minnesota Sports Facilities Authority (which oversees stadium construction) ponying up $2 million, and the rest coming from bonds issues by the Met Council.”

Before we go any further, I think we need to ask a complex question.

How Did We Get Here?

The new $1 billion Green Line is done and the $1.1 billion Vikings Stadium is underway. They combine to represent over $2 billion of investment. Our local leaders are concerned, as they should be, that these pieces of infrastructure be as perfect as possible.

To quote a former Governor (one who wasn’t a professional wrestler),

“All too often, the human tendency is to compound one big mistake with a series of additional mistakes in the hope that somehow the results will improve. This appears to be the case with the Vikings stadium.”

Politicians are attracted to big, transformitive projects, so it seems only natural that our leaders, who have expelled a great amount of political capital, want to see every inch of it succeed. Even if that means throwing good money after bad.

How We Justify It All

An engineer at the Met Council, likely under much political pressure, noticed something: based on 2019 projections, during peak hours on Minnesota Vikings game days, there will be only a 120 second headway between trains. This will likely not be enough time to manage safe pedestrian crossings. The proposed solution is the bridge.

TopView

Please note the skyway attached to the State-mandated parking structure.

The pedestrian bridge makes some sense. Based on the projections, there will be long lines and delays during this period; and building a bridge for pedestrians certainly isn’t an unreasonable response. The Met Council’s Transportation Committee appears to be interested in the idea.

Let’s look at these assumptions: they assume that there will be two additional light rail lines in full operation, both of which have not yet even been either fully allocated money or constructed. Basically, the Met Council is gambling $8.7 million that there might be a problem in 5 years if we’re somehow able to build two additional light rail lines and they are operating at full capacity for 10 days a year.

To reiterate: Four (4) LRT lines being in operation (Blue, Green, SW & Bottentieu) and that Vikings game attendees hitting a 40% transit mode share. All of things don’t currently exist. It also assumes, more importantly, that if there is congestion people will not find an alternative route or change their travel behavior. This isn’t to say we can’t plan ahead. We should. But, we should be more realistic in our projections and our priorities.

Where Are Our Priorities?

Why did this project get fast-tracked while other smaller, more “everyday” projects never see the light of day? And, when smaller projects get the public’s attention, why do they struggle to find funding? These are merely a question of priorities.

As Nick Magrino (at streets.mn) has asked so often, “why are we embarrassed by the bus?” He writes,

“… I can’t shake the feeling that many of the expensive transit improvements we get in the Twin Cities are thought up by people who don’t actually use transit. Which is why we end up with Northstar, the Red Line, and so on.”

A bridge like this seems like such a low priority, especially when we have legitimate transportation needs. For example, THIS is a bus stop on a heavily used transit line near the center of Minneapolis.

It’s not that a pedestrian bridge is a terrible idea. Under the projections, at some point in the future, it seems maybe reasonable. But, why is the Met Council prioritizing and fast-tracking this, whereas things like bike lanes, bus shelters, and potholes get ignored? I say this because you could build 40 miles of protected bike lanes for the same price tag.

Projects can take on a life of their own. There is no traditional process to getting things done. In this pedestrian overpass, you have the right person with the right slideshow presenting it to the right people at the right time. From here, you have the Met Council employees and political-appointed representatives who have monies at their disposal. The proposal, while not perfect, seems reasonable enough. And, we’ve just spent $2 billion on infrastructure, so we need to make it right. The presentation looks good, so why not go for it?

What Would Your City Do With $8.7 Million?

Imagine if the City of Minneapolis was given $8.7 million that could only be used on downtown pedestrian and/or transit projects. What would they do? The answer is: not a pedestrian bridge to be used during 10 sports games a year.

So, why are we doing it?

The answer is that we can get money from elsewhere to do the things we don’t need to do. But, when it comes to doing the simple things that we need to do, well, that money isn’t available from elsewhere. The pedestrian bridge is a bad idea (right now) that’s made worse when you think of the countless thousands of more useful public investments we could be making.

The truth is that the people and the City of Minneapolis don’t even care about it. It’s not on their radar. It’s the people who control infrastructure and transportation dollars who care about this. If given the opportunity to allocate these dollars elsewhere, it’s fair to say thatliterally everyone locally would divert them elsewhere.

Our priorities get skewed and we misallocate resources most when our funding comes from elsewhere. In fact, it is precisely why Minneapolis has the below. All of which the City of Minneapolis will be tearing down in 30 years …

vikingsblahugh

Note: This is also next to a proposed park called “The Yard” that neither the City of Minneapolis nor it’s Park Board want to maintain. Yet, somehow it’s still a thing.

This post originally appeared in Strong Towns on September 9, 2014. Content licensed under a Creative Commons Attribution-Share Alike 3.0 Unported License.

Find more from Nathaniel M. Hood at his blog: nathanielhood.com

Countering Progressives' Assault on Suburbia

$
0
0

The next culture war will not be about issues like gay marriage or abortion, but about something more fundamental: how Americans choose to live. In the crosshairs now will not be just recalcitrant Christians or crazed billionaire racists, but the vast majority of Americans who either live in suburban-style housing or aspire to do so in the future. Roughly four in five home buyers prefer a single-family home, but much of the political class increasingly wants them to live differently.

Theoretically, the suburbs should be the dominant politically force in America. Some 44 million Americans live in the core cities of America’s 51 major metropolitan areas, while nearly 122 million Americans live in the suburbs. In other words, nearly three-quarters of metropolitan Americans live in suburbs.

Yet it has been decided, mostly by self-described progressives, that suburban living is too unecological, not mention too uncool, and even too white for their future America. Density is their new holy grail, for both the world and the U.S. Across the country efforts are now being mounted—through HUD, the EPA, and scores of local agencies—to impede suburban home-building, or to raise its cost. Notably in coastal California, but other places, too, suburban housing is increasingly relegated to the affluent.

The obstacles being erected include incentives for density, urban growth boundaries, attempts to alter the race and class makeup of communities, and mounting environmental efforts to reduce sprawl. The EPA wants to designate even small, seasonal puddles as “wetlands,” creating a barrier to developers of middle-class housing, particularly in fast-growing communities in the Southwest. Denizens of free-market-oriented Texas could soon be experiencing what those in California, Oregon and other progressive bastions have long endured: environmental laws that make suburban development all but impossible, or impossibly expensive. Suburban family favorites like cul-de-sacs are being banned under pressure from planners.

Some conservatives rightly criticize such intrusive moves, but they generally ignore how Wall Street interests and some developers see forced densification as opportunities for greater profits, often sweetened by public subsidies. Overall, suburban interests are poorly organized, particularly compared to well-connected density lobbies such as the developer-funded Urban Land Institute (ULI), which have opposed suburbanization for nearly 80 years. 

The New Political Logic

The progressives’ assault on suburbia reflects a profound change in the base of the Democratic Party. As recently as 2008, Democrats were competitive in suburbs, as their program represented no direct threat to residents’ interests. But with the election of Barack Obama, and the continued evolution of urban centers as places with little in the way of middle-class families, the left has become increasingly oriented towards dense cities, almost entirely ruled by liberal Democrats.

Obama’s urban policies are of a piece with those of “smart growth” advocates who want to curb suburban growth and make sure that all future development is as dense as possible.  Some advocate radical measures such as siphoning tax revenues from suburbs to keep them from “cannibalizing” jobs and retail sales. Some even fantasize about carving up the suburban carcass, envisioning three-car garages “subdivided into rental units with street front cafés, shops and other local businesses” while abandoned pools would become skateboard parks.

At the end of this particular progressive rainbow, what will we find? Perhaps something more like one sees in European cities, where the rich and elite cluster in the center of town, while the suburbs become the “new slums” that urban elites pass over on the way to their summer cottages.

Political Dangers

The abandonment of the American Dream of suburban housing and ownership represents a repudiation of what Democrats once embraced and for which millions, including many minorities, continue to seek out. “A nation of homeowners,” Franklin D. Roosevelt asserted, “of people who own a real share in their land, is unconquerable.”

This rhetoric was backed up by action. It was FDR, and then Harry Truman, who backed the funding mechanisms—loans for veterans, for example—that sparked suburbia’s growth. Unlike today’s progressives, the old school thought it good politics to favor those things that most people aspire to achieve. Democrats gained ground in the suburbs, which before 1945 had been reliably and overwhelmingly Republican.

Even into the 1980s and beyond, suburbanites functioned less as a core GOP constituency than as the ultimate swing voters. As urban cores became increasingly lock-step liberal, and rural Democrats slowlyfaded towards extinction, the suburbs became the ultimate contested territory. In 2006, for example, Democrats won the majority of suburban voters. In 2012, President Obama did less well than in 2008, but still carried most inner and mature suburbs while Romney trounced him in the farther out exurbs. Overall Romney eked out a small suburban margin.

Yet by 2014, as the Democratic Party shifted further left and more urban in its policy prescriptions, these patterns began to turn.  In the 2014 congressional elections, the GOP boosted its suburban edge to 12 percentage points. The result was a thorough shellacking of the Democrats from top to bottom. 

Will demographics lead suburbs to the Democrats?

Progressive theory today holds that the 2014 midterm results were a blast from the suburban past, and that the  key groups that will shape the metropolitan future—millennials and minorities—will embrace ever-denser, more urbanized environments. Yet in the last decennial accounting, inner cores gained 206,000 people, while communities 10 miles and more from the core gained approximately 15 million people.

Some suggest that the trends of the first decade of this century already are passé, and that more Americans are becoming born-again urbanistas. Yet after a brief period of slightly more rapid urban growth immediately following the recession, U.S. suburban growth rates began to again surpass those of urban cores. An analysis by Jed Kolko, chief economist at the real estate website Trulia, reports that between 2011 and 2012 less-dense-than-average Zip codes grew at double the rate of more-dense-than-average Zip codes in the 50 largest metropolitan areas. Americans, he wrote, “still love the suburbs.”

What is also missed by the Obama administration and its allies is the suburbs’ growing diversity. If HUD wants to start attacking these communities, many of their targets will not be whites, but minorities, particularly successful ones, who have been flocking to suburbs for well over a decade.

This undermines absurd claims that the suburbs need to be changed in order to challenge the much detested reign of “white privilege.” In reality, African-Americans have been deserting core cities for years, largely of their own accord and through their own efforts: Today, only 16 percent of the Detroit area’s blacks live within the city limits.

These trends can also be seen in the largely immigrant ethnic groups. Roughly 60 percent of Hispanics and Asians, notes the Brooking Institution, already live in suburbs. Between the years 2000 and 2012, the Asian population in suburban areas of the nation’s 52 biggest metro areas grew by 66 percent, while that in the core cities expanded by 35 percent. Of the top 20 areas with over 50,000 in Asian population, all but two are suburbs.

Left to market forces and natural demographic trends, suburbs are becoming far more diverse than many cities, meaning that in turning on suburbia, progressives are actually stomping on the aspirations not just of privileged whites but those of many minorities who have worked hard to get there.

Another huge misreading of trends relates to another key Democratic constituency, the millennial generation.  Some progressives have embraced the dubious notion that millennials won’t buy cars or houses, and certainly won’t migrate to the suburbs as they marry and have families. But those notions are rapidly dissolving as millennials do all those things. They are even—horror of horrors!—shopping atWal-Mart, and in greater percentages than older cohorts.

Moreover, notes Kolko, millennials are not moving to the denser inner ring suburban areas. They are moving to the “suburbiest” communities, largely on the periphery, where homes are cheaper, and often schools are better. When asked where their “ideal place to live,” according to a survey by Frank Magid and Associates, more millennials identified suburbs than previous generations. Another survey in the same year, this one by the Demand Institute, showed similar proclivities.

Stirrings of Rebellion

So if the American Dream is not dead among the citizens, is trying to kill it good politics? It’s clear that Democratic constituencies, notably millennials, immigrants and minorities, and increasingly gays—particularly gay couples—are flocking to suburbs. This is true even in metropolitan San Francisco, where 40 percent of same-sex couples live outside the city limits.

One has to wonder how enthusiastic these constituents will be when their new communities are “transformed” by federal social engineers. One particularly troubling group may be affluent liberals in strongholds such as Marin County, north of San Francisco, long a reliable bastion of progressive ideology.

Forced densification–the ultimate goal of the “smart growth” movement—also has inspired opposition in Los Angeles, where densification is being opposed in many neighborhoods, as well as traditionally more conservative Orange Country. Similar opposition has arisen in Northern Virginia suburbs, another key Democratic stronghold.

These objections may be dismissed as self-interested NIMBYism, but this misses the very point about why people move to suburbs in the first place. They do so precisely in to avoid living in crowded places. This is not anti-social, as is alleged, but an attempt—natural in any democracy—to achieve a degree of self-determination, notes historian Nicole Stelle Garrett.

Aroused by what they perceive as threats to their preferred way of life, these modern pilgrims can prove politically effective. They’ve shown this muscle while opposing plans not only to increase the density in suburbs, and also balking at the shift of transportation funding from roads, which suburbanites use heavily, to rail transit. This was seen in Atlanta in 2012 when suburban voters rejected a mass transit plan being pushed by downtown elites and their planning allies. Opposition to expanding rail service has also surfaced in the Maryland suburbs of Washington.

Suburbs and 2016 Election

To justify their actions against how Americans prefer to live, progressives will increasingly cite the environment. Climate change has become the “killer app” in the smart growth agenda and you can expect the drumbeat to get ever louder towards the Paris climate change conference this summer.

Yet the connection between suburbs and climate is not as clear as the smart growth crowd suggests.  McKinsey and other studies found no need to change housing patterns to reduce greenhouse gases, particularly given improvements in both home and auto efficiency. Yet so great is their animus that many anti-suburban activists seem to prefer stomping on suburban aspirations rather seeking ways to make them more environmental friendly.

As for the drive to undermine suburbs for reasons of class, in many ways the  assault on suburbia is, in reality,  a direct assault on our most egalitarian geography. An examination of American Community Survey Data for 2012 by the University of Washington’s Richard Morrill indicates that the less dense suburban areas tended to have “generally less inequality” than the denser core cities; Riverside-San Bernardino, for example, is far less unequal than Los Angeles; likewise, inequality is less pronounced in Sacramento than San Francisco. Within the 51 metropolitan areas with more than 1 million people, notes demographer Wendell Cox, suburban areas were less unequal (measured by the GINI Coefficient) than the core cities in 46 cases.

In the coming year, suburbanites should demand more respect from Washington, D.C., from the media, the political class and from the planning community. If people choose to move into the city, or favor density in their community, fine. But the notion that it is the government’s job to require only one form of development contradicts basic democratic principles and, in effect, turns even the most local zoning decision into an exercise in social engineering.

As America’s majority, suburbanites should be able to deliver a counterpunch to those who seem determined to destroy their way of life. Irrespective of race or generation, those who live in the suburbs—or who long to do so—need to understand the mounting threat to their aspirations  Once they do, they could spark a political firestorm that could reshape American politics for decades to come.

This piece first appeared at Real Clear Politics.

Joel Kotkin is executive editor of NewGeography.com and Roger Hobbs Distinguished Fellow in Urban Studies at Chapman University, and a member of the editorial board of the Orange County Register. He is also executive director of the Houston-based Center for Opportunity Urbanism. His newest book, The New Class Conflict is now available at Amazon and Telos Press. He is also author of The City: A Global History and The Next Hundred Million: America in 2050. He lives in Orange County, CA.

Suburbs photo courtesy of BigStockPhoto.com.

Gates and Borders, Malls and Moats: A Photo Essay of Manila

$
0
0

Home-made housing (left): Refugee families from Mindanao set up shop-houses in the grounds of the mosque in Quiapo. Quiapo contains a number of significant sacred sites for Catholic pilgrimages and festivals. Islamic refugees are making a living in the markets, even as some have sought refuge inside their own sacred site.


Private turned public (above): Stylish home design transformed into gallery space showing contemporary Pinoy artworks. Pinto Art Gallery, Antipolo.

Modernizing the canal frontage: A Spanish-era esterogets a make-over Chinatown style. The water is polluted, the smells are noxious and the blank wall opposite and infor- mal housing at the back compromise the attempt at a waterfront outdoor sitting area.


The air-con city: Mega-malls and new skyscraper districts such as these in Pasig City (Ortigas) provide havens from the outside world of heavy metals – in the air and on the tollways. The lack of commons means that the corpora- tized spaces of malls, and gated apartment and business high-rises, are very popular not least because these cathedrals of consumption are air-con simula- cra of public life. Mega-malls are not only about the shopping but also about looking, promenading and hanging out. But these are not public spaces so much as corporately owned.


Informal housing on an estero, Quiapo: Public space is non-owned space and therefore represents what is left over rather than something consciously created to reflect public order and culture. Without adequate sanitation systems the water- ways do the flushing, but modern cities generate more than organic waste so the esteros have long been biologically dead. The poor are ever ingenious in making the best out of whatever comes to hand – in recycling building materials for their homes, parking their bicycles on the public bridge, hanging the washing over the canal, and creating walled gardens.

Superguard at your service: In a city of gates and borders that mark the boundaries of private territories, private armies are required by rich and poor alike to police them. Uniforms and guns abound and it is not always obvious who is protecting whom. Regulation and authorization of the guardians is a complex, semi-legal and irregular process. Each guard has his own moniker, many of them spoofs of popular culture super-heroes.


Mega-mall commons: Shopping malls are owned by billionaire tycoons with dynasties like the Araneta, Ayala and Sy families. Local pop and film stars perform on concert stages in the cathedral-like vaults of the central halls where fashion shows, trade fairs and church masses are also held every day. Araneta Center, Cubao, where this photo was taken, is one of the earliest popular mall areas in Manila, dating back to the 1950s, that is undergoing a major make-over. Its fortunes declined into the ’80s as the attentions of the fashion-conscious middle class moved to other malled cities. For the past two decades, Cubao has been a shopping centre for the poor and a bus terminus for the provinces. The area itself has been notable for its urban grunge. The sex bars were shifted from Ermita and Malate to Cubao in the ’90s. The shopping mall has recently had a major make-over and is now connected to two light rail lines – a development that in turn attracts high-density apartment building in the area. As Cubao begins a gentri- fication process, so its urban rents rise. The rich return – or at least a new middle class arrives to graze, shop and parade. The Araneta Center and Coliseum complex has over a million visitors daily.


New urban villages arrive in Manila: Fort Bonifacio is the biggest, boldest experiment in new city building inside a Southeast Asian mega-city. As a series of public-private partnerships, it represents a sustained attempt to mimic world’s best practice in city building and urban renewal. Here at Serendra the pedestrian mall exhibits a careful integration of greenery, sitting areas, promenades, and restau- rants, cafes, boutiques and medium-density walk-up apartments. Not surprisingly, it is very popular and is copied by developers of other new cities in Metro Manila. It is one thing to get the plan right, quite another to regulate and maintain these areas in a city of massive socio-economic inequalities.


High wall to the street: The rich build fashionable mansions with global-local consciousness of design fashions. Even if the suburb is not gated, the fence to the street is – more often than not – high. The formula is something like this: the more aspirational and richer the houseowner, the greater the probability that the sociality is turned indoors and against the street. The rationalization is security.

SM Marikina: shopping mall as fortress: Waterfront park on the Pasig River replete with sculpted carabao. The people’s park project has been embraced by the citizens of Marakina Barangay, but here SM presents a blank wall and car park to the riverfront and thereby discourages pedestrian flows between the shops and the park.


Skyscraper city: Ortigas, Pasig City, is a poorly planned new city along EDSA. Identi-kit skyscrapers sit cheek to jowl, there are no parks, and the streets are car-jammed 24-7.

Drain as moat: The gated community of Casa Verde has three defensive layers to the street – the walls of the houses themselves, the drain which acts as a moat, and a wall on the street. The opposite side of the street is likewise walled. It is a street without pedestrians – an unusual phenomenon in Asian urbanism.


Theme park cities: Las Vegas is most famous for this kind of ersatz ‘Dis- neyfication’ of living spaces, but Manila has been doing it for longer – theme park histories of imagined communities in medieval and Renaissance Europe abound. The aesthetic might be kitsch but the lived experience for the local residents and business folk is another thing altogether. In a city with one of the lowest percen- tages of green and pedestrianized spaces, these places – such as this one in McKinley Hill, Fort Bonifacio – are highly sought after and valued by its citizens.


Spectres and spectacles: New apartment blocks in Fort Bonifacio tower over the hauntingly beautiful memorial park and cemetery for 17,201  American  military killed during ‘the liberation (sic) of Manila’ and other parts of the Philippine archipelago. It is the largest such Second World War cemetery for  American military in the world, covering 152 acres. They have the best views and sea breezes in Manila.


Tampa Bay, Florida, or Cairns, Australia? No, it’s Fort Bonifacio, Manila. Fort Bonifacio was made possible by Mt Pinatubo blowing its top on 15 June 1991. No amount of protests against the US communications and military bases in the Philippines could budge the Americans. But the fall of the Soviet empire and a volcano did the trick. Fort Bonifacio, ironically, named by the Americans after one of the revolutionary leaders against the Spanish colonisers, when vacated, left one of the largest areas ever made available for urban renewal in an Asian city. It is now one of the highest social status new areas and consequently one of the most expensive. Its progress has been slow, not least due to various economic downturns but also because of the care taken by government planners and corporate investors in designing the infrastructure of a city that integrates commercial, government, and social facilities and amenities. In stark contrast to the big boxed mega-malls, this shopping area seeks a suburban outdoor tropical ambience, and again privi- leges pedestrians over vehicles – a too rare occurrence in Manila.


Gates, guards and wires: Manila is a world leader in gated community living. This one in Cubao is typical in its structure – two-storey, semi-detached houses inside a fortress wall with single gate entrance with 24-7 security guards. Standard issue telephone lines clutter the streetscapes of cities the world over – will Wifi technologies clear urban skies?


Quiapo, Manila: How can a city turn a backyard sewer into a living waterfront again? The canals (esteros) of Manila are historical artefacts of the Spanish era, but are now the backyards of the poor. The challenge is threefold: heritage (historical con- servation and re-use), ecology (toxic and organic waste management, restoring riv- erine and estuarine ecosystems requiring an integrated approach to the whole Pasig River and Manila Bay area and not just the canals themselves), and livelihoods and sustainable housing for the poor (including their involvement in the re-development of the area and the restoration of the canals). Some success on all three fronts can not only transform the economic fortunes of the whole city but make the area an urban village area that is aesthetically appealing to locals and tourists alike.


Spot the prison wall!: This high-density informal settlement in the university belt area opposite Far Eastern University fences in a prison! You can spot the panopti- con guard house at the centre-top of the photo. This community is well-established but has been legally protesting a developer’s permit to build a shopping mall on their site. Informal settlers use every available space and the streets and paths are literally left-over space. The more established, longer-term settlers build up and consolidate their homes by turning their walls from cardboard, Masonite and plas- tic into concrete bricks and tin roofs. By definition informal settlements are DIY – including sanitation, water, electricity and telephone connections. The high density ensures maximization of population in an inner city zone and makes it easier for its residents to organize protection against potential hostile intruders. The disadvantage is that should there be a fire or flood then fast and efficient assistance by city services is hard to provide.

Intramuros: The old wall and the new moat: Intra-muros is the original walled city of Manila, and now the old Spanish moat – that was filled in by the Americans in the name of public health – has a new purpose: golf! Along with polo and yachting, golf is a high status sporting pastime which the very rich can use to assert their distinction. In a city where over 50 per cent are poor and which has one of the lowest proportions of areas allocated to public parks in the world, here is a key public space that has been turned into a private space for those rich enough to afford leisure time and who can pay for the privilege.

Trevor Hogan teaches in Sociology at the School of Social Sciences, La Trobe Univer- sity, where he is Deputy Director of the Thesis Eleven Centre for Cultural Sociology and Director of the Philippines-Australia Studies Centre.

Caleb J. Hogan is a Fine Arts student at Royal Melbourne Institute of Technology University (RMIT).

Institution of Family Being Eroded

$
0
0

Recent setbacks for social conservative ideals – most particularly on same-sex marriage – have led some to suggest that traditional values are passé. Indeed, some conservatives, in Pat Buchanan’s phrase, are in “a long retreat,” deserted by mainstream corporate America sporting rainbow logos. Some social conservatives are so despondent that they speak about retreating from the public space and into their homes and churches, rediscovering “the monastic temperament” prevalent during the Dark Ages.

This response would be a tragedy for society. For all its limitations, the fundamental values cherished by the religious – notably, family – have never been more important, and more in need of moral assistance. The current progressive cultural wave may itself begin to “overreach” as it moves from the certainty of liberal sentiment to ever more repressive attempts to limit alternative views of the world, including those of the religious.

In the next few years, social conservatives need to engage, but in ways that transcend doctrinal concerns about homosexuality, or even abortion. It has to be made clear that, on its current pace, Western civilization and, increasingly, much of East Asia are headed toward a demographic meltdown as people eschew family formation for the pleasures of singleness or childlessness.

Read the entire piece at The Orange County Register.

Joel Kotkin is executive editor of NewGeography.com and Roger Hobbs Distinguished Fellow in Urban Studies at Chapman University, and a member of the editorial board of the Orange County Register. He is also executive director of the Houston-based Center for Opportunity Urbanism. His newest book, The New Class Conflict is now available at Amazon and Telos Press. He is also author of The City: A Global History and The Next Hundred Million: America in 2050. He lives in Orange County, CA.

Baby photo by Bigstock.

Viewing all 3789 articles
Browse latest View live


Latest Images