Quantcast
Channel: Newgeography.com - Economic, demographic, and political commentary about places
Viewing all 3793 articles
Browse latest View live

A Volunteer Army's Attempt to Fill the New York Hurricane Response Gap

$
0
0

On November 6, eight days after Hurricane Sandy’s surge waters flooded the streets, I started volunteering in the Rockaways, where I stayed for much of the next three weeks.

On that first day, I joined an ad hoc group of volunteers and took a school bus full of supplies donated by my Brooklyn neighbors out to a church on Beach 67th Street. Unloading the bus alongside parishioners at the Battalion Pentecostal church I learned that it was the first shipment they had received for the immediate area since the storm, and that aside from the traffic cops waving cars through and a National Grid trailer parked in the church lot, there was still no official presence in the neighborhood.

The donations we brought were being carried away even before the last of them was off the bus, as word spread through the row houses that lined the block. The mother of a disabled girl carried a box of canned food to her powerless apartment and came back to ask for more. Her fridge and cupboards were already emptied.

The other volunteers and I took the empty bus back to Brooklyn to refill it with more supplies and return later that day. On the drive back, only a mile away from the church, I saw a supermarket parking lot with truckloads of donated material guarded by police and national guardsmen. The people around the church, many of whom lost their cars in the flood, had no way to get the supplies from the parking lot back to their homes, which was incidental since most of them, cut off from any news that didn’t pass by mouth, didn’t even know that the goods were there.

On my second day in the Rockaways I took some time to drive around and see how things were in other neighborhoods, looking for places like the church on 67th Street that were not yet being helped. I found that at the St. Francis de Sales church in Belle Harbor, on 129th Street, some supplies were already being turned away, as boxes had filled the large main hall and were now overflowing into additional rooms to accommodate the constant influx of donations.

Several days later I returned to Francis de Sales to ask that they send food to an apartment complex I had found on the tip of the peninsula near Nassau county, where hundreds of elderly residents were living without heat or power, rationing canned goods and prescription medicine. An Australian volunteer at the church told me that he would take care of it, and while I believed he meant it, I also knew that he might be gone the next day, back to work or to his life outside volunteering.

No one was keeping track.

There is a city agency charged with just that: the Office of Emergency Management (O.E.M.). Emergencies are, by definition, chaotic, and the office is there to do two things: to compile block-by-block information into a unifying big picture, and to ensure responders and resources are allocated in accordance with that picture. In short: triaging, first understanding needs, and then prioritizing among them. But O.E.M. was conspicuously absent while I was in the Rockaways, and according to volunteers and officials I spoke with while reporting this story.

Trying to get people food and basic supplies took up much of my first week in the Rockaways, and yet there was no problem with scarcity. The city spent close to $3 million for food and water distribution and, as of November 26, had distributed over 2 million meals, while donations poured in from New York and out-of-state charities.

Individuals and small groups were doing their best to attend to immediate need, but the lack of direction was acute, resulting in a feast-or-famine situation that varied block by block.

I visited the parking lot where I had seen the trucks of supplies parked and asked if they could be moved to the under-served church on 67th Street but the National Guardsman posted there explained apologetically that taking supplies neighborhood-to-neighborhood, a more effective manner of distribution, didn’t match their orders.

Though city officials had been working hard since even before the storm struck, one thing they weren’t doing was taking control of the situation on the ground, canvassing neighborhoods to determine needs and directing services and supplies accordingly. Nor, since they may not have enough staff to do this all themselves, were they effectively organizing and commanding the hodge-podge of official and unofficial groups and the steady stream of volunteers attempting to make themselves useful.

Relief supplies managed by the city were being delivered to a handful of centralized points without much of a plan for getting them to the people in need, even as the National Guard and the many volunteers looked for ways to help.

Some volunteer groups had identified this issue early on and attempted to deal with it, on their own, in various ways.

Some drove around with supplies until they found people who obviously needed them, and some groups like Occupy Sandy and Save the Rockaways used social media and web presence to post alerts identifying where food and volunteers were needed.

Team Rubicon, a veteran-led relief group, took things even further, using a computer program called Palantir to create an annotated map of conditions in the Rockaways and by stepping up to fill the leadership vacuum. Palantir is a data visualization platform used by the military and intelligence agencies to track and analyze the information gathered from complex environments. It can be highly effective but ultimately relies on human users inputting information gathered from the field.

The group was initially collecting handwritten work orders and reports on local conditions from team members and local residents to track what work was ongoing and what remained to be done. The task of gathering intelligence and feeding into a single model, whether by writing on a map or using a digital database, is a basic pre-condition for conducting any complex operation—you need to understand an environment in order to address its problems. Once they had Palantir added to their system, Team Rubicon could take any report and add it to their database to create a single fluid model of conditions on the ground.

When they first arrived in the Rockaways Team Rubicon intended to be a labor force moving supplies and shoveling out flooded basements. But as the crisis dragged on and more volunteers began arriving in the thousands without any government agency directing their work, Rubicon’s leaders shifted their priorities. Rather than doing all the shoveling themselves, they organized the incoming volunteers into small groups with one Rubicon member assigned to each as a team leader, and dispatched the groups to fill the hundreds of work orders that they had compiled through their canvassing.

As effective as Team Rubicon’s approach was, their reach was limited by their size and the fact that they were only one group among many without any official authority to direct overall efforts. Rubicon’s methodology, collecting and centralizing information in order to coordinate actions, could have been used by the city and implemented on a larger scale and in fact is precisely the approach outlined in the city’s own emergency relief protocols. But, over a month after the hurricane hit, the city’s relief effort still lacks the crucial aspect that has been missing from the start—an effective overhead body leading operations.

Information management is not just an issue for the next emergency: inefficiencies and failures are still occurring because different volunteer groups are not forced to share information and none of them, despite their working relationships, are really on the same page as the city. As one official in a volunteer group that worked with the city during relief efforts put it, “The city had the intel arms in place, the volunteer groups out in the neighborhoods, but they had no system to receive our reports.”

When the city finally started to use volunteer groups for canvassing, it appears to have done so only at the urging of those groups, long after the storm hit.

A Times article details the city housing authority’s failure to properly account for and provide relief to city residents, many of them elderly and unable to evacuate, stuck for weeks in buildings without power or heat. Almost two weeks after the storm, the city called on volunteer groups to go door to door in public housing in Coney Island, surveying to establish how many thousands were stuck in the buildings and what their immediate needs were.

Responding to complaints from volunteers about the city’s lack of leadership in those relief efforts, Nazli Parvizi, the city’s commissioner for community affairs, is quoted in the Times piece saying that the she didn’t want to disturb the volunteers’ good work by taking control of the situation.

According to Parvizi, “I wasn’t here to change that narrative [of volunteers leading while the city played a supporting role]. I was asking them, ‘What do you need?’”

Give Parvizi credit for being honest and not pretending, as many officials have, that the city was aggressively leading relief operations.

The task of coordinating the efforts of various government agencies, volunteers and non-governmental organizations, and providing an overarching structure for emergency response, is precisely what New York City’s Office of Emergency Management (O.E.M.) was created to do.

On its website O.E.M. lists “on-scene coordination” as one of the core responsibilities it assumes an emergency. Yet it was only seen sporadically in the hardest-hit parts of the city—including the Rockaways, Staten Island and Coney Island—and was entirely absent from the wave of city-official-sourced tick-tocks and other stories.

Founded in 1996 by an executive order from Rudy Giuliani, the office effectively took responsibility for emergency planning and response away from the NYPD and gave it directly to the mayor’s office, reportedly to the displeasure of Howard Safir, who was the police commissioner at the time.

In 2001 after becoming its own independent department outside of the mayor’s office and proving its worth in the eyes of many by its response to the attacks of 9/11, O.E.M. seemed to have justified its founding mission and earned an enduring presence. But things changed when Bloomberg was elected and Ray Kelly returned to take over the NYPD. According to multiple sources and news accounts, Kelly, like Safir before him, saw O.E.M. as an affront to the primacy of the police department’s role in ensuring public safety and pressured the mayor to marginalize the organization.

Apparently he had some success in this regard. In 2005, O.E.M. commissioner Joseph Bruno testified before the City Council in a hearing over Bloomberg’s decision to place responsibility for handling hazardous materials in a potential terrorist incident into the hands of the NYPD.

In his testimony, Bruno stated that his office had been more powerful under Giuliani and that in the event of a dispute between the FDNY and NYPD on the site of an emergency he would “give advice,” but “O.E.M. is not going to come in and say, ‘We’ll tell you how to do it.’”

According to a high-ranking official in a prominent volunteer relief organization who has worked closely with both the mayor’s office and O.E.M., tensions between the offices were obvious during the initial, crucial days following the hurricane and communications terse and perfunctory. This official said that whenever there were disagreements between O.E.M. and the mayor’s office, the mayor’s office won.

O.E.M. declined to provide comment for this story, but conversations with sources with knowledge of O.E.M.’s operations and a review of the organization’s history and the turf wars that have shaped its current role provide some insight into what went wrong, and ideas about why those problems are likely to recur in the next disaster. On paper, OEM had all of the tools and resources in place to address these problems. The Citywide Asset and Logisitics Management System (CALMS), created in 2003, is touted by the office as its means of facilitating the movement of supplies in emergency response, and as a crucial part of their mission to “[work] with government agencies and nonprofit organizations to provide assistance to disaster victims and manage relief efforts, donations, and spontaneous volunteers.” According to the O.E.M. website, “CALMS integrates multiple resource management systems and provides a single view of the resources managed or accessible to response agencies.”

But at a meeting held two weeks ago by the New York City chapter of Voluntary Organizations Active in Disaster (VOAD), with an O.E.M. liaison in attendance, the system's shortcomings were made clear.

VOAD, which brings together a coalition of volunteer groups to plan and coordinate relief efforts and which has been meeting regularly since before Hurricane Sandy, seems not to have been connected to O.E.M.’s system. The volunteer official that I spoke with attended the VOAD meeting last week and told me that a member of Occupy Sandy stood up to plead for help with ongoing food shortages while across the table a Red Cross official offered that he had a fleet of trucks loaded with food and only needed to know where to send them.

A second official in a volunteer group I spoke to described driving around the Rockaways on the day of the Northeaster that followed Hurricane Sandy, canvassing neighborhoods to find the people most vulnerable to the coming snowfall. Seeing an O.E.M. setup, he stopped to do some coordination and trade notes and found that the O.E.M. officials were packing up to leave the Rockaways and return to Manhattan in anticipation of the storm.

“Here we were, volunteers going into the storm, and they were leaving,” he said. “It was just gross negligence on their part.”

Media coverage of the city’s reaction to the storm mostly reflects the overriding political priority, which is getting as much federal aid money as possible, and figuring out the expected tens of billions in funding once it begins to come in.

Bloomberg, aware that the polls showed a big majority of New Yorkers approved of the administration’s response to the storm, has focused his limited criticism on flaws in preparedness and on the question of whether to build sea walls.

A full accounting of the city’s performance will take time and the disclosure of public records not yet available, but the process can start with some simple questions. What should New Yorkers expect of the city when disasters occur? What agencies are responsible for the unique and critical needs that arise from emergencies? Whose job is it to feed individuals and families stuck in homes without power? What is the role of volunteer organizations in disasters of this kind, and to whom are they accountable?

The core elements of OEM’s mission—on-scene coordination, logistics management, directing government and non-government groups—constitute a short list of the critical functions that have been most lacking in the city’s response. New Yorkers will need real transparency from the office and an accounting of the functioning of city agencies during and after the storm.

As of this writing, the records of O.E.M.’s action since the hurricane are still minimal, and the office has yet to initiate its own after-action review.

This piece first appeared at Capital New York.

Jake Siegel was born and raised in Brooklyn. His writing has appeared in The New York Times, New York Press and New Partisan. HIs short story will appear in "Fire and Forget" an anthology of fiction written by Iraq and Afghanistan veterans being released by Da Capo on February 12, 2013.

Rockaway Beach hurricane response photo by Bigstock.


America’s Baby Boom And Baby Bust Cities

$
0
0

At this most familial time of the year, as recent events make us hold our children even closer, we might want to consider what kinds of environments are most conducive to having offspring. Alarm bells are beginning to ring in policy circles over the decline of the U.S. birth rate to a record low. If unaddressed, this could pose a vital threat the nation’s economic and demographic vitality over the next few decades.

In contrast to last week, when we examined the nearly uniform aging of America’s biggest cities over the last decade, the decline in the country’s youth population has been in relative terms. In 2000, roughly 21.4% of Americans were under 15; in 2010, that percentage had dropped to 19.8%. However, unlike in parts of Europe and East Asia, the number of American children did not decline – there were over a million more in 2010, a 1.7% increase.

Yet since children are by definition the bearers of the future, knowing where new families and households are forming should be of critical interest not only to demographers, but to investors, businesses and, over time, even politicians. Demographer Wendell Cox crunched Census data for Forbes on the youth populations of the 51 largest U.S. metropolitan statistical areas. His analysis reveals sharp differences between various regions of the country, and suggests where future growth in the country may be the strongest.

The youth population expanded in 31 of the 51 metro areas from 2000 to 2010. The 10 regions that posted the strongest growth were in Texas, the Southeast and the Intermountain West. Leading the nation is Raleigh, N.C., where the number of children under 15 rose a whopping 45%, or 77,421. Texas is experiencing something of a baby boom, paced by Austin, second among America’s largest metro areas with a youth population expansion of 38%; Dallas-Ft. Worth (sixth); Houston (eighth); and San Antonio (11th).

Out west, Las Vegas (third place) and Phoenix (fifth) may be better known as retirement destinations, but also have become increasingly attractive to families. Other western cities with a strong increase in children include Riverside-San Bernardino, Calif. (12th), Salt Lake City (13th) and Oklahoma City (15th). Surprisingly some Midwestern cities also perform relatively well, led by Indianapolis (16th) and Columbus, Ohio (18th).

If these regions are attractive to young families, which ones are not? Outside of last place New Orleans, whose demographic data was distorted by the massive outflow of population due to the Katrina disaster, the sad sacks on this list include many of the usual suspects: aging industrial centers. Buffalo’s youth population declined 16%, Detroit’s, 15%; and Cleveland’s 14%. In these cities, notes Cleveland policy researcher Richey Piiparinen, pessimism about the future, for you and your children, naturally results from “being born into post-industry.”

Not having kids in what may seem to be a ruined economy is understandable. But many metro areas that are usually associated with youthfulness and aspiration are producing fewer children, including Los Angeles (sixth place on our list of baby bust cities with a decline of 12.4%), New York, NY-NJ-PA (eighth, down 7%) and San Francisco-Oakland (16th, -2.7%). Over the past decade these metro areas have lost hundreds of thousands from their under 15 population; Los Angeles has an astounding 360,000 fewer 15 year olds than in 2000 while New York has almost 270,000 fewer and Boston some 62,000 less.

What do these trends mean for the future? New York has lost about as many children as Dallas-Ft. Worth has gained — a difference of a half million. The gap between increasingly childless Los Angeles and Houston is even wider, and approaches 600,000. These numbers suggest a tremendous shift in the future locations of new American households, with all that implies for retail sales, workforce growth and residential construction demand.

Indeed a recent Pitney-Bowes study projects that the largest absolute growth in households in the next five years will be in Houston, with a gain of 140,000, or 6.7%,  while Atlanta is projected to add slightly over 100,000 households, 5.4% more.

In contrast the largest metropolitan area in the country, the New York region, will grow by a mere 75,000 households, a paltry 1.7% clip, while Los Angeles will add only 46,000. Chicago, the third largest metro area, is only expected to add 33,000 households, a growth rate of barely 1.2%.

Why is household formation and child-rearing so anemic in these places, which are often celebrated for being attractive to the young and dominate so many key industries? One key reason, suspects demographer Cox, is housing prices relative to incomes. This is largely due to high regulatory costs that discourage new housing supply, particularly the single-family homes preferred by most families. Housing costs relative to incomes are more than two times higher in New York or Los Angeles than in Houston, Dallas-Fort Worth, Atlanta or, for that matter, virtually all the metropolitan areas most attractive to families.

Another factor may be the impact of density, which, Cox demonstrates, tends to depress fertility rates not only here in the United States, but through much of the world. The fastest-growing youth populations tend to be in lower-density regions such as Austin, Raleigh and Atlanta; the slower growth, outside of the old industrial belt tends to be in the high-density regions.

These differences also exist on the metro level. Within regions, certain areas attract more families than others. For the most part, despite the media hype about families returning to the city, the biggest declines in the under 15 population tend to be in the core urban areas.

Take New York, our greatest city and one that has experienced considerable improvement in quality of life over the last two decades. Yet despite this, the under 15 population of New York County (Manhattan) dropped nearly 10% over the past decade, a net loss of 21,000. Barely 12% of Manhattanites are under 15, far below the national rate of 19.8%. Similar declines have occurred as well in Brooklyn, a borough that many priced-out Manhattan couples have seen as a refuge for young families.

So where are the kids being born in the New York area? The only gainers were in the much-despised, lower-density exurbs such as Rockland County, N.Y., and New Jersey’s Ocean County. A similar, if even more marked pattern can be seen in the greater Chicago area, where Cook County, which contains the Windy City, suffered a 160,000 net drop over the decade in its under 15 population; with an 18% decrease in its student body, it’s not surprising that half of Chicago’s public schools are considered underutilized. Meanwhile exurban Will and Kane counties together have gained some 56,000 children under 15, up over 20%.

Similar phenomena can be observed in most metropolitan areas, including San Francisco, which increasingly resembles a child-free zone. With just 11.2% of the population under 15, the City by the Bay now has the lowest percentage of children of any large county in the nation.

These numbers tell us some intriguing things about our demographic future, and perhaps suggest how to address a potential “birth death.” As the percentage of children relative to adults, and particularly seniors, declines, it’s imperative to identify environments attractive to young families. For the most part, this means areas that offer the best mix of job opportunities, reasonable housing costs and, for the most part, lower density living. If developers and investors can transcend the incessant urban hype and look at the numbers, they may want to look more closely at these places as most likely to enjoy future growth.


Change in Population of Children Under Age 15, 2000-2010
Rank by % ChangeGeographyPopulation Under 15, 2000Population Under 15, 2010Percent Change
1Raleigh-Cary, NC171,779249,71245.4%
2Austin-Round Rock-San Marcos, TX266,816368,85238.2%
3Las Vegas-Paradise, NV300,700408,05335.7%
4Charlotte-Gastonia-Rock Hill, NC-SC287,728382,07132.8%
5Phoenix-Mesa-Glendale, AZ739,916928,28425.5%
6Dallas-Fort Worth-Arlington, TX1,222,7051,488,38321.7%
7Atlanta-Sandy Springs-Marietta, GA955,9061,162,40521.6%
8Houston-Sugar Land-Baytown, TX1,145,9971,389,37721.2%
9Orlando-Kissimmee-Sanford, FL341,258409,10319.9%
10Nashville-Davidson--Murfreesboro--Franklin, TN272,777324,76319.1%
11San Antonio-New Braunfels, TX404,441478,76918.4%
12Riverside-San Bernardino-Ontario, CA860,121992,09715.3%
13Salt Lake City, UT245,938280,65614.1%
14Denver-Aurora-Broomfield, CO467,812533,32614.0%
15Oklahoma City, OK231,567263,71713.9%
16Indianapolis-Carmel, IN343,176384,01511.9%
17Tampa-St. Petersburg-Clearwater, FL438,834484,41610.4%
18Columbus, OH347,692379,6279.2%
19Jacksonville, FL244,723265,1188.3%
20Sacramento--Arden-Arcade--Roseville, CA406,444439,0868.0%
21Washington-Arlington-Alexandria, DC-VA-MD-WV1,023,9311,104,6887.9%
22Kansas City, MO-KS407,217435,8847.0%
23Portland-Vancouver-Hillsboro, OR-WA411,430438,9446.7%
24Louisville/Jefferson County, KY-IN242,945255,4455.1%
25Richmond, VA229,341240,7795.0%
26Seattle-Tacoma-Bellevue, WA624,007651,6054.4%
27Minneapolis-St. Paul-Bloomington, MN-WI663,817680,3222.5%
28Birmingham-Hoover, AL219,064223,6212.1%
29San Jose-Sunnyvale-Santa Clara, CA366,072373,0891.9%
30Memphis, TN-MS-AR285,823287,8940.7%
31Miami-Fort Lauderdale-Pompano Beach, FL988,407987,881-0.1%
32Cincinnati-Middletown, OH-KY-IN443,771441,086-0.6%
33San Diego-Carlsbad-San Marcos, CA611,119596,168-2.4%
34San Francisco-Oakland-Fremont, CA783,554764,185-2.5%
35Milwaukee-Waukesha-West Allis, WI329,359315,745-4.1%
36Chicago-Joliet-Naperville, IL-IN-WI2,055,8821,956,235-4.8%
37Baltimore-Towson, MD540,894511,503-5.4%
38Philadelphia-Camden-Wilmington, PA-NJ-DE-MD1,205,5611,136,468-5.7%
39Hartford-West Hartford-East Hartford, CT233,267219,315-6.0%
40St. Louis, MO-IL585,403549,544-6.1%
41Virginia Beach-Norfolk-Newport News, VA-NC348,293324,478-6.8%
42New York-Northern New Jersey-Long Island, NY-NJ-PA3,808,7733,537,709-7.1%
43Boston-Cambridge-Quincy, MA-NH868,251805,699-7.2%
44Providence-New Bedford-Fall River, RI-MA317,329281,422-11.3%
45Los Angeles-Long Beach-Santa Ana, CA2,915,3912,558,983-12.2%
46Rochester, NY221,349192,407-13.1%
47Pittsburgh, PA447,278384,818-14.0%
48Cleveland-Elyria-Mentor, OH455,074390,730-14.1%
49Detroit-Warren-Livonia, MI996,019845,894-15.1%
50Buffalo-Niagara Falls, NY236,269198,371-16.0%
51New Orleans-Metairie-Kenner, LA289,988225,512-22.2%
Source: U.S. Decennial Census 2010 and 2000


Joel Kotkin is executive editor of NewGeography.com and is a distinguished presidential fellow in urban futures at Chapman University, and contributing editor to the City Journal in New York. He is author of The City: A Global History. His newest book is The Next Hundred Million: America in 2050, released in February, 2010.

This piece originally appeared at Forbes.com.

Crossing the street photo by Bigstock.

Central Banking's Hogwarts Syndrome

$
0
0

Central banks—the US Federal Reserve is one—come with the mystique of Oz. While the Fed fiercely denies that it is powerful enough to cure recessions with a click of the heels, there are those who believe it's true. If, however, you look behind the velvet curtains and columned lobbies, you will find good men, but bad wizards. In mid-December, the bank’s Open Market committee pledged $85 billion a month until unemployment drops below 6.5 percent. Such policies are a long way from Kansas and prudent finance.

Around the world central banks have become convenient instruments of public and private bailouts, accommodating lenders when citizens reject tax hikes and governments need a few trillion to bail out Greece or prop up the housing market. It helps that they are shrouded in mystery and give the impression that they hold their meetings at Hogwarts, perhaps with Albus Dumbledore presiding.

The reason that the Federal Reserve, like many of its European counterparts, looks like a failing credit union is that its balance sheet numbers don’t add up. On November 12, 2012, the Fed showed a assets of $2.9 trillion against equity of $69 billion. In other words, the bank’s leverage is 42 times its capital. At its peak, Lehman was geared 36 times; a prudent limit might be eight times. At this time next year, its assets (which would more properly be considered, liabilities) will be $4 trillion.

$1.6 trillion on the Fed’s book is held in US Treasury securities, although, I can assure you that money has been spent, perhaps on that swell new $3.4 billion “campus” for the Department of Homeland Security.

Before 2008, the Fed’s balance sheet was less than $900 billion, and assets were short-term interbank loans and Treasury securities. Now the balance sheet is $2.9 trillion, and mixed in with the gold at Fort Knox is $886 billion in mortgage-backed securities, making the Federal Reserve the nation’s Savings & Loan. (Imagine the toasters given away to build up such a loan book.)

One reason that the Fed’s balance sheet is not available for a congressional audit is that it might scare world markets to death to discover that the US central bank is awash with non-performing assets, not British gilts or J.P. Morgan’s gold bars. As lenders of last resort, many central banks now have vaults that are crammed with junk bonds, subprime exposure, unwound credit default swaps, out-of-the-money options, and sovereign debt issued by governments that have long since vanished.

Take the European Central Bank. After the 2008 crisis it encouraged banking groups to load up on sovereign credits, hoping that this would prevent further collapse and stimulate local economies.

The same practice of offloading substandard loans to the Federal Reserve governed the stimulus programs of the Bush and Obama administrations, which “stimulated” the economy by moving bad loans off Wall Street and into the Fed.

Another definition for quantitative easing (QE3 in its last rendition) might be “government payday loans.” Together, the central banks of the United States and Europe are holding more than $6 trillion as “assets” on their balance sheets, which if they were accurate might read: “Advances against street demonstrations.”

How did we get to these diminishing returns? In their modern incarnation, central banks replaced market makers and robber barons that got tired of business cycles and having to bail out commercial banks and stock jobbers that had hit the skids.

In the US, the panic of 1907 (which J.P. Morgan mitigated, although to his own ends) pushed the country to later enact legislation creating the Federal Reserve System that, in the future, would provide liquidity during periods of recession; its current dual mandate is to fight inflation and maximize employment.

Given that economics was deemed a science of predictions, the presence of strong central banks in North America and Europe was supposed to mean the end of sharp volatility, even though it has been convincingly argued that the Federal Reserve has made little difference in the many recessions since 1913, notably in the Great Depression, when it restricted the money supply.

In his history of central banking, Lords of Finance: The Bankers Who Broke the World, Liaquat Ahamed makes the point that the leading central banks in and after World War I—those of England, France, the United States, and Germany—routinely made bad decisions when it came to issuing currency, propping up the money supply, or regulating the amounts of credit and bonds in various banking systems.

The biggest problem with central banks is that they are mortgaged to the political classes and have become the funding arm of various get-elected-quick schemes rather than sticking to their job of fiddling with the money supply. The Fed’s evolution into a casino cashier window started sometime after 1996 and continued into the administration of George W. Bush, when the equity in American homes became just another chip for Wall Street croupiers to sweep into their aprons.

Under patriotic banners proclaiming that home ownership was a democratic rite of passage, both Congress and the Fed made it easy for banks to grant mortgages based on little, if any, collateral (remember “liar loans?” I bet Alan Greenspan does). They also looked the other way when the administration decided to pay for its wars and tax cuts by using home equity to keep consumer markets irrationally exuberant. Why? Prosperity has a lot to do with reelecting incumbents, and it was those officials who regulated the regulators. Furthermore, member commercial banks, not the US government, own the Fed, even if the US President appoints the chairman.

What might hasten a reckoning of these wobbly accounts is that central bankers are finding it harder to agree that their temples of finance are ministries of magic. A few, like the German and Swiss central banks, dread inflation and take a dim view of speculators. Those attitudes find little sympathy in Italy, Spain, or Greece—should we add California?—which need to kite checks to pay state pensions.

The US isn't sufficiently flush to help bail out the European Union. Alas, not even the Fed has deep enough pockets to fund trillion dollar annual deficits. Nor should anyone think that the US government is a likely candidate to bail out the Fed, as right now it is the Fed that is bailing out America.

Flickr photo by Lance McCord: Federal Reserve Bank of Atlanta Eagle: Eagle sitting atop a decorative (though once-structural) column outside the Federal Reserve Bank of Atlanta on Peachtree Street; it dates from an earlier incarnation of the Atlanta Fed's home.

Matthew Stevenson, a contributing editor of Harper's Magazine, is the author of Remembering the Twentieth Century Limited, a collection of historical travel essays. His next book is Whistle-Stopping America.

America the Mostly Beautiful

$
0
0

In the fall of 2010, as part of a book project, ex-newspaperman Bill Steigerwald retraced the route John Steinbeck took in 1960 and turned into his classic “Travels With Charley.” Steigerwald drove 11,276 miles in 43 days from Long Island to the top of Maine to Seattle to San Francisco to New Orleans before heading back to his home in Pittsburgh.  In “Dogging Steinbeck,” his new e-book about how he discovered “Charley” was not nonfiction but a highly fictionalized and dishonest account of Steinbeck’s real trip, Steigerwald describes the America he saw.

"Big."

"Empty."

"Rich."

"No change since 1960."

Long after the old farms and new forests of New England disappeared in my rearview mirror, I was still scrawling those words in the reporter’s notebook on my knee. Big, empty, rich and unchanged – that's a pretty boring scouting report for the America I “discovered” along the Steinbeck Highway. You can add a bunch of other boring but fitting words – “beautiful,” “safe,” “friendly,” “clean,” and “quiet.”

Like Steinbeck, I didn’t see the Real America or even a representative cross-section of America, neither of which exist anyway. Because I went almost exactly where Steinbeck went and stopped where he stopped, I saw a mostly White Anglo Saxon Protestant Republican America, not a “diverse and politically correct” Obama one. Mostly rural or open country, it included few impoverished or crime-tortured inner cities and no over-developed/underwater suburbs.

America the Beautiful was hurting in the fall of 2010, thanks to the bums and crooks in Washington and on Wall Street who co-produced the Great Recession.  It still had the usual ills that make libertarians crazy and may never be cured: too many government wars overseas and at home, too many laws, politicians, cops, lawyers, do-gooders and preachers.

But America was not dead, dying or decaying. There were no signs of becoming a liberal or conservative dystopia. The U.S. of A., as always, was blessed with a diverse population of productive, affluent, generous, decent people and a continent of gorgeous natural resources.

Everyday of my trip I was surrounded by undeniable evidence of America’s underlying health and incredible prosperity. Everywhere I went people were living in good homes, driving new cars and monster pickup trucks and playing with powerboats, motorcycles and snowmobiles. Roads and bridges and parks and main streets were well maintained. Litter and trash were scarce. Specific towns and regions were hurting, and too many people were out of work, but it was still the same country I knew.

I didn’t seek out poverty or misery or pollution on my journey, and I encountered little of it. The destitute and jobless, not to mention the increasing millions on food stamps, on welfare or buried in debt, were especially hard to spot in a generous country where taking care of the less fortunate is a huge public-private industry – where even the poor have homes, cars, wide-screen TVs and smart phones.

I saw the familiar permanent American socioeconomic eyesores – homeless men sleeping on the sidewalks of downtown San Francisco at noon, the sun-bleached ruins of abandoned gas-stations on Route 66, ratty trailer homes parked in beautiful locations surrounded by decades of family junk. I saw Butte’s post-industrial carcass, New Orleans’ struggling Upper Ninth Ward and towns that could desperately use a Japanese car plant.

But the country as a whole was not crippled or even limping. In the fall of 2010, nine in 10 Americans who said they wanted jobs still had them. The one in 10 who were jobless had 99 weeks of extended unemployment benefits and more than 90 percent of homeowners were still making their mortgage payments.

Most of the states I shot through – including Maine, northern New Hampshire and Vermont, upstate New York, Wisconsin, Minnesota, North Dakota, Montana – had unemployment and foreclosure rates well below the national averages.

I didn't visit the abandoned neighborhoods of poor Detroit. I didn’t see battered Las Vegas, where 14.5 percent of the people were unemployed and one in nine houses – five times the national average – had received some kind of default notice in 2010. But I spent almost two weeks in the Great Train Wreck State of California, where jobless and foreclosure rates were higher than the national average and municipal bankruptcies loomed.

America had 140 million more people than it did in 1960, but from coast to coast it was noticeably quiet – as if half the population had disappeared. Despite perfect fall weather, public and private golf courses were deserted. Ball fields were vacant. Parks and highway rest stops and ocean beaches were barely populated. Except for metropolises like Manhattan and San Francisco and jumping college towns like Missoula and Northampton, people in throngs simply did not exist. I went through lots of 30-mph towns that looked like they’d been evacuated a year earlier.

As I drove what’s left of the Old Steinbeck Highway – U.S. routes 5, 2, 1, 11, 20, 12, 10, 101 and 66 – it was obvious many important changes had occurred along it since 1960. Industrial Age powerhouses like Rochester, Buffalo and Gary had seen their founding industries and the humans they employed swept away by the destructive winds of technology and global capitalism. Small towns like Calais in northeastern Maine had lost people and jobs, and vice versa.

New Orleans had shrunk by half, and not just because of Katrina. The metro areas of Seattle, San Francisco and Albuquerque had exploded and prospered in the digital age. The populations of the West Coast and the Sunbelt had expanded since 1960. The South had shed its shameful system of apartheid and its overt racism, as well as much of its deep-rooted poverty and ignorance. The Northeast had bled people, manufacturing industries and its once overweening role in determining the nation’s political and cultural life.

Change is inevitable, un-stoppable, pervasive. Nevertheless, it was clear that a great deal of what I saw out my car windows had hardly changed at all since Steinbeck and his French poodle Charley raced by.

He saw more farmland and fewer forests than I did, especially in the East. But in many places I passed through almost nothing was newly built. Many farms and crossroads and small towns and churches were frozen in the same place and time they were eons ago, particularly in the East and Midwest.

In Maine the busy fishing village of Stonington was as picturesque as the day Steinbeck left it. He’d recognize the tidy farms of the Corn Belt and the raw beauty of Redwood Country and the buildings if not the people of the Upper Ninth Ward. And at 70 mph whole states – North Dakota and Montana – would look the same to him except for the cell towers and Pilot signs staked out at the interstate exits.

Steinbeck didn’t like a lot of things about Eisenhower America – sprawl, pollution, the rings of junked cars and rubbish he saw around cities. And he lamented – not in “Charley” but in letters to pals like Adlai Stevenson – that he thought America was a rotting corpse and its people had become too soft and contented to keep their country great and strong.

But Steinbeck had America’s future wrong by 178 degrees. Fifty years later, despite being stuck in an economic ditch, the country was far wealthier, healthier, smarter and more globally powerful and influential than he could have imagined. Its air, water and landscapes were far less polluted. And, most important, despite the exponential growth of the federal government’s size and scope and its nanny reach, America in 2010 was also a much freer place for most of its 310 million citizens, especially for women, blacks, Latinos and gays.

You don’t have to be a libertarian to know America is not as free as it should be. But there’s no denying that today our society is freer and more open than ever to entrepreneurs, new forms of media, alternative lifestyles and ordinary people who want to school their own kids, medicate their own bodies or simply choose Fed Ex instead of the U.S. Post Office.

As for the stereotypical complaints about America being despoiled by overpopulation, overdevelopment and commercial homogenization, forget it. Anyone who drives 50 miles in any direction in an empty state like Maine or North Dakota – or even in north-central Ohio or Upstate New York – can see America’s problem is not overpopulation. More often it’s under-population. Cities like Butte and Buffalo and Gary have been virtually abandoned. Huge hunks of America on both sides of the Mississippi have never been settled.

From Calais, Me., to Pelahatchie, Miss., I passed down the main streets of comatose small towns whose mayors would have been thrilled to have to deal with the problems of population growth and sprawl.  If anyone thinks rural Minnesota, northwestern Montana, the Oregon Coast, the Texas Panhandle or New Orleans’s Upper Ninth Ward have been homogenized, taken over by chains or destroyed by too much commercial development, it’s because they haven’t been there.

The America I traveled was unchained from sea to sea. I had no problem eating breakfast, sleeping or shopping for road snacks at mom & pop establishments in every state. The motels along the Oregon and Maine coasts are virtually all independents that have been there for decades. You can go the length of old Route 66 and never sleep or eat in a chain unless you choose to.

Steinbeck, like many others have since, lamented the loss of regional customs. (I don’t think he meant the local “customs” of the Jim Crow South or the marital mores of the Jerry Lee Lewis clan.)  I didn’t go looking for Native Americans, Amish, Iraqis in Detroit, Peruvians in northern New Jersey or the French-Canadians who have colonized the top edge of Maine.  But I had no trouble spotting local flavor in Wisconsin’s dairy lands, in fishing towns along Oregon’s coast, in the redwood-marijuana belt of Northern California, in San Francisco’s Chinatown or the cattle country of Texas.

Not to generalize, but the New York-Hollywood elites believe the average Flyover Person lives in a double-wide or a Plasticville suburb, eats only at McDonald’s, votes only Republican, shops only at Wal-Mart and the Dollar Store, hates anyone not whiter than they are, speaks in tongues on Sunday and worships pickup trucks, guns and NASCAR the rest of the week.

Those stereotypes and caricatures are alive and well in Flyover Country. But though I held radical beliefs about government, immigration and drugs that could have gotten me lynched in many places, I never felt I was in a country I didn’t like or didn’t belong in. Maybe I just didn’t go to enough sports bars, churches and political rallies, but for 11,276 miles I always felt at home.

Bill Steigerwald, born and raised in Pittsburgh, is a former L.A. Times copy editor and free-lancer who also worked as a docudrama researcher for CBS-TV in Hollywood before becoming a reporter for The Pittsburgh Post-Gazette and a columnist for The Pittsburgh Tribune-Review. He recently retired from daily newspaper journalism.

Urban Housing: A Master Plan for the Few

$
0
0

How we, as a nation, find bounty and beauty in the future depends upon how we react to two trends emerging from the recent difficult period in American urbanism. The first of these trends is the increasing lack of affordability in mainstream urban America, with the costs of maintaining a middle-class lifestyle at a level where distinct have/have-not lines are now drawn. The second is the increasing authoritarianism in mainstream urban America, where decisions about how our cities function are guided by a new array of authority figures that represent the common good. Both trends point to a disempowerment of a vast section of the American population.

Our loss of housing affordability is an insidious development that will continue to eat away at the urban triumphalism that marked the beginning of this century. Generation Xers, seniors on fixed incomes and the struggling middle class will have much in common during the coming decade, with fewer and fewer housing solutions designed for them. If half of our consumer goods are purchased by the top ten percent, then the rest of us are increasingly irrelevant in terms of goods, and services, as well as in housing,

Affordability on Main Street was once a concern of Wall Street. It was broadly known as Fordism, from the days when Henry Ford paid decent wages so that his workers could afford his new product, the car. Today, with Main Street on its knees, Fordism is dead and Wall Street turns more and more to itself, and to large, multinational conglomerates for profits. Volume generated by the middle class comes from a few companies like Apple, and, as the class shrinks, psychological distance between the haves and have-nots widens the gap, especially for those with memories of the material wealth they had in earlier days.

Solutions to the affordability gap in the urban realm are conspicuous by their absence. Desirable addresses, decent houses, and access to amenities are now the province of relatively few, who are serviced by those on the outside, commuting into town from less hip and trendy places. New residential housing, driven by the Wall Street investment community, is geared towards the market-rate. The linkage between mass transit and affordable housing has been deftly snipped apart by the investment community, where the topic of affordable housing generates a yawn.

Solutions? We might do well to investigate anti-urban trends, where peripheral and rural communities are stable and growing, and look at how these communities cope. Housing solutions like prefabricated units (think trailer parks, America’s answer to the favela) might be studied.

Non-affordability, as a trend, is strongly linked to a co-evolutionary partner that is driving a wedge between the haves and have-nots: an authority figure which has become a new interlocutor in of the urban conversation, a sort of urban do-gooder to save us from ourselves, pushing more requirements and accepting fewer improvisations. Affordable housing has less to do with the square footage that is in that space, and more to do with the ingredients found within the square footage.

The gloved hand of quasi-government authority has come to rest upon our cities with an increasingly tight grip, in the name of the green lobby or in the name of the traditional town.

Cities underwent rapid change in the fifties and sixties due to the car, and subsequently parking garages, commercial strips, suburbs and highway overpasses sprouted. All these developments facilitated growth and expansion. Americans were remarkably unsentimental about their historic urban fabric, and notably experimental about innovative technological solutions to remove obstacles to this growth.

Today, our confidence is shaken. The rise of authorities to dictate urban form signals that the era of innovation and improvisation is over, and that American cities are entering a new era of more rigid control of what gets built. The authority, in the form of a Master Plan, treats the city as if it were a vast, private land holding, and its citizens as if they were animals in a forest that was about to be developed.

Master Plans have already been passed in Denver, Philadelphia, and Miami, and are on the boards for other cities in 2013. When a developer Master-Plans his land, he relies upon a Master to create the vision for the land, and this Master – credentialed, experienced, and hopefully talented – sets out the form of the future construction. The Master may have a passing interest in the voices from the land itself – biologists who count endangered species, for example – but the overarching form comes out of his mind, and the developer then implements the plan.

When the same process is used upon a living, dynamic city, the results vary. Future citizens, bound by the edicts of this Master Plan, may submit to the Master’s vision, or, they may chafe at its restrictions. These Master Plans are formulated with great citizen input and collaboration until the time at which they are set. After that, they are to be obeyed. The plans create a physical model, or form; they are like a glove into which the city must fit its future hand.

Master Plans attempt to take all possibilities into account, while creating 'perfect' rules by which the city can grow. Physical order, it is hoped, will lead to social order, as buildings once again behave like they did before the car. Should the future evolve as the Master predicts, the glove will fit the grown-up hand However, the future is notoriously difficult to predict.

The new regulatory regime has become fashionable as citizens, sickened by the dirt and ugliness of our cities, seek an authority to keep us from temptation. As such, Master Plans arise from a noble intent not unlike the one held by city planners at the turn of the 20th century: to improve urban hygiene. And they may be correct in thinking that emulating urban form as it was before the car might just bring walkability back into fashion once again.

The future, however, is ephemeral and dynamic, not static like a Master Plan, and may become frustrating to the Master Planners who have created elaborate blueprints for our nation’s cities. America’s fluid economic situation is giving rise to in-home workplaces, negating the need for traditional office space. It is giving rise to in-home manufacturing, reducing the size and complexity of factories. Warehouses, in today's era of just-in-time-delivery, are being converted into other uses. And finally, Master Plans all seem to reminisce about Main Streets with lovely, tree-lined rows of shops under apartment (parking would be safely tucked in the back). These shops, renting for top dollar, stand empty today, made even more remote from reality with the advent of online retail.

In short, Master Plans that rigidly enforce an urban form of yesteryear may become next year’s white elephants. Cities bearing these master plans may find themselves with a regulatory burden that is reducing their desirability as places to live and work. Following these cities specifically, learning of their successes and failures, and analyzing how Master Plans are working will tell us a lot about the future.

As affordability is reduced and regulation increases, American cities could soon evolve into forms that are quite different from those of our past. And as confidence in the future fades, our cities take increasing comfort in the past, fossilizing our urban form as the Romans once did. For those underneath the affordability curve, improvisation and innovation will still continue, and insight into both of these emerging trends will yield a new sense of direction for the places where we live and work.

Richard Reep is an architect and artist who lives in Winter Park, Florida. His practice has centered around hospitality-driven mixed use, and he has contributed in various capacities to urban mixed-use projects, both nationally and internationally, for the last 25 years.

Flickr photo by alesh houdek: A walled and gated Miami home.

Is America's Future Progressive?

$
0
0

Progressives may be a lot less religious  than conservatives, but these days they have reason to think that Providence– or Gaia — has taken on a bluish hue.

From the solid re-election of President Obama, to a host of demographic and social trends, the progressives seem poised to achieve what Ruy Texeira predicted a decade ago:  an “emerging Democratic majority”.

Virtually all the groups that backed Obama — singles, millennials, Hispanics, Asians — are all growing bigger while many of the core Republican groups, such as evangelicals  and intact families, appear in secular decline.

And then, the Republicans, ham handed themselves, are virtually voiceless (outside of the Murdoch empire) in the mainstream national media.

Whatever the issue that comes up — from Hurricane Sandy to the Newtown shootings or the “fiscal cliffs” — the Republicans, congenitally inept to start with, end up being portrayed as even more oafish.

Not surprising then that progressive boosters feel the wind of inexorability to their backs. Red states, and cities, suggests Richard Florida are simply immature versions of blue state ones; progress means density, urbanity, apartment living and the decline of suburbs. Republicans, he argues, are “at odds with the very logic of urbanism and economic development.”

Yet I am not sure all trends are irredeemingly progressive. For one thing, there’s this little matter of economics. What Florida and the urban boosters often predict means something less progressive than feudalist. The Holy Places of urbanism such as NewYork, San Francisco, Washington DC also suffer some of the worst income inequality, and poverty, of any places in the country.

The now triumphant urban gentry have their townhouses and high-rise lofts, but the service workers who do their dirty work have to log their way by bus or car from the vast American banlieues, either in peripheral parts of the city (think of Brooklyn’s impoverished fringes) or the poorer close-in suburbs. This progressive economy works from the well-placed academics, the trustfunders and hedge funders, but produces little opportunity for a better life for the vast majority of the middle and working class.

The gentry progressives don’t see much hope for the recovery of blue collar manufacturing or construction jobs, and they are adamant in making sure that the potential gusher of energy jobs in the resurgent fossil fuel never materializes, at least in such places as New York and California. The best they can offer the hoi polloi is the prospect of becoming haircutters and dog walkers in cognitively favored places like Silicon Valley. Presumably, given the cost of living there, they will have to get there from the Central Valley or sleep on the streets.

Not surprisingly, this prospect is not exciting many Americans. So instead of heading for the blue paradises, but to lower-cost, those who move now tend towards low-cost, lower-density regions like Dallas-Fort Worth, Houston, Atlanta, Austin, Charlotte and Raleigh. Even while voting blue, they seem to be migrating to red places. Once there, one has to doubt whether they are simply biding their time for Oklahoma City to morph into San Francisco.

In this respect, the class issue so cleverly exploited by the President in the election could prove the potential Achilles heel of today’s gentry progressivism. The Obama-Bernanke-Geithner economy has done little to reverse the relative decline of the middle and working class, whose their share of national income have fallen to record lows. If you don’t work for venture-backed tech firms, coddled, money-for-nearly-free Wall Street or for the government, your income and standard of living has probably declined since the middle of the last decade.

If the main focus of progressives was to promote upward mobility, they would deserve their predicted political hegemony. But current-day leftism is more about style, culture and green consciousness than jobs and opportunity. It’s more Vogue’s Anne Wintour than Harry Truman. Often times the gentry agenda — for example favoring higher housing and energy prices — directly conflicts with the interests of middle and working class families.

The progressive coalition also has little to offer to the private sector small business community, which should be producing jobs as they have in the wake of previous recessions but have failed to do so this time. A recent McKinsey study  finds that small business confidence is at a 20 year low, entrepreneurial start-ups have slowed, and with it, the innovation that drives an economy from the ground up.

These economic shortcomings are unlikely to reverse themselves under the Obama progressives. An old Democrat of the Truman and Pat Brown, perhaps even Bill Clinton, genre would be pushing our natural gas revolution, a key to blue-collar rejuvenation, instead of seeking to slow it down. They would be looking to raise revenues from Wall Street plutocrats rather than raise taxes on modestly successful Main Street businesses. A HUD interested in upward mobility and families would be pressing for more detached housing and dispersal of work, not forcing the masses to live in ever smaller, cramped and expensive lodgings.

Over time, the cultural identity and lifestyle politics practiced so brilliantly by the President and his team could begin to wear thin even with their core constituencies.  Hispanics, for example, have suffered grievously in the recession — some 28%  now live in poverty, the highest of any ethnic group.

It’s possible that the unnatural cohesion between gentry progressives and Latinos will tear asunder. For one thing Hispanics seek out life in suburbs with homes and backyards, and often drive more energy-consuming cars that fit the needs of family and work, notably construction and labor blue collar industries — all targets of the gentry and green agenda.

Arguably the biggest challenge for the blue supremacists may prove the millennials, a group I have called the screwed generation. They have been vulnerable in a torpid recovery following a deep recession since they depend on new jobs or having their elders move to better ones; more than half of those under 25 with college degrees are either looking for work or doing something that doesn’t require tertiary education.

For now, millennials — socially liberal, ethnically diverse and concerned with economic inequality — naturally tilt strongly to the President. Their voting power continue to swell as they enter the electorate. As Morley Winograd and Mike Hais have demonstrated, if they remain, as they predict, solidly Democratic, the future will certainly be colored blue.

But this result is not entirely assured. Now that the first wave of millennials are hitting their thirties, they may not want to remain urban Peter Pans, riding their bikes to their barista jobs, as they age. A growing number will start getting married, looking to buy homes to raise children. The urban developers and gentry progressives may not favor this, preferring instead they remain part of “generation rent”  who remain chained to leasing apartments in dense districts.

And then there’s the economy. What happens if in two or four years, millennials find opportunity still lagging?  Cliff Zukin, at Rutger’s John J. Heidrich Center for Workforce Development, predicts the young generation will “be permanently depressed and will be on a lower path of income for probably all their life”. One has to wonder if, at some point, they might rebel against that dismal fate. Remember the boomers too once tilted to the left, but moved to the center-right starting with Reagan and have remained that way.

Of course, the blues have one inestimable advantage: a perennially stupid Republican party and a largely clueless, ideologically hidebound conservative movement. Constant missteps on issues like immigration and gay rights could keep even disappointed minority or younger votes in the President’s pocket. You can’t win new adherents by being the party of no and know-nothing. You also have to acknowledge that inequality is real and develop a program to promote upward mobility.

Unless that is done, the new generation and new Americans likely will continue to bow to the blue idols, irrespective to the failures that gentry progressivism all but guarantees.

Joel Kotkin is executive editor of NewGeography.com and is a distinguished presidential fellow in urban futures at Chapman University, and contributing editor to the City Journal in New York. He is author of The City: A Global History. His newest book is The Next Hundred Million: America in 2050, released in February, 2010.

This piece originally appeared at Forbes.com.

Barack Obama photo by Bigstock.

The Evolving Urban Form: Bangkok

$
0
0

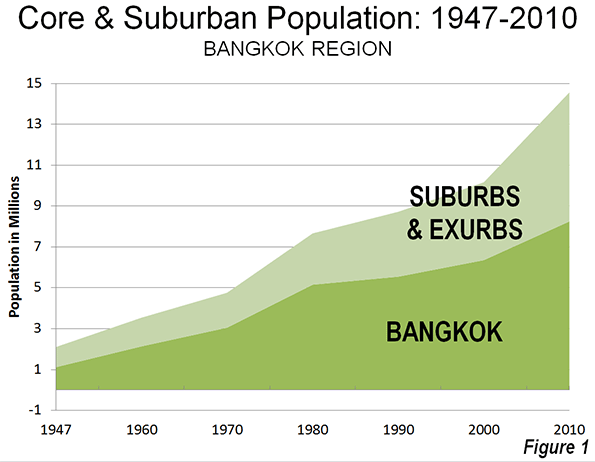
Since 2000, the Bangkok region has experienced annual population growth 2.5 times the rate of growth from 1980 to 2000. By 2010, the Bangkok region – which includes the provincial level city of Bangkok and the provinces of Samat Prakan, Samut Sakhon, Pathum Thani, Nonthaburi and Nakhon Pathom –  was nearing a population of 15 million (Note 1).

As is characteristic of urbanization in both developing and developed countries, much of Bangkok's recent growth has occurred outside the city, in suburban (and exurban) areas. Between 2000 and 2010, the city grew by 30%, while the suburban provinces grew more than twice as quickly, at 66%. The city's population growth was 1.9 million, while the suburban provinces added 2.5 million population (Figure 1).

Much of the urban expansion has been on the periphery both within the city of Bangkok and in the provinces of Samut Prakon to the east, Samut Sakhon to the west and Pathum Thani to the north. Unlike most cities in Asia, where new development has taken high-rise form, much of this new development has been townhouses and detached housing. (Photo: Detached housing).


Photo: Detached Housing in the Bangkok city eastern sector

The Urban Area

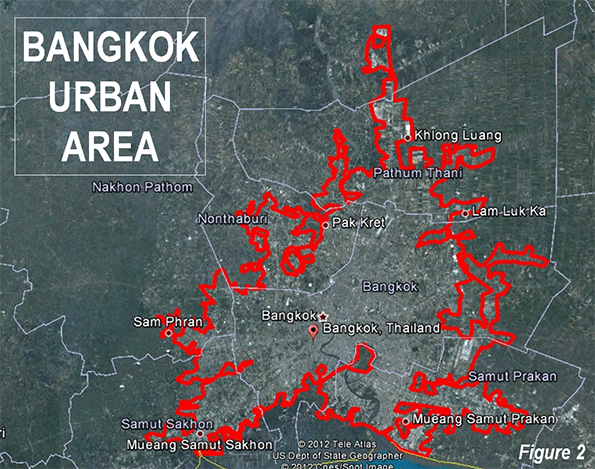
The urban area, or area of continuous urban (and suburban) development will reach 14.5 million residents in 2013, according to United Nations projections. The urban area (Figure 2) covers approximately 900 square miles (2,330 square kilometers) and has a population density of the urban area is 16,200 per square mile (6,200 per square kilometer). This is 1.5 times the density of the Paris urban areas and more than 2.5 times that of the Los Angeles. However, Dhaka (Bangladesh), the most dense urban area, is at least eight times as dense.

Bangkok's high density and inadequate road system combine to make Bangkok's traffic among the worst in the world. The Bangkok region is well served by freeways but government authorities have failed to provide the necessary arterial road (secondary road) infrastructure, as noted by Shlomo Angel, Stephen C. Sheppard, and Daniel L. Civco in a World Bank report (Note 2). As a consequence, they said that:

The cost of reducing congestion in Bangkok is now higher—by one or two orders of magnitude—from what it would have been had adequate rights-of-way been secured earlier.  

Bangkok is not the first urban area to have made this mistake. Atlanta's traffic congestion is substantially worsened by its failure to provide a proper arterial roadway system.

Bangkok's best chance of reducing its traffic congestion lies in the expansion of its underdeveloped arterial roadway system. Nonetheless, the scattered development has preserved opportunities to develop arterial roads cost effectively in some suburban areas. The siting of more commercial and employment growth in these areas would also help.

Some officials have suggested that expanded rapid transit would reduce traffic congestion. Bangkok has been expanding its small rapid transit system (as can be appropriate in very high density centers). There is little potential, however, for transit to reduce traffic congestion, as the intense traffic congestion and long commutes in cities well served with transit indicates (See photo at top and Note 3)

Suburban and Exurban Bangkok

Suburban expansion has been made possible by the increasing affluence of the Bangkok area, inexpensive land and house construction prices and the rising share of households with personal motorized vehicles (automobiles and motorcycles). Suburban dwellers are in the process of obtaining their own "Thai Dream" of home ownership, the popularity of which is demonstrated by the continuing draw of households to these rapidly developing areas.

Angel, et al noted that the Bangkok area had become “model of a well–functioning land and housing
market," and that:

Affordable and minimally–serviced land was brought into the market by the efficient creation of a minimal number of narrow tertiary roads that connected building plots to the existing road system; mortgages became widely available; and private developers went down–market in large numbers, selling land–and–house packages that were affordable for more than half the urban households.

Data from the Real Estate Information Centre of Thailand indicates that average new house prices remain similar in relation to average household income as a decade ago. By maintaining a competitive land market for new housing, Bangkok has retained housing affordability. 

However there are difficulties. Some suburban areas, particularly in Pathum Thani, were hard hit by the 2011 floods. There has been controversy on this issue, as governments, national and local have come under criticism for their failures to control the flooding. At a minimum, the failure of the Bangkok region governments to coordinate their efforts contributed to the seriousness of this disaster. Nonetheless, new house construction continues in the suburbs and exurbs.

The City ("Bangkok Metropolis")

The core city of Bangkok is a provincial level jurisdiction, referred to popularly as the "Bangkok Metropolis" (Note 4). Bangkok is not a compact city, however, covering 605 square miles (1.570 square kilometers). This is 15 times the land area of the ville de Paris and larger than either Houston or Los Angeles, two of the most geographically expansive municipalities in the United States.  

Beyond central Bangkok, the north, east and west sectors of the core city have experienced strong growth in detached and attached (row house or townhouse) construction.

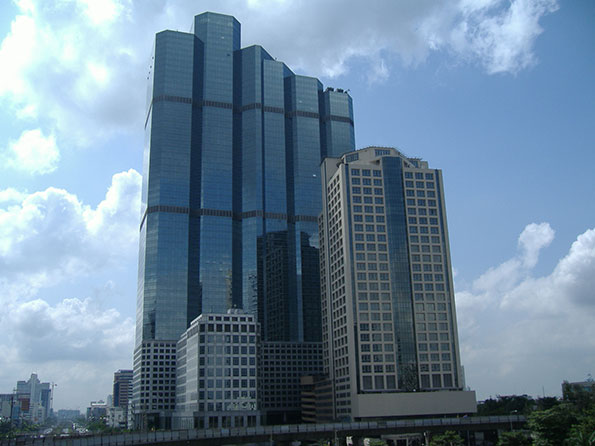
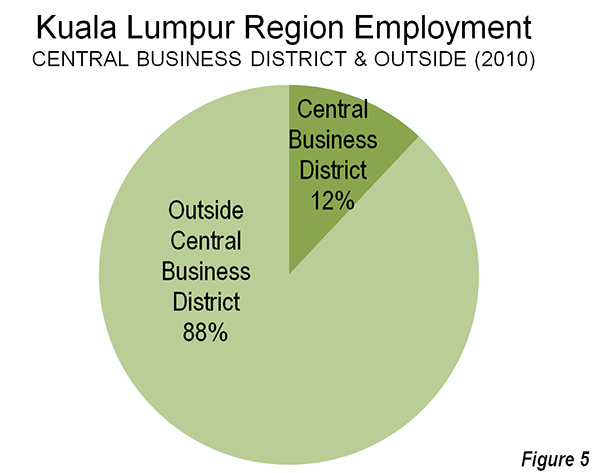
Bangkok's commercial core is dispersed, like many other Asian cities, in China and elsewhere.  Manila is every bit as polycentric as Los Angeles or Atlanta. Bangkok, however, may be the ultimate core dispersion. There are at least five areas of high-rise commercial concentration, and large office buildings are sprinkled throughout the large central area (Photo: Dispersed core development). The UITP Millennium Cities Database indicated that only 11 percent of employment was in the central business district in the middle 1990s. With the ongoing dispersion, this figure may be lower now.


Photo: Dispersed core development

An Economic Success

Bangkok residents live well compared to many living in other East Asian cities. Not only is their housing more affordable, but they have achieved much higher incomes. According to the most recent Brookings Global Metro Monitor, Bangkok has gross domestic product per capita of $23,400 annually (based on purchasing power). This is more than all but four of Latin America's metropolitan economies (Brasilia, Monterrey, Buenos Aires and Sao Paulo), according to the Brookings the data. If Bangkok were in China, its per capita GDP would rank in the top quarter  of metropolitan economies (Note 5).

Challenges Facing the Bangkok Region

Bangkok seems likely to continue to grow rapidly, simply because it is virtually the only "urban draw" in Thailand. None of the world's megacities (over 10 million population) is larger relative to other urban areas in the nation. Bangkok has more than 20 times the population of the next largest urban area in Thailand (Chon Buri). Strong population growth always presents formidable challenges for governments. The Bangkok region's principal tasks will be to retain housing affordability by ensuring a competitive land market, and by providing a road system that reduces its exceedingly long travel times.  

-----

Note 1: There has been confusion about the Bangkok region's total population. As late as 2009, the city of Bangkok projected the 2010 regional population, excluding Nakhon Pathom's fewer than 1 million population at 10.3 million. The population as counted in the 2010 census was 3.3 higher.

Note 2: Developers (and thus home buyers) pay for building the tertiary road systems that serve the new housing developments, similar to the practice in nations like the United States, Canada, Australia and New Zealand.

Note 3: This is illustrated by Tokyo and Hong Kong, which each have one-way work trip travel times of 46 minutes --- the longest reported in high-income world metropolitan areas. Tokyo has the world's largest transit system and Hong Kong has the highest average urban density in the high-income world. By contrast, Los Angeles, where transit carries a small share of travel, and which has much lower densities than Tokyo or Hong Kong, has a one-way average work trip travel time of 27 minutes.

Note 4: The city of Bangkok is a provincial level jurisdiction, formally called the Bangkok Metropolitan Administration. This use of the term "metropolitan" can be confusing, since much of the metropolitan area is outside the city (in between two and four other provinces, depending on the definition. This is similar to Tokyo and the former situation in Toronto. The prefecture of Tokyo is referred to as the "Tokyo Metropolis," which comprises barely one-third of the population of the Tokyo metropolitan area. Before the formation of the present city of Toronto, the regional authority was called the "Municipality of Metropolitan Toronto," however contained barely one half of the metropolitan area population. These semantic issues have been the source of considerable misunderstanding, not only by casual observers, but also by some academics.

Note 5: The ranking for Chinese metropolitan areas is adjusted in China, using the population figures from the 2010 census (which included the urban migrant population). The issue is described in Endnote 19 in the Brookings Global Metro Monitor.

Wendell Cox is a Visiting Professor, Conservatoire National des Arts et Metiers, Paris and the author of “War on the Dream: How Anti-Sprawl Policy Threatens the Quality of Life.”

------

Photo: Rapid transit and traffic congestion in Bangkok (all photographs by author)

“Livability” vs. Livability: The Pitfalls of Willy Wonka Urbanism

$
0
0

livability: (livable) fit or suitable to live in or with; “livable conditions”.

“Livability” has been a buzz word in city development for some time, and for good reason, as who doesn’t want livability, outside the zombie cohort? Things get hairy, though, when “livability”—as an economic development strategy—gets unpacked, because questions arise: “Livability” for whom? “Livability” at what cost?

Making a city “livable” these days largely means appealing to a select group of folks so as to form “an attractive economic place”. This notion of “livability” really came on in the late 1980’s, and was done under the presumption that certain cities offered higher quality of life, read: better lifestyles. For instance, in 1989 geographer David Harvey wrote that cities need to “keep ahead of the game [by] engendering leap-frogging innovations in life-styles, cultural forms, products, and service mixes…if they are to survive.” This was a radical departure from previous societal efforts to make quality of life a priority (think: pollution remediation) in that “life” was swapped out for “lifestyle”.

You could argue, then, that the original sin of “livability”-driven economic development begins right there. Namely, the emphasis will not be on the people of a city, but on potential consumers, particularly high-valued consumers with means, subsequently referred to as the “creative class”. As for creative class wants? They are, according to Richard Florida, “[an] indigenous street-level culture – a teeming blend of cafes, sidewalk musicians, and small galleries and bistros…” In this sense, the idea of “livability” gets precariously slimmed out.

Nonetheless, this thinking has penetrated mainstream economic development, with cities attempting to one-up each other in their want to attract a slice of the “livability” electorate. The consequences have become predictable: more comfort for some, less comfort for most.

***

Perhaps the city most famous for livability-driven economic development is Portland. It is America’s amenity apex, and a recent study showed it attracts the young by the boatload due to a certain leisure-lifestyle it affords.

For example, from a recent article entitled “(P)retirement’s new frontier”, the author interviews a 36-year old who is “underemployed on purpose”, as well as a couple who quit their jobs in Austin, sold their car, and have backyard chickens, yet now feel “much richer”. Such folks are referred to by economist Joe Cortright as “lifestyle entrepreneurs”. Part of this entrepreneurial output, touched on in the article, is a website called Badass that rates Portland neighborhoods for amenities like pinball machines, food carts, and access to bike lanes. At times the article reads like Portland was dreamed up by Willy Wonka.

Here, I half kid. From a description of the movie Charlie and the Chocolate Factory, notice the parallel themes: the Peter Pan motif, an escape from an unsatisfactory reality, and the promise of limitless sensory and savory experiences:

The Chocolate Room is designed to look like an outdoor landscape complete with trees, flowers and a waterfall, but Wonka has made the entire scene out of candy and chocolate. Charlie and the other children see some doll-sized human beings in the Chocolate Room, and Wonka explains they are Oompa-Loompas whom he saved from the dangerous country of Loompaland. The Oompa-Loompas agreed to work for Wonka and live in his factory in exchange for a safe home and an endless supply of their favorite food, cacao beans.


Courtesy of Knotworkshop

Swap out the over-educated and underemployed for the Oompa-Loompas, chocolate for lifestyle amenities, and the Chocolate Room for the concept of “Portland-as-place”, and you got yourself a sequel. But there are problems with such city building: it’s too often defined by the ephemera, or that “transitory matter not intended to be retained or preserved”. And while the ephemera aren’t building blocks to economic growth—but instead represent America’s tendency to fix hard structural deficits with the airy promises of the pleasure principle—they are nonetheless a main cog in the modern day city-making machine. From an article entitled “Placemaking Revolution: the powerful role of ephemera and the arts in our cities”:

Coletta addressed the question of how ephemeral events can have lasting impacts in cities. “I think you can do temporality with regularity. Some temporary events are so powerful that they stay in the memory for a long time, and spark the imagination.

But I would argue that now more than ever we need less fantasy in city building than we do reality—as reality can’t keep being handed off to folks who are unable to consume their way to imagining existence as anything but decidedly not livable.

***

“Livability” backlashes are becoming increasingly common across the country. For instance, a piece in Crain’s Chicago questions whether Chicago’s catering to the global creative class is worth the debt it is incurring, and whether the split between the amenity-rich rich neighborhoods and the amenity-poor poor neighborhoods is worth the investment, particularly given the record levels of violence that is tearing parts of the city to pieces. And while Mayor Emanuel’s bike-pathing of the City moves forward because “he wants all of [Seattle's] bikers”, libraries are closing, red light cameras are ubiquitous, taxes are rising, and the city has a police manpower shortage of 1,000 that can’t be plugged because there’s no money. In fact things are so desperate that the City recently turned to Twitter to fight crime.


Stop-The-Violence Campaign in Chicago. Courtesy of Metropolis Coffee

In New York, the President of NYU is under a vote of no confidence for his plans to extend the creative classification of the campus into Greenwich Village. And while this has been ongoing—for instance, one commenter in the bookWhile We Were Sleeping: NYU and the Destruction of New York”states“There are days when I feel like I’m stranded in some upscale mall in Pasadena”—the recent city-sanctioned plan to bulldoze and “mix use” a residential neighborhood for “livability” purposes in order to “attract ambitious students and faculty to sustain the region’s economic base and quality of life” has pushed faculty and the community over the edge.

Perhaps not coincidentally, the plan—and fight for it—comes at a time with Richard Florida joining NYU as a Global Research Professor, with the President commenting on the unison this way:

There is a certain symmetry here: Richard Florida is joining NYU…at a moment when the University has begun responding to the forces that give rise to his most trenchant insights.

Even in Portland, the “livability” backlash is present. A September 2012 article entitled “Portland’s livability conflicts: Contradictions of affluence and affliction” states:

With its tree-lined streets, bike paths and transit options, Portland is beautiful and very safe. But behind that facade, Portland is also a city of contradictions.

These contradictions, according to the author, involve the discordance brewing between the poverty and “alarmingly large number of hypodermic needle” situation on one hand, and the topographical layering of that “everything is fine” sheen that remains intact for many coming to seek it.

Others in the community are questioning the theory of livability-driven economic development in its own right. For instance, in a piece entitled “The Portland Question: Livability or Job Growth?”, the author notes the growing worries in the region as to the path Portland is on:

Last year, Portland’s own catalyst for economic change, the Portland Development Commission, warned that the city’s traditional focus on livability projects such as streetcars and housing had not delivered the job growth needed to stay competitive. That’s a strong statement considering that livability has become what largely defines Portland’s character.

***

Taken together, perhaps it’s time for city leaders and citizens alike to take stock in how cities are being made, and for whom the making is focused. In fact maybe it’s time to drop the “livability” gimmicks that define Willy Wonka urbanism–or to squeeze “the style” out of “lifestyle” so as to expose the highest priority, the highest necessity: which is life.

So, you wanna make your city “hot”? Then cook the irons of affordable housing, mobility, education, and solid jobs.

Or, you know: livability.

Richey Piiparinen is a writer and policy researcher based in Cleveland. He is co-editor of Rust Belt Chic: The Cleveland Anthology. Read more from him at his blog and at Rust Belt Chic.

Kauffman Performing Arts Center photo by Bigstock.


Demography as Destiny: The Vital American Family

$
0
0

Recent reports of America’s sagging birthrate ‑ the lowest since the 1920s, by some measures ‑ have sparked a much-needed debate about the future of the American family. Unfortunately, this discussion, like so much else in our society, is devolving into yet another political squabble between conservatives and progressives.

Conservatives, including the Weekly Standard’sJonathan Last, regularly cite declining birth and marriage rates as one result of expanding government ‑ and a threat to the right’s political survival. Progressives, meanwhile, have labeled attempts to commend a committed couple with children as inherently prejudicial and needlessly judgmental.

Yet family size is far more than just another political wedge issue. It is an existential one – essentially determining whether a society wants to replace itself or fall into oblivion, as my colleagues and I recently demonstrated in a report done in conjunction with Singapore’s Civil Service College. No nation has thrived when its birthrate falls below replacement level and stays there – the very level the United States are at now. Examples from history extend from the late Roman Empire to Venice and the Netherlands in the last millennium.

Falling birthrates and declining family formation clearly effect national economies. One major United States’  advantage has long been high birthrates, akin to a developing nation’s, as well as a vibrant family-oriented culture. This was largely because of immigrants and their children, striving first- and second-generation Americans. The United States, according to the U.S. Census Bureau, is expected to have a roughly 40 percent growth in its workforce in the first half of this century, largely thanks to immigration.

In contrast, the Census Bureau predicts that leading U.S. competitors, notably Japan, Europe and South Korea, will likely suffer a decline of 25 percent or more over that time. Even China, whose birthrate has dropped precipitously under its one-child policy and rapid urbanization, is expected to see a sharp drop in its labor force over the next decade.

Perhaps the greatest threat from collapsing fertility is the aging of society. Consider “the dependency ratio,” which measures the number of people in the workforce compared to retirees, in effect, how many working people are needed to support those over age 65. In 1960, before the decline in birthrates, that ratio was 9 percent in the 23 most developed countries. Today, it is 16 percent across these advanced countries. By 2030 it could reach as high as 25 percent.

Countries with the longest history of declines in fertility face the biggest fiscal crises. By 2050, for example, Germany and Singapore are predicted to have roughly 57 people above age 65 for every 100 workers. In the United States, this ratio will rise by 50 percent, to roughly 35 per 100 workers, even if the current decline is eventually reversed.

If birthrates continue to decline, Western nations may devolve into impoverished and enervated nursing homes. And without strong families, children are likely to be more troubled and less productive as adults.

You don’t need a crystal ball to see what this future could look like. Consider Japan. By 2050, there are expected to be three people above age 65 for every person in Japan under 15. In fact, more people are expected to be over 80 than under 15.

This demographic shift signals a kind of death sentence for that once thriving, but now declining, nation. Not only are Japanese couples having far fewer children, sociologist Mike Toyota notes, roughly one-third of Japanese women in their 30s are not getting married ‑ which, in that conservative society, essentially means they are unlikely to have children. Even teenagers, according to a recent government-commissioned study by the Family Planning Association, seem oddly indifferent to dating and sex.

Given the stakes, Americans must forgo political squabbles and focus on practical ways to remove barriers to marriage and child-rearing. One crucial component for strong birthrates is steady economic growth. Before the 2008 economic collapse, the U.S. fertility rate  was 2.12, the highest in 40 years. But the tumultuous economic problems since then have helped drive the fertility rate to 1.9 per woman, the lowest since the economic malaise era under President Jimmy Carter in the late 1970s.

Even amid increasing awareness of the country’s demographic problems, however, political extremes focus on their own ideological spin. Conservatives set their arguments in neo-traditionalist terms, embracing right-wing tropes against gay marriage and abortion while blaming expansive government and rampant individualism. Others on the extreme right link declining fertility rates, particularly among Caucasians, to what Pat Buchanan calls “the end of white America.”

Yet conservatives must recognize that fertility is not just a white or high-income Asian issue. Fertility and even marriage rates are, for example, declining throughout much of the Muslim Middle East, in some cases below our own levels, as my colleague Ali Modarres has shown.

Nor is “white America” likely to be demographically overwhelmed by the current dramatic influx of Latino immigrants, particularly Mexicans, as many on the far right insist. Within a generation, Mexican-Americans immigrants’ fertility rates decline to that of native-born U.S. citizens. In fact, as Mexico modernizes, its fertility rates are falling to U.S. levels.

Conservatives also seem to have a hard time admitting that one major culprit ‑ particularly in the United States and East Asian countries such as Singapore ‑ is modern capitalism. Young workers building their careers can face consuming demands for long work hours and substantial amounts of travel. Many confront a choice between a career and family.

“In Singapore,” Austrian demographer Wolfgang Lutz observes, “women work an average of 53 hours a week. Of course they are not going to have children. They don’t have time.”

For hard-pressed low-wage workers, raising children can be even harder. Indeed, much of the decline in child-rearing in the U.S. can be traced to a fall-off among immigrants, particularly Latinos, who fared particularly poorly in the long recession.

On the other side, many Democrats praise the rise of “singlism” ‑ demonstrated by  the women in their 40s who never had offspring. This cohort has more than doubled since 1976. Pollsters like Stan Greenberg hail single women as “the largest progressive voting bloc in the country,” and Ruy Texeira, a leading political scientist, asserts that singletons are critical to the “emerging Democratic majority.”

Progressives also embrace urban density ‑ a residential pattern that discourages child-rearing. Unlike the wave of immigrants or rural migrants who flooded the American metropolises of the early 20th century, urbanites today are not raising large families in cramped spaces. Instead, in virtually all high-income societies, high density today almost always translates into low marriage rates and fertility rates.

The causes of this radical change are diverse. But crucial reasons include decline of extended family support networks; erosion of traditional, often religiously based values; and a culture that celebrates individualism.

We no longer see family-centered urban neighborhoods like those depicted in the Chicago of Saul Bellow’s novel TheAdventures of Augie March. Instead, many urban centers today are among the most “child free” ‑ whether in Manhattan, San Francisco, inner London or Paris, Singapore, Hong Kong or Tokyo.

In contrast, America’s nurseries are in the suburbs, exurbs and lower-density greater-metropolitan areas. The metropolitan regions of Atlanta, Dallas-Fort Worth, Houston and Salt Lake City have above-average numbers of children. The percentage of children, according to the census, under age 15 in these cities is almost twice that of Manhattan or San Francisco.

Many progressives don’t seem to care much if the birthrate falls. Some green activists seem to actually prefer it –  perhaps viewing offspring, particularly in wealthy countries, as unwanted carbon emitters. They seem to have taken up the century-old Malthusian concerns about overpopulation and environmental ruin. “A whole lot of people don’t have kids BECAUSEthey’re worried about the future,” explains one critic of our report, suggesting that concern for the environment may justify the decision not to have children.

Before signing on to a low-fertility agenda, American progressives as well as conservatives might want to consider the long-term consequences. The long fertility-rate declines in Europe and Japan occurred as economic growth flagged. Diminishing expectations of the future, painfully evident in countries such as Spain, Italy and Greece, are now further depressing marriage and childbirth.

As to the culture wars between religious social conservatives and progressives, let’s declare a truce. Spiritual values and traditional families are precious resources to be nurtured. Mormons, evangelicals, practicing Catholics and highly self-identified Jews, all of whom largely favor big families, help make up for the almost certain continued expansion of single, and often childless, people.

Social conservatives also need to champion more than the narrowly defined“natural family.” Many children, whether because of divorce or diverse family circumstances, must look to someone other than their birth parents for nurturing. Adoptive parents, grandmothers, uncles or aunts or other sorts of extended-family units also need to be cherished as committed caregivers.

Popular TV shows like Modern Family show the wide range of family types today. The crucial element is that family obligation often extends well beyond “likes” and ties exist over generations. This can be true for gay couples or “blended families” in a way that can rarely be said of people who are dating, or friends, both of the real and Facebook variety.

Fortunately, the long-term prognosis is not all bad. Pew Research Center reports that the emerging millennial generation rank being good parents, owning a home and having a good marriage as their top three priorities. Generational chroniclers Morley Winograd and Mike Hais, in their book Millennial Momentum: How a New Generation is Remaking America, suggest that the younger generation is as family-oriented as their elders, albeit with a greater emphasis on shared responsibilities and more flexible gender roles.

“No matter how many communes people invent,” the anthropologist Margaret Mead once remarked, “the family always creeps back.” Let’s hope she’s right, not only about the past but the future as well.

Joel Kotkin is executive editor of NewGeography.com and is a distinguished presidential fellow in urban futures at Chapman University, and contributing editor to the City Journal in New York. He is author of The City: A Global History. His newest book is The Next Hundred Million: America in 2050, released in February, 2010.

This piece originally appeared at Reuters.

Baby photo by Bigstock.

New Geography's Most Popular Pieces of 2012

$
0
0

Here’s a list of the most popular pieces from 2012 here at NewGeography, our fourth full calendar year. Thanks for reading and happy 2013.

10. The Cities Where a Paycheck Stretches the Furthest In this piece from July, Joel Kotkin looks at average pay in U.S. metropolitan areas adjusted for regional cost of living based on my analysis of data from EMSI and C2ER. Since it ran, the table at the end of the piece has been updated with 2012 data. This piece also ran in Forbes.

9. The Export Business of California (People and Jobs) Wendell Cox quantifies the outmigration from California and outlines a few reasons why residents might be leavings.

8. America’s Future is Taking Shape in the Suburbs The evidence suggests that it’s not time to write off the suburbs just yet, according to this July Joel Kotkin piece. This piece also appeared at Forbes.

7. The New Geography of Success in the U.S. and the Trap of the “New Normal” Joel Kotkin suggests that all of the public discussion about a “new normal” of U.S. mediocrity may not be the case due to a few of America’s inherent competitive advantages. “The stories of the successful states tell us the key to success lies  in promoting basic industries like energy, agriculture and manufacturing — which then create business service and high-skilled jobs — combined with a broad agenda favorable to entrepreneurs of all kinds.” This piece also appeared in Forbes.

6. Sex (or Not) and the Japanese Single Edward Morgan explores the issue of sex and fertility and how it may affect the future of Japan.

5. The Unseen Class War that Could Decide the Presidential Election In August Joel Kotkin pointed out that the issue of class is one of the most important facing American policymakers. He points out that the “clerisy” of both parties has ignored upward mobility and the needs of the “yeomanry.” This piece also appeared in Forbes.

4. After the November election, Joel Kotkin argued that the nation may be in for a future similar to the current state of California in the piece, “For a Preview of Obama’s America in 2016, Look at the Crack-up of California.” This piece also appeared in Forbes.

3. World Urban Areas Population and Density Wendell Cox’s summary of population data on the world’s urban areas has become a popular resource for readers looking for population data in search engines.

2. Is California the New Detroit? In August Robert Cristiano called out California political leaders about the state of the state: “The beaches are still beautiful. The mountains are still snow capped and the climate is still the envy of the world. Detroit never had that. But will California’s physical attributes be enough?”

1. Best Cities for Jobs 2012 Articles Our Best Cities Rankings measure short-, medium-, and long-term employment growth in the nation’s metropolitan areas and metropolitan divisions. We keep the measure simple on purpose: to offer an indicator of which regions are changing the fastest.

Mark Schill is a community strategist and analyst with Praxis Strategy Group and New Geography's Managing Editor.

California’s Blue Utopia

$
0
0

The Progressive wing of the Democrat Party sits at the left end of their spectrum. JFK’s liberal positions would be regarded as moderate today. Progressives have a unique vision of what a blue state utopia would look like that begins with clean air, clean water, and green energy. Over the last twenty years, with the backing of the public employee unions that control the political process in California, the Progressives have managed to neuter the Republican Party and turn California Blue, owning every elective office in the state. They did not need much help according to Dan Walters, who stated, “Even the most anti-immigrant, anti-gay marriage, anti-tax, anti-abortion Republican activist must now recognize that with the party's wipeout in last month's elections, continuing down its recent path is a plunge into complete irrelevance”.

In 2012, the progressive Democrats captured a super majority in both houses so that with their Progressive governor, they no longer require a single Republican vote to pass any form of legislation, leaving conservatives an “irrelevant” minority.  As an independent businessman, I have created many jobs and opportunities. But despite my contributions to society, and the taxes I have paid over the last thirty plus years, the Progressives believe I need to pay more so that I pay “my fair share.” Only when I pay my fair share can their blue vision of utopia be fulfilled.

What is my fair share? Under existing Federal and State income tax rates, I will pay 50% of my income in taxes. In California alone, my “fair share” on a million dollars of income is $133,000 each year. In exchange for my taxes, I receive little from the state. In addition, I pay gasoline taxes that pay for the upkeep of the highways. I pay airline taxes that maintain the airports I use. I pay among the highest in the nation sales tax on what I consume. I pay property taxes for the schools my grown children no longer use (they have already left California). I pay utility taxes for the upgrade of infrastructure. I pay higher health insurance rates. I already pay more than my own way.

I used to develop new homes in California and paid development fees, school fees, park fees, bridge & thoroughfare fees, endangered species fees, utility hook up fees, and processing fees to employ the city workers who reviewed my plans. Such fees totaled $40,000 to $75,000 for each new home built in California. I more than paid my own way. Such new homes are no longer feasible in California considering that home prices have fallen between 20-40% since 2008. And with the new regulations to be imposed in 2013 with the passage of the Global Warming Solutions Act of 2006, housing and energy will cost even more making new houses even less attractive than they are now.

A problem in Blue Utopia

The number 1 topic of conversation amongst the despised 1% in California today is when you are leaving California or whether you can leave. Property owners who cannot move their apartment building or office complexes can move their homes and change their residency. On a flight from Austin, Texas to Orange County last week, I sat next to the owner of a substantial manufacturing business whose plant is in the inland southern California community of Ontario. He lives in Austin, flies in on Monday and home on Thursday. He spends less than 180 days a year in California. His savings in state income taxes more than pays for his airfare, hotel and rental car expenses. His home and gas and energy all cost less in Texas. More significantly, he will not expand his plant in California and intends to move his plant and people to Texas over the next five years.

What do the progressives have to say about a successful businessman wanting to move out of the state? Some like Paul McCloskey who recently attempted to pass a ballot measure for a Wealth Tax imposed on those leaving the state, would like to follow the French. France imposed a 75% tax rate on anyone making more than one million Euros per year. France’s Prime Minister Jean-Marc Ayrault said about people leaving France for lower rates, “We cannot fight poverty if those with the most, and sometimes with a lot, do not show solidarity and a bit of generosity," McCloskey’s proposal would impose an additional 17.5% tax on those with incomes exceeding $150,000 ($250,000 joint) and 35% on incomes exceeding $350,000/year. He would use the extra income to purchase shares of California public companies to “influence their environmental policies and practices”. While his ballot measure did not succeed, it is sobering to think the Democrats do not need a single Republican vote to pass legislation such as this.

So many of the 1% are quietly leaving. The exodus has already begun. Spectrum Location Solutions reported that 254 companies left California in 2011. Despite claims of an upturn, a press release by the State Controller’s office last week revealed tax revenues from both personal income taxes and corporate taxes fell during the month of this November. Revenue from personal income dropped 19 percent below projections while corporate tax revenue was down a whopping 213.4 percent. Such declines will continue unabated for years to come as the California brain drain proceeds.

When a government becomes a one-party state, nothing can stop the utopians and zealots of either party. In California, there’s no brake on progressives imposing its vision of Blue Utopia on its people.   California may have clean water, clean air and green energy but at the expense of its people, prosperity and fiscal health.

The problems in Blue Utopian society will be similar to the unintended consequence of protecting the Delta Smelt in the Central Valley. The Blues labeled this tiny fish, previously known as “bait,” as an endangered species. The Endangered Species Act was created to protect the American Bald Eagle but now extends protection for the Delta Smelt, forcing water to be diverted from the farms of the Central Valley to the Pacific Ocean. The Delta Stewardship Council shows the water cutoffs had no effect on the smelt population. But it did a devastating effect on another endangered species: the California family. When 300,000 acres went fallow, 37,000 jobs were lost. Unemployment has reached 40% in some areas of the Central Valley. Food lines have appeared in the world's most fertile agricultural valley. Farmworkers were forced to accept bags of carrots grown in China. Orchards that existed for decades died without water. The Central Valley now needs food stamps to feed its residents.  

The Blues are excited to impose their vision of Utopia on California. I, for one, will not be here to see it. My home goes on the market next month. My company has already re-located to another state. My children have already moved away seeking a future more promising than anticipated here in California. It is ironic because that is why I left my parents in Cleveland, Ohio to come to California four decades ago. I will be sad to leave my home and friendships acquired over decades. But I realize our leaders will neither notice, and if they did, they would not care. 

As the tax revenues continue to fall (as they always do when rates increase), the Blues will rail against the remaining 1%, claiming that if only “they” would pay their fair share, things would be perfect. They will raise rates, fees, costs, and penalties again on the business class, and will do so as long as they hold power.

But there is a problem in Blue Utopia. Short term, the state may be supported by the occasional Internet or Housing Bubble, but the money will finally run out.  When it does, maybe they will ask us to come back to the Golden State. They will promise to lower rates and turn the water back on. But it is already too late for the dead orchards of the Central Valley. And it will soon be too late for all but a handful of entrepreneurs of California.

¨¨¨¨¨¨¨¨¨¨¨¨¨¨¨

Robert J Cristiano PhD is the Real Estate Professional in Residence at Chapman University in Orange, CA, a Senior Fellow at the Pacific Research Institute in San Francisco, CA and President of the international investment firm, L88 Companies LLC in Washington DC – Newport Beach – Denver - Prague. He has been a successful real estate developer in California for more than thirty years and now makes his home in Austin, Texas.

California coast photo by BigStockPhoto.com.

The Drive-It-Yourself Taxi: A Smooth Ride?

$
0
0

Despite a corporate sponsor that paid handsomely for the naming rights, Londoners stubbornly refer to our bikesharing system as ‘Boris Bikes’, in a nod to our colourful Mayor, Boris Johnson. But what will we call our new drive-it-yourself taxis? My suggestion: ‘Boris Cabs’ – and they are now a reality here, thanks to Daimler’s car2go service, if you happen to live in one of three small and separate sections of town. But why did a one-way carsharing system have to limp into London, when more than a dozen other cities have welcomed these arrangements with open arms? In the US, car2go first appeared in Austin, Texas, and since then has moved into Washington, D.C, Miami, Portland Oregon, San Francisco, San Diego, and Seattle. It operates in Canada and, on the Continent, in Paris and Amsterdam, among other locations. So why no splashy launch across England's Capital, and no images of a smiling Boris cutting a ribbon?

First, roads in London are balkanised. Our regional transport agency (Transport for London) runs the main arteries, and they provide little on-street parking, the mother’s milk of one-way carsharing. That leaves the local streets in the the domain of the 33 boroughs that are each independent municipalities. Car2go is making a brave attempt to get off the ground here by starting with hundreds of cars (the press release reports 500; in practice,170 are in operation two weeks after the launch) in disconnected sections of town, something it has not resorted to anywhere else. Its standard practice is to strike a city-wide deal with whoever’s in charge of on-street parking, and no single agency fits that bill here. What’s the rush? Well, BMW is hot on their heels with its competing DriveNow system, with staff in London well into the advanced stages of planning.

Second, there is genuine uncertainty about the impacts". Will we take drive-it-yourself cabs to work, and avoid the crush on the Tube? It would be a very different experience than traditional carsharing — London is said to be Zipcar’s second-biggest market after NYC — which doesn’t work for the daily commute. In the Zipcar model (soon to be the 'Zipcar by Avis' model?) you take a car on a round-trip basis and pay by the hour, like filling a parking meter. The novelty of this new generation of drive-yourself cabs lies in their flexibility: as with a taxi meter, you pay by the minute for just the time it takes you to get from ‘A’ to ‘B’, then drop the car off and forget about it.

What does this mean for traffic congestion? CO2 emissions? What about the cute blue-and-white Smart Fortwo-model cars now parked in your neighbourhood – will they mean less parking for private car owners? Not bloody likely. The expectation is that, in time, enough private car owners will switch to using the fleet’s cars, meaning that on balance fewer cars will need to be parked. But try explaining this to car2go’s new neighbours who are not familiar with the subtleties and will be the ones dealing with the growing pains as we feel our way forward.

Transport is a long game, so it will be years until we properly understand the impacts of drive-yourself cabs. My research suggests that likely impacts are:

1) A much larger market than traditional carsharing (about four times as many subscribers)
2) A roughly 4% reduction in personal car ownership
3) About a 1% decrease in car driving vehicle miles travelled (including personal cars, traditional carsharing, and drive-yourself cabs)
4) About a 1% decrease in the number of public transport journeys

We can be reasonably certain that some surprising impacts will be revealed during field trials, and if at some future point London’s authorities are not happy with the knock-on effects there’s nothing to stop us from regulating the industry like any other. But for the moment we don’t understand it well enough to do anything other than let the operators experiment and keep tabs on what’s happening.

We just don’t know what the impacts on traffic levels and CO2 will turn out to be, and, frankly, it’s unfair to – as some suggest – hold the industry to a no-net-traffic/CO2 standard. We don’t do that to Black Cabs or [advance-booking-only] minicabs, or indeed to the automotive or urban transport sectors more broadly. A fairer standard, admittedly more complex to administer, would be to assess whether net value is created after accounting for effects on traffic levels, emissions and more. In other words: get the prices right, just like the economics textbooks say.

The question that needs thinking through is what would transport in London look like if drive-yourself taxi systems went viral and we came to depend on them. What happens, for instance, when instead of 500 of these cabs there are 50,000, and the necessary communication links go down? How would the transport system work if on-road congestion became replaced by virtual queuing to get access to a car? And what about times when the system is under stress, like when a hurricane is approaching, for instance. Is it OK to just flip the switch off on the whole fleet? Who would make this decision, and what guidelines would they follow?

If the history of the car in cities has taught us anything, it is that we need to be humble about our ability to forecast the future. So what is the way forward for Boris Cabs in London? Start with a small fleet and short-duration contracts. Be clear on the objectives and flexible on the implementation. Keep our options open. It will be an interesting ride.

Scott Le Vine, AICP is a research associate in transport systems at Imperial College London and a trustee of the shared-mobility NGO Carplus, which serves as the UK’s carsharing trade body. He authored the recent study Car Rental 2.0: Car club [carsharing] innovations and why they matter.

Flickr photo: Car 2 Go in the 1700 block of Q Street, NW, Washington DC on Easter Sunday, 8 April 2012 by Elvert Barnes Photography

California's Poor Long-term Prognosis

$
0
0

California's current economic recovery may be uneven at best, but things certainly look better now than the pits-of-hell period in 2008. A cautiously optimistic New York Times piece proclaimed "signs of resurgence," and there was even heady talk in Sacramento of eventually sighting that rarest of birds, a state budget surplus.

Yet such outbreaks of optimism should not blind us to the bigger issue: the long-term secular decline of the state's economy. Whether you believe that the new higher taxes may now slow our growth, as my colleagues at Chapman University now believe, or right the fiscal ship, as is widely hoped in the blue California press, it's more important to look more at the long-term trends, and assess where we stand compared with our domestic competitors.

California, despite its enormous natural and human resources, is losing ground in most basic areas. Its unemployment rate, a still-horrendous 10 percent, stands as the nation's third-highest. This is not a new development or the product of a run of bad luck. The state's unemployment rate has been consistently above the national average for almost all of the past 20 years. Most interior counties, including the Inland Empire and the Central Valley, now suffer unemployment rates well into the double digits, with some approaching 15 percent.

Overall, the state is still down a half-million jobs during the recession. California's losses since its employment peak have been considerably above the national average, some 3 percent, far worse than the 2.3 percent erosion seen nationwide. Despite the modest recent uptick, the California Budget Project projects the state would need to add twice as many jobs per month to fully recover from the recession by the summer of 2015.

Other long-term trends confirm the state's secular decline in competitiveness. Take per capita income – a decent indicator of relative progress. In 1945, journalist John Gunther, writing his famous "Inside USA," gushingly described California "the most spectacular and most diversified American state ... so ripe, golden." At the time, the state boasted the third-highest per capita income in the nation. As late as 1980, the state still ranked fourth. Today, despite Silicon Valley's money machine, California has fallen to 12th and appears headed for further decline.

Despite hopes in Sacramento and in the media, high-tech alone can not bail out the state. The much hoped-for windfall around the time of the Facebook IPO has failed to produce the expected fiscal bonanza for the state treasury. Silicon Valley famously gets nearly half the country's venture capital, but its impact on the rest of the state has diminished. In the 1980s and 1990s, tech booms stretched prosperity throughout its surrounding regions and as far as Sacramento. Now it barely covers half the Bay Area; unemployment in Oakland remains at around 13 percent and one child in three lives in poverty.

Part of this reflects the shift from an industrial high-tech focus to one fixated on software and social media. Given the extraordinary ease with which support and even research operations can be moved, once companies start to grow, they easily head to India, China or over to lower-cost locales like Utah or Texas. "Sure, we are getting half of all the venture capital investment but in the end we have relatively small research and development firms only," observes Jack Stewart, president of the California Technology and Manufacturing Association. "Once they have a product or go to scale, the firms move elsewhere. The other states end up getting most of the middle-class jobs."

This can be seen in the long-term trends in STEM (science, technology, engineering, mathematics-related) jobs. Over the past decade, even with the current bubble, Silicon Valley's STEM employment, according to estimates by Economic Modeling Specialists Inc., has increased by a mere 4 percent over the past decade. In contrast, science-based employment jumped 25 percent in Seattle, 20 percent in Houston and 16.8 percent in Austin, Texas.

The tech scene in the Los Angeles Basin is doing even worse. STEM employment in the Los Angeles-Santa Ana area is still stuck below 2002 levels, partially a residue of the continued decline of the region's once-globally dominant aerospace industry. The region, once arguably the world's largest agglomeration of scientists and engineers, has now dipped below the national average in proportion of STEM jobs.

Far greater problems can be seen further down the economic food chain, where many working-class and middle-class Californians traditionally have been employed. The state's heavy industry – traditionally the source of higher-paid blue-collar employment – has missed out on the nation's broad manufacturing resurgence. Over the past 10 years, according to an analysis by the Praxis Strategy Group, California has ranked 45th among the states in terms of heavy metal job creation, losing 126,000 jobs – more than 27 percent; San Francisco-Oakland ranked last among 51 large metropolitan areas. Both Los Angeles-Orange and San Bernardino ranked in the bottom 10.

Despite hype about "green jobs," the immediate prospect for a big manufacturing turnaround is not bright. Because of its high energy costs and other regulatory costs, industrial investment has dried up in California. According to the California Technology and Manufacturing Association, California in 2011 did not even make the top 10 states in terms of new industrial investment, accounting for a paltry 2 percent. This was about one-third or less the share garnered by rivals such as Texas, North Carolina and rebounding "rust belt" states, like Pennsylvania.

Construction, another pillar of higher-paid blue-collar employment, has recovered a bit but remains in worse shape than elsewhere. Overall, the state has lost almost 300,000 construction jobs from the 2007 peak, an almost 40 percent loss compared with 29 percent for the country as a whole.

Even the trade sector, stalwart performer in producing high-wage jobs, may soon be declining. Recent labor disputes by highly paid, politically powerful California port workers – shutting down operations for eight days in Los Angeles and Long Beach – has reinforced the notion that the state's an increasingly unreliable place to do business. After peaking around 2002, our ports are watching growth shift to the Gulf ports, such as Houston, and to the ports of the south Atlantic. The challenge will become far greater once the Panama Canal is widened in 2014 to accommodate larger ships from Asia.

California is also squandering its chance to participate in a potential fourth source of basic employment, the massive expansion in domestic oil-and-gas production. The Golden State sits on potentially the largest gusher in the nation – the Monterey Formation is now estimated to be four times as rich in oil as North Dakota's Bakken Formation. But our green consciousness dictates we don't exploit our resources too much. In the past decade, Texas created some 200,000 generally high-paying energy jobs, while greener-than-thou California has generated barely one-tenth as many.

As a result, wealthier, older, whiter, generally better-educated coastal areas can recover, but the prospects are dismal the further you head into the increasingly Latino, younger and less-educated inland areas. You have flush times for venture capitalists and celebrities, but growing poverty elsewhere. For at least two decades California's poverty rate has remained higher than the national average. Now, notes a new Census estimate, the Golden State has a poverty rate of more than 23 percent, the highest in the country, something unthinkable a generation ago.

Clearly, progressive policies are having socially regressive effects. Over the past few years the state, as a recent Public Policy Institute of California study demonstrates, has become ever substantially more unequal than the rest of the nation. Typical California middle-income workers have seen their median wage, adjusted for inflation, decline 4.5 percent since 2006, and now is at the lowest level since 2008. Only the highest-paid workers have avoided a decline in earnings.

Fortunately, the elements to regain our former broad-based prosperity are still in place. The critical human assets are there: entrepreneurs, hardworking immigrants, top universities. We boast advantages from legacy industries – entertainment and fashion to technology and agriculture. And, perhaps most importantly, California retains its remarkable natural blessings of massive energy resources, fertile soil and a benign climate.

The imperative now is to take fuller advantage of all these blessings in the coming years. Otherwise California will become poorer, more socially bifurcated and relegated by other places to the proverbial "dustbin of history."

This piece first appeared in the Orange County Register.

Joel Kotkin is executive editor of NewGeography.com and is a distinguished presidential fellow in urban futures at Chapman University, and contributing editor to the City Journal in New York. He is author of The City: A Global History. His newest book is The Next Hundred Million: America in 2050, released in February, 2010.

The Dispersion of Financial Sector Jobs

$
0
0

When you think of financial services, one usually looks at iconic downtowns such as New York’s Wall Street, Montgomery Street San Francisco's or Chicago’s LaSalle Street. But since the great financial crisis of 2007-8 the banking business is on the move elsewhere. Over the last five years (2007 to 2012), even as the total number of financial jobs has declined modestly, they have been growing elsewhere.

This is the conclusion of an analysis of data supplied by Moody's Analytics for an article in The Wall Street Journal ("Meet Them in St. Louis: Bankers Move). This analysis adjusts the data provided by Moody's Analytics, combining portions of metropolitan areas (called "metropolitan divisions")into their complete metropolitan areas (See Note 1).

The financial sector tends to be comparatively concentrated. In 2007, approximately one-third of the financial sector jobs reported by Moody's were located in the New York metropolitan area. New York is the home of one of world's largest financial sector hubs, Manhattan.

New York: Financial Sector Employment Losses and Dispersion

However, the New York metropolitan area and the other four largest concentrations of financial sector jobs – New York, Chicago, Boston, Los Angeles and San Francisco – accounted all of the net job losses over the period. Between 2007 and 2012, the five largest financial sector markets, lost 39,000 jobs. Outside these five metropolitan areas, the number of financial sector jobs increased by 12,000 (Figure 1).

The extent of this dispersal away from the five most concentrated markets is illustrated by the decline in their financial sector jobs compared to the other metropolitan areas. In 2007, the five most concentrated markets had 32,000 more financial sector jobs than the other metropolitan areas. By 2012, the other metropolitan areas achieved a total number of 19,000 more financial sector jobs than the five most concentrated markets (Figure 2).

The dispersion of financial sector jobs is evident even within the New York area itself. The central metropolitan division of the New York metropolitan area (New York-White Plains-Wayne), which includes Manhattan, lost 19,000. However, the balance of the New York metropolitan area experienced a 2500 increase in financial sector jobs, resulting in a overall loss of 16,500 jobs in the metropolitan area

Not all of the New York metropolitan area jobs were lost to places like Dallas-Fort Worth and Des Moines. The balance of the New York combined statistical area (formerly called consolidated metropolitan statistical areas) added 2000 jobs, principally in the Bridgeport (Fairfield County, Connecticut) metropolitan area (Figure 3). Thus, while the core of the New York metropolitan area was losing 9 percent of its financial sector jobs, the more suburban balance of the combined area gained 11 percent, even as the total region lost employment.

California: Substantial Financial Sector Employment Losses

However, New York's percentage losses paled by comparison to those in the Los Angeles (Los Angeles and Riverside-San Bernardino) and San Francisco combined (San Francisco and San Jose) statistical areas. The losses in the Los Angeles area were 21 percent, while in the San Francisco area the losses reached 17 percent. The losses in Los Angeles and San Francisco regions exceeded that of the New York combined statistical area, which had three times as many financial sector jobs in 2007. San Diego also experienced a 5percent job loss, while Sacramento's loss was miniscule. Overall, California lost 17 percent of its financial sector jobs between 2007 and 2012.

Texas: Gaining Financial Sector Employment

The large metropolitan areas of Texas and did better. Dallas-Fort Worth, Houston, San Antonio and Austin added 5400 financial sector jobs, an increase of 14 percent (Figure 4).

Metropolitan Area Performance

St. Louis added 5,600 financial sector jobs, the most of any single metropolitan area (Figure 5). The Washington area added 4,400, followed by Phoenix (3,900), Dallas-Fort Worth (2,600) and Bridgeport (2,000). New York, as mentioned above, lost 16,500 financial sector jobs, the most of any individual metropolitan area (Figure 6). Boston had the second largest loss (8,300), followed by Los Angeles (6,800), Miami (4,800) and San Francisco (4,400).

The metropolitan areas with the largest percentage gains include net job leader St. Louis which grew 85 percent (Figure 7). Phoenix gained 36 percent, Washington 28 percent, Tampa-St. Petersburg 18 percent and Dallas-Fort Worth 14 percent. Des Moines, which had only 1,400 financial sector jobs in 2007 had the largest percentage gain, at 96 percent.

Miami had the largest loss, at 27 percent (Figure 8). Charlotte, having risen to prominence with its large banks may have been in the wrong place at the wrong time, losing 24 percent of its financial sector jobs, followed by Boston and Los Angeles (19 percent) and San Francisco (17 percent).

Dispersing to Lower Density Areas

The data is not sufficiently precise to distinguish between central business district, urban core and suburban trends. However, the metropolitan areas with high density historical core municipalities (above 10,000 persons per square mile or 4,000 per square kilometer in 2010), suffered a loss of 35,000 financial sector jobs between 2007 and 2012, more than the total national metropolitan loss of 27,000. The six high density historical core municipalities (Note 2) include New York, Chicago, Philadelphia Boston, San Francisco and Miami all suffered significant losses while the metropolitan areas with less dense cores gained 9,000 financial sector jobs (Figure 9).

Further, the losses were concentrated in the metropolitan areas with the four most dense major urban areas, Los Angeles, San Francisco, San Jose and New York and the losses in these areas exceeded the overall industry loss. This movement away from density reinforces the often misconstrued conclusions of the Santa Fe Institute Urban Scaling research to the effect that metropolitan area size was a principal determinant of productivity, however not urban density (see: Density is Not the Issue: The Urban Scaling Research). Larger, less dense regions did far better --- for example Houston, Dallas and St. Louis --- than their more dense rivals.

Dispersion to Housing Affordability

There is also a strong trend of financial sector job gains where housing is more affordable and job losses where housing is less affordable. This is indicated by the median multiple (median house price divided by gross median household income) data from the 8th Annual Demographia International Housing Affordability Survey (Table below).


Demographia International Housing Affordability Survey

Housing Affordability Rating Categories

Rating

Median Multiple

Severely Unaffordable

5.1 & Over

Seriously Unaffordable

4.1 to 5.0

Moderately Unaffordable

3.1 to 4.0

Affordable

3.0 & Under


Metropolitan areas rated as affordable (median multiple 3.0 or lower) gained 9,300 financial sector jobs between 2007 and 2012. Metropolitan areas rated moderately unaffordable (median multiple 3.1 to 4.0) gained 2,600 jobs. The metropolitan areas with the most unaffordable housing suffered a net loss in financial sector jobs. Seriously unaffordable (median multiple 4.1 to 5.0) metropolitan areas lost 3,700 jobs. Metropolitan areas rated seriously unaffordable (median multiple 5.1 or higher) lost 35,000 jobs. This is more than the overall loss reported in the data of 27,000 (Figure 10).

Financial Sector Jobs: Reflecting Urban Dispersion

The dispersion of financial sector jobs away from concentrated areas may come as a surprise, given the close association that the industry has with the largest central business districts. Yet, the trend mirrors the more general, but overwhelming trends of dispersion indicated over the last decade in both population and domestic migration.

Wendell Cox is a Visiting Professor, Conservatoire National des Arts et Metiers, Paris and the author of “War on the Dream: How Anti-Sprawl Policy Threatens the Quality of Life.”

------

Note 1: The data used in this analysis is limited to that provided in The Wall Street Journal article. Data was provided for only is only for a part of the Boston metropolitan area (the Boston-Quincy metropolitan division).

Note 2: In 1940, at least 15 of the historical core municipalities had population densities exceeding 10,000 per square mile (4,000 per square kilometer)

Photo by Flickr user IABoomerFlickr

Globalization: Too Many Americans Are Dropping Under the Radar

$
0
0

By the time I arrived in Silicon Valley in 1986 California's middle class economy was already being remade by globalization. Globalization's dramatic impact on northern California hit me square in the face the moment I arrived at my first career expo later that year at the Westin Hotel in Santa Clara. There I found myself surrounded by a multitude of H‑1B workers from all over the world, excitedly speaking in a myriad of languages. I was staggered. Born in the U.S.A., I felt like a foreigner in the land of my birth.  

In this new Pacific Rim "promised land," an American-born engineer residing in Palo Alto would need four or five times his annual salary to purchase the same home his father had gotten with only two. Valley infrastructure was not keeping up with the expanding population and the inevitable supply-demand dynamic was rapidly dividing the middle class into winners and losers. The winners would enjoy at least a 4-bed/3-bath/2-car home and early retirement; the losers would compete for tiny 1-bed condos. This trend has not only continued but is escalating across a variety of benchmarks—both in the Valley and all over America.
Now, let's get close to the ground and see if we can find who's been dropping under the radar.

Some Are Hot, But Most Americans (Particularly White Males) Are Not

Half of Silicon Valley's technology workforce is now Asian, and many come from abroad. This was already the case among software development engineers back in 1990 when I was working for Consilium. Hispanics, Latinos, and African-Americans are all losing ground, though not as quickly as whites.

US taxpayers have unknowingly funded a training program called JEEP to train foreign Asian students for jobs in some booming career fields such as offshore call centers that serve US businesses. As a result, according to Congressman Tim Bishop (D-New York), American workers have lost some five hundred thousand jobs in just five years.

Last November figures obtained from inside IBM seemed to indicate that for the first time more of the tech giant's workforce would be employed in India than in the US. Of IBM's total global workforce of 430,000 less than one quarter now work in the US. IBM benefits from the hefty difference in employee salaries, which can amount to as much as $100,000 per year.

All this cost-cutting from H-1B work visas, outsourcing, and offshoring is having a leveling impact on US wages, including among technology specialists such as software development engineers and project managers—even though new technology developments continue at a breathtaking pace.

Age-Related Losers, Old and Young

When I arrived, you could see how youth-obsessed 80s Silicon Valley was. It still is, only more so. In her article Silicon Valley's Dirty Secret: Age Bias, Sarah McBride details a number of cases of age-related bias that show how much tougher it is for the over-40 techie to find her next job than for the 20s person, even from another country. I know Age-bias first-hand. One day in 2002, while a technical writer for startup E2open, I was confronted by two young  engineers: "What's an over-40 dude doing here—aren't you retired yet?"

It's not just Silicon Valley anymore. A 2012 United States GAO report noted that   "…long-term unemployment has particularly serious implications for older workers (age 55 and over). Job loss for older workers threatens not only their immediate financial security, but also their ability to support themselves during retirement."

Think you're too young to worry about age? Think again. Even pretty young women might not be quite good enough in the brave new world. In 2011, clothing giant H&M reported that they are now using "perfect" virtual models—not real humans—for their online shopping site.

Globalization's Broadband Impact on America

InThe Slow Disappearance of the American Working Man, Bloomberg Businessweek Magazine (Aug. 2011) highlights the particularly devastating impact on the American male worker.

  • "The portion of men who work and their median wages have been eroding since the early 1970s."
  • "The portion of men holding a job—any job, full or part-time—fell to 63.5 percent in July 2012."
  • "These are the lowest numbers in statistics going back to 1948."
  • "Among the critical category of prime working-age men between 25 and 54, only 81.2 percent held jobs."
  • "To put those numbers in perspective, consider that in 1969, 95 percent of men in their prime working years had a job."
  • "After accounting for inflation, median wages for men between 30 and 50 dropped 27 percent"…putting them "back at their earnings capacity of the 1950s."

In Race Against the Machine (2011) MIT’s Erik Brynjolfsson and Andrew McAfee show how jobs formerly enjoyed by the median US worker are now being lost to cutting-edge technologies. Artificial Intelligence (AI) is to today's white collar STEM worker what robotics was to many blue collar workers.   We were already advancing this trend at Oracle in 1990 with the development of our SQL*Forms application generator, obviating the need for thousands of application developers.

A number of disturbing statistics indicate that US workers are now both producing and earning less.
The Central Intelligence Agency World Factbook ranks the United States 11th in the world in GDP per capita. We used to be number 1. This figure indicates that while rich Americans keep getting ever richer, the middle class is producing less and less per capita. The US-born middle class worker keeps on sinking.

A recent National Employment Law Project report indicates that the current "recovery" continues to be slanted toward low-paying jobs, reinforcing the mounting inequality s. The fastest growing low-wage jobs include retail salespeople, food prep workers, waiters and waitresses, laborers and freight workers, office clerks and customer representatives, and personal and home care aides—mostly paying median hourly wages between $7.69 and $13.83 per hour. Is this America's new path to "prosperity?"

The Organization for Economic Co-operation and Development (OECD) reports, amazingly, that the United States actually has a higher percentage of workers doing low-wage work than any other major industrialized nation:

The Future: Dimmest for the Brightest, Brightest for the Dimmest?

Last year a NY Times article covered the appalling plight of recent college grads. Half of today's graduates are jobless or underemployed. They are more likely to be employed in jobs not requiring a college diploma—such as receptionists, cashiers and food-service helpers—than as engineers, physicists, or computer professionals.

And while Americans are busy paying for US corporations to move work to Asia, US federal employment accounts for the entire net increase in jobs since at least 2008. Washington's cure to de-industrialization of the US has been to expand government payrolls. But is the creation of more and more "security" jobs and unnecessary bureaucracy the proper cure for persistent unemployment and swelling welfare rolls?

Where Do We Go From Here?

All of the benchmarks point to the unavoidable conclusion that ever more Americans are simply dropping under the economic radar screen. This includes some very broad downtrends for American workers of all races; "older" workers; young workers who perform work that robotics and AI are learning to do more cost-effectively; the American male workforce and  middle income workers in general; and even recent college graduates. With neither the free market or   government helping very much the message seems quite clear: globalization's losers must get organized and work together for improved economic opportunity.

Rob Argento is a senior technical writer and project leader with a background in aerospace engineering and some 18 years in Silicon Valley with Oracle, Xerox, Microsoft, and Sony. His broad industry experience includes NASA, e-commerce, US Navy, Biotech, and PC Games. He has degrees in physics and theological studies.

Global population photo by Bigstock.


The New Places Where America's Tech Future Is Taking Shape

$
0
0

Technology is reshaping our economic geography, but there’s disagreement as to how. Much of the media and pundits like Richard Florida assert that the tech revolution is bound to be centralized in the dense, often “hip” places where  “smart” people cluster. Some, like Slate’s David Talbot, even fear the new tech wave may erode whatever soul is left to increasingly family free, neo-gilded age San Francisco.

Such claims have been bolstered by the tech boom of the past few years — especially the explosion of social media firms in places like Manhattan and San Francisco. Yet longer-term trends in tech employment suggest such favored media memes will ultimately prove well off the mark. Indeed, according to an analysis by the Praxis Strategy Group, the fastest growth over the past decade in STEM (science, technology, engineering and mathematics-related) employment has taken place not in the most fashionable cities but smaller, less dense metropolitan areas.

From 2001 to 2012, STEM employment actually was essentially flat in the San Francisco and Boston regions and  declined 12.6% in San Jose. The country’s three largest mega regions — Chicago, New York and Los Angeles — all lost tech jobs over the past decade. In contrast, double-digit rate expansions of tech employment have occurred in lower-density metro areas such as Austin, Texas; Raleigh, N.C.; Columbus, Ohio; Houston and Salt Lake City. Indeed, among the larger established tech regions, the only real winners have been Seattle, with its diversified and heavily suburbanized economy, and greater Washington, D.C., the parasitical beneficiary of an ever-expanding federal power, where the number of STEM jobs grew 21% from 2001 to 2012, better than any other of the 51 largest U.S. metropolitan statistical areas over that period.

The question is whether the last two to three years, during which places like San Francisco, New York and Boston have enjoyed stronger STEM growth than their peripheries, represents a paradigm shift or is just a cyclical phenomenon. As with tech in general, the long-term trends are not so city-centric; over the past decade,  the core counties nationwide overall have lost about 1.1% of their tech jobs while more peripheral areas have experienced a gain of 3.5%.

Today’s urban tech boom looks a lot like a rerun of the dot-com boom of the late 1990s. In that period media-savvy dot-com startups proliferated in such places as South of Market in San Francisco and the Silicon Alley in lower Manhattan. At their height, these firms and their founders were as likely to be covered in the fashion and lifestyle sections as on the business pages.

Yet by the early 2000s, many of these dot-com darlings had merged, been acquired or simply gone out of business. Anchored largely on hype, they fell victim to flawed business models, and rapid industry consolidation.  In San Francisco, for example, tech employment crashed from a high of 34,000 in 2000 to barely 18,000 four years later. Silicon Alley suffered a similar downward trajectory, losing 15,000 of its 50,000 information jobs in the first five years of the decade.

The peaking social media boom, marked by the weak performance of Facebook’s IPO last year, suggest another bust at the end of the “hype cycle.” Urban darlings such as  San Francisco’s Zynga and Chicago’s Groupon have floundered in spectacular fashion. More are likely to join them.

These firms may have generated buzz, but they have done not so well at the mundane task of making money. One problem may be that  the most avid users of social media are largely young people from the “screwed” generation who lack much in the way of spending power — a clear turnoff to advertisers. Now , with venture capital flows declining overall,  cooler heads in the Valley are shifting bets to more business-oriented engineering and research-intensive fields more grounded in marketplace realities.

And what about the future of the Valley — still home to virtually all the Bay Area’s top tech firms? Its glory days as a job generator and economic exemplar seem to have passed. Between 1970 and 1990 the number of people employed in tech in the Valley more than doubled to 268,000, and then burgeoned to over 540,000 in the 1990s. At the peak of the last tech boom in 2001, the unemployment rate in Santa Clara County was a tiny 3%; the Silicon Valley Manufacturing Group confidently predicted there would be another 200,000 jobs by 2010.

However, at what may be the peak of the current boom, the number of tech jobs in the Valley remains down from a decade ago and unemployment is over 7.7%, just around the national average. In reality, social media was never going to reverse the downward trajectory in the rate of job growth. Old-line companies like  Hewlett-Packard or Intel, with over 50,000 employees in the U.S. alone, were capable of creating a broad range of opportunities for workers; in contrast, the social media big three of Facebook, LinkedIn and Twitter together have less than 6,500 employees.

As the social media industry matures and consolidates,   employment is likely to continue shifting to less expensive, business-friendly areas. The Bay Area, where the overall cost of living is 68% higher than the national average and housing is the most expensive in the nation, may continue to attract and retain only the highest-end, best-paid workers. But for the most part they will follow the path of established tech firms such as  Apple, Intel, Adobe, eBay and IBM  to lower-cost places like Austin, Columbus and Salt Lake City. A similar phenomena also can be seen in other urban-centered industries, such as entertainment and finance where  virtually all employment growth is in places like St. Louis, Des Moines and Phoenix, even as the largest centers, New York, Chicago, Boston, Los Angeles and San Francisco have suffered significant job losses.

Demographic forces may further accelerate these trends. The critical fuel for tech growth, educated labor, is now expanding faster in places like Columbus, Austin, Raleigh, Dallas and Houston than in Boston, San Jose and San Francisco. The old centers may still enjoy a lead in brains, but other places are catching up rapidly.

Companies may also discover that with many millennials starting to hit their 30s, some may seek to leave their apartments to buy houses and start families. In California new local regulations essentially ban the construction of new single-family homes in some of the state’s biggest metro areas, pricing this option out of reach for all but a few, and forcing a key demographic group to seek residence elsewhere.

Under these conditions, Silicon Valley will be forced to rely increasingly on inertia and mustering of financial resources than innovation. As a result, the nation’s tech map will continue to expand from the Bay Area, Boston, Seattle and Southern California to emerging metropolitan areas in North Carolina, Texas, Utah, Colorado and the Pacific Northwest. In the future parts of Florida, Phoenix, and even Great Plains cities like Sioux Falls and Fargo could also achieve some critical mass.

Ultimately, one of the main dynamics of the information age — that even sophisticated tasks  can be done from anywhere — works against the dominion of single hegemonic industry centers like Wall Street, Hollywood and Silicon Valley. The tech sector is particularly vulnerable to declustering, due in large part thanks to the freedom from geography created by technologies of its own making.   Silicon Valley may continue to reap riches from the periodic technology  gold rush , but in the longer term, tech growth will continue its long-term dispersion to ever more parts of the country.


STEM Occupations in the Nation's 51 Largest Metropolitan Areas
MSA Name2001 - 2012 Growth2005 - 2012 Growth2010 - 2012 Growth2012 Location QuotientLQ Change, 2001 - 2012
Washington-Arlington-Alexandria, DC-VA-MD-WV21.1%12.7%3.7%2.1910.6%
Riverside-San Bernardino-Ontario, CA18.6%-1.4%2.2%0.571.8%
San Antonio-New Braunfels, TX18.3%17.2%4.5%0.831.2%
Baltimore-Towson, MD17.9%11.4%3.9%1.3715.1%
Raleigh-Cary, NC17.9%14.6%6.2%1.530.0%
Las Vegas-Paradise, NV17.2%-2.6%0.8%0.524.0%
Salt Lake City, UT16.3%18.1%7.4%1.164.5%
Houston-Sugar Land-Baytown, TX15.7%17.2%6.6%1.20-2.4%
Seattle-Tacoma-Bellevue, WA15.4%22.2%6.7%1.868.1%
Jacksonville, FL13.0%6.5%2.4%0.878.7%
Austin-Round Rock-San Marcos, TX12.2%17.2%9.1%1.82-8.5%
San Diego-Carlsbad-San Marcos, CA11.3%8.0%2.1%1.386.2%
Columbus, OH10.4%12.8%4.7%1.277.6%
Orlando-Kissimmee-Sanford, FL9.4%-1.1%0.8%0.84-3.4%
Indianapolis-Carmel, IN6.9%6.5%2.7%1.042.0%
Nashville-Davidson--Murfreesboro--Franklin, TN6.7%3.5%2.4%0.77-1.3%
Sacramento--Arden-Arcade--Roseville, CA6.4%3.5%0.4%1.332.3%
Oklahoma City, OK5.5%9.6%6.4%0.89-1.1%
Pittsburgh, PA5.3%10.3%4.9%1.075.9%
Virginia Beach-Norfolk-Newport News, VA-NC4.8%2.3%0.5%1.103.8%
Charlotte-Gastonia-Rock Hill, NC-SC4.3%8.2%5.7%0.99-3.9%
Kansas City, MO-KS4.0%5.8%4.6%1.124.7%
Richmond, VA3.8%4.4%3.4%0.990.0%
Cincinnati-Middletown, OH-KY-IN3.7%5.5%6.8%1.024.1%
Buffalo-Niagara Falls, NY3.2%6.4%3.6%0.904.7%
Dallas-Fort Worth-Arlington, TX3.1%11.4%5.5%1.19-5.6%
San Francisco-Oakland-Fremont, CA2.5%15.0%9.9%1.635.8%
Phoenix-Mesa-Glendale, AZ2.3%3.5%3.9%1.05-6.3%
Minneapolis-St. Paul-Bloomington, MN-WI2.2%6.7%5.9%1.311.6%
Portland-Vancouver-Hillsboro, OR-WA1.6%6.4%5.4%1.19-3.3%
Louisville/Jefferson County, KY-IN0.9%9.6%6.9%0.760.0%
Denver-Aurora-Broomfield, CO0.5%10.8%3.7%1.43-2.1%
Atlanta-Sandy Springs-Marietta, GA-1.0%5.5%6.5%1.07-2.7%
Boston-Cambridge-Quincy, MA-NH-1.3%11.2%6.0%1.64-1.2%
Providence-New Bedford-Fall River, RI-MA-1.5%-1.6%1.9%0.882.3%
Philadelphia-Camden-Wilmington, PA-NJ-DE-MD-2.8%-1.4%1.4%1.06-1.9%
Hartford-West Hartford-East Hartford, CT-4.5%1.5%0.3%1.10-3.5%
New York-Northern New Jersey-Long Island, NY-NJ-PA-4.6%2.8%3.2%0.90-6.2%
St. Louis, MO-IL-4.8%-1.7%1.4%1.05-0.9%
Milwaukee-Waukesha-West Allis, WI-6.1%-0.8%4.0%1.000.0%
Tampa-St. Petersburg-Clearwater, FL-6.3%-4.3%2.5%0.89-3.3%
Miami-Fort Lauderdale-Pompano Beach, FL-6.4%-8.3%0.6%0.67-8.2%
Los Angeles-Long Beach-Santa Ana, CA-7.1%-3.5%3.1%0.98-5.8%
Memphis, TN-MS-AR-7.3%-4.0%0.7%0.62-4.6%
Cleveland-Elyria-Mentor, OH-8.8%-2.1%4.3%0.891.1%
Chicago-Joliet-Naperville, IL-IN-WI-10.8%-1.4%3.5%0.87-7.4%
Birmingham-Hoover, AL-11.4%-8.0%-2.0%0.76-8.4%
Rochester, NY-12.0%-2.1%4.1%1.14-10.2%
San Jose-Sunnyvale-Santa Clara, CA-12.6%12.4%8.3%3.18-4.8%
New Orleans-Metairie-Kenner, LA-16.0%-7.4%-2.4%0.740.0%
Detroit-Warren-Livonia, MI-17.7%-10.3%10.5%1.42-3.4%
Analysis by Mark Schill, Praxis Strategy Group
Data Source: EMSI 2012.4 Class of Worker - QCEW Employees, Non-QCEW Employees & Self-Employed 

The LQ (location quotient) figure in the table above is the local share of jobs that are STEM occupations divided by the national share of jobs that are STEM occupations. A concentration of 1.0 indicates that a region has the same concentration of STEM occupations as the nation. The analysis covers 80 STEM occupations in all industries.

Joel Kotkin is executive editor of NewGeography.com and a distinguished presidential fellow in urban futures at Chapman University, and a member of the editorial board of the Orange County Register . He is author of The City: A Global History and The Next Hundred Million: America in 2050. His most recent study, The Rise of Postfamilialism, has been widely discussed and distributed internationally. He lives in Los Angeles, CA.

This piece originally appeared at Forbes.com.

Computer engineer photo by BigStockPhoto.com.

The Evolving Urban Form: Kuala Lumpur

$
0
0

The Kuala Lumpur region of Malaysia is generally defined by the state of Selangor and two geographical enclaves (the federal territories of Kuala Lumpur and Putrajaya), carved from the state. These enclaves are the two seats of the federal government. Kuala Lumpur houses the national parliament and Putrajaya the executive and judicial branches.

Population Growth in the Kuala Lumpur Region

The Kuala Lumpur region had a population of approximately 7.1 million, according to the 2010 census. This includes 1.6 million in the federal territory (core city) of Kuala Lumpur and 5.5 million in the suburbs (which include Putrajaya). The region has experienced strong growth since modern Malaysia evolved between 1957 and 1963. In 1950, the region had only 900,000 residents. By 1980, the population had more than doubled to nearly 2.4 million and by 2010, the population had tripled from its 1980 level.

Unlike many urban cores, the city of Kuala Lumpur continues to experience strong population growth. Since 1980 (the first census after the creation of the new territory), the city has experienced a population increase of 77 percent.

Yet, the suburbs and exurbs (Note 1) have grown far more rapidly. The suburbs and exurbs have grown 280 percent and have added nearly six times the population increase of the city (Figure 1).  This general distribution of growth continued over the past decade, with the suburbs attracting 83 percent of the new population, while the city of Kuala Lumpur received 17 percent of the growth (Figure 2).


The region continues to grow faster than the nation and at the current growth rate, the Kuala Lumpur region could approach a population of 10 million by 2025.

The Urban Area

The Kuala Lumpur urban area (area of continuous urban development) has an estimated population of 6.6 million (2013). Kuala Lumpur ranks as the 49th largest urban area in the world (Note 2). The urban area covers an estimated 750 square miles (1,940 square kilometers), ranking it 42nd largest in the world. The population density is 8,800 per square mile (3,400 per square kilometer). Among the 70 world urban areas with more than 5,000,000 population, Kuala Lumpur ranks 56th in population density, with approximately the same density as Western European urban areas in the same size classification (Figure 3).

The highest population densities are in the city of Kuala Lumpur, at 17,300 per square mile (6,700 per square kilometer), approximately the density of the city of San Francisco. The suburban areas have a population density of 6,800 per square mile (2,600 per square kilometer), approximately five percent higher than the suburbs of Los Angeles (Figure 4).

The Economy

Kuala Lumpur is a prosperous region by developing world standards. Only high-income Singapore is more prosperous in Southeast Asia. According to the most recent Brookings Global Metro Monitor, Kuala Lumpur has gross domestic product per capita of $23,900 annually (based on purchasing power). This is higher than all metropolitan economies in Latin America other than Brasilia, Monterrey and Buenos Aires. If Kuala Lumpur were in China, it would rank in the top quarter of the richest per capita metropolitan economies (Note 3).

The Setting

The urban area stretches from the core of Kuala Lumpur more than 20 miles (32 kilometers) westward to Port Klang on the Strait of Malacca, with similar expanses to the north and south. The urban area stretches less than 10 miles into the Titiwangsa Mountains, which forms the central cordillera of the Malay Peninsula.

Physical Description

The Kuala Lumpur urban area is located in a densely forested tropical region. The urban areas somewhat low density has permitted retention of substantial greenery. As a result, Kuala Lumpur appears to be among the "greenest" urban environments in East Asia, and for that matter, in the world. The greenery is especially evident in residential areas, where most housing is either detached or row house (Photos).


Detached housing

Row Houses

However, the greenery also extends to the central business district (Photo: Kuala Lumpur's Green Central Business District), where the largest buildings are much less densely packed than in most large world cities. Kuala Lumpur's central business district is home to the Petronas Towers (Photograph above), twin towers that became the tallest buildings in the world upon completion in 1998, displacing Chicago's Sear's Tower (now Willis Tower). The title was lost to Taipei's Tower 101 in 2004.


Photo: Kuala Lumpur's Green Central Business District

Kuala Lumpur is not monocentric. The central business district accounts for only 12 percent of regional employment, a figure that is projected to decline (Figure 5). The central business district share is slightly more than the United States average (10 percent) and less than the Western European average (18 percent).

Transport

The Kuala Lumpur region principally relies on personal mobility (cars and motorcycles) for its transportation. As late as 1985, 35 percent of travel in the Kuala Lumpur was by mass transit. By 2010, this had fallen to between 10 and 12 percent. This is after opening three metro lines, a monorail and three commuter rail lines, with the metro and monorail lines having opened since 1995. Kuala Lumpur's mass transit market share is more reflective of a high-income nation region than a middle income nation, comparable to Sydney, Toronto or New York and one-third below that of Western Europe. However, Kuala Lumpur is much more transit dependent than most US metropolitan areas, at five to 10 times that of Los Angeles, Portland, Seattle, Dallas-Fort Worth and Phoenix.

The Kuala Lumpur region is served by an extensive network of expressways. One segment includes the "SMART" tunnel, which is a 6 mile (10 kilometer) long tunnel that serves both vehicles and storm water. While the tunnel has levels dedicated to both vehicles and storm water, the entire tunnel can be converted to storm water usage when there is serious flooding.

Prospects

Kuala Lumpur seems well positioned for the future. As the urban area has expanded in population and land area, its populace has achieved a level of affluence toward which much of the world strives.

Wendell Cox is a Visiting Professor, Conservatoire National des Arts et Metiers, Paris and the author of “War on the Dream: How Anti-Sprawl Policy Threatens the Quality of Life.”

------------------

Note 1: See "Definition of Terms used in The Evolving Urban Form"

Note 2: The comprehensive Demographia World Urban Areas is published at least annually, with the next (9th) annual edition due in the Spring of 2013.

Note 3: The ranking for Chinese metropolitan areas is adjusted, using the population figures from the 2010 census (which included the urban migrant population). The issue is described in Endnote 19 in the Brookings Global Metro Monitor.

-------------------

Photograph: Petronas Towers (all photos by author)

California's Demographic Dilemma

$
0
0

It's been nearly 20 years since California Gov. Pete Wilson won re-election by tying his campaign to the anti-illegal immigrant measure Proposition 187. Ads featuring grainy images of presumably young Hispanic males crossing the border energized a largely white electorate terrified of being overwhelmed, financially and socially, by the incoming foreign hordes.

The demographic dilemma facing California today might be better illustrated by pictures of aging hippies with gray ponytails, of legions in wheel-chairs, seeking out the best rest home and unemployed young people on the street corner, watching while middle-age families drive away, seeking to fulfill mundane middle-class dreams in other states.

The vital, youthful California I encountered when moving here more than 40 years ago soon could be a thing of the past – if we don't address the root causes of an impending demographic decline. The days of fast population growth have certainly passed; the state's population growth barely equaled the national average in the past decade. In the urban strips along the coasts, particularly in the Los Angeles Basin, growth has been as little or half that level.

To be sure, particularly in this region, few would want to see a return to breakneck population growth. But there's little denying that California has shifted from a vibrant magnet for the young and ambitious to a state increasingly bifurcated between an aging, predominately white coastal population and a largely impoverished, heavily Hispanic interior. This evolution, as suggested in last week's essay, has much to do with what passes for "progressive" policies – high taxation, regulation and an Ecotopian delusion that threatens to crush the hopes of many blue-collar and middle-class Californians.

California's consistent net outmigration over the past two decades continues, albeit at a slower rate. Over that period, California, notes a recent Manhattan Institute report, has lost a net 3.4 million people. This outflow has slowed with the recession and housing bust, but could swell again, as in the past, when the housing market recovers, and people can sell their homes.

This long-term outmigration likely stems from a combination of persistently weak job growth, relatively higher unemployment rates amid generally far higher housing prices. Until 1970, notes demographer Wendell Cox housing prices in California, including Los Angeles and Orange County, were generally in line with national averages, adjusted for income.

But over the past four decades, California's housing prices relative to income have mushroomed to more than twice the national average. This is particularly true in places such as Orange County, where housing prices, particularly near the coast, are so high that younger even solidly middle-class families have little chance to enter the market.

These high prices are the result not merely of market forces, but also the perverse impact of Proposition 13, which allows people to stay longer in their homes, as well as regulatory restraints on new housing construction. The regulatory vise, if anything, is almost certain to get worse as the state's "climate change"-inspired regulations seek to all but ban new single-family house construction, all but guaranteeing higher prices.

Until recently, the impact of net outmigration has been ameliorated by immigration, not just the kind memorialized in Wilson's grainy ads but of the legal variety, as well. Over the past decade, however, immigration enforcement data indicates that California has suffered a gradual erosion in its appeal to immigrants; this is particularly true for the L.A. Basin. In 2000, for example, Los Angeles-Orange County received 120,000 new immigrants; a decade later the annual intake had dropped by 87,000.

Essentially, immigration into the L.A. Basin fell 27.5 percent while immigration nationwide remained essentially stable; the numbers of Houston, Dallas, Seattle, Washington and New York, in contrast, remained level or grew.

Particularly troubling has been the relative decline in Asian immigrants, whose numbers now surpass Hispanics, and who also tend to be better educated than other newcomers. An analysis of migration of Asians conducted by demographer Wendell Cox, shows Asians heading increasingly to places like Houston, Dallas-Fort Worth, Raleigh, N.C., and Nashville, Tenn. Still home to the largest concentration of Asian-Americans, the L.A. Basin's growth rate is now among the lowest in the nation, 24 percent in the past decade, compared with 39 percent in New York, and more than 70 percent in Dallas-Fort Worth and Houston.

Some, like USC's Dowell Myers, suggest slowing migration and population growth may actually be a positive, and claims "the demographic picture is brighter than it is has been in decades." He suggests that, rather than depend on the energy of newcomers, we now ride on "the skills of homegrown Californians."

Certainly, slower growth may help with our traffic problems and even provide a break on housing inflation, but the contours of our demographics appear less than favorable. Over the past decade, for example, virtually all the largest metropolitan areas – including Silicon Valley – have seen slower percentage growth in college graduates than the national average. The big exception has been Riverside-San Bernardino, which started from a low base but has appeared to attract some college-educated people from the more expensive coastal regions.

In contrast, largest rate of growth in educated people has taken place in regions such as Raleigh, N.C.; Austin, Texas, Phoenix and Houston; all these cities have increased the number of bachelor's degrees at least one-third more quickly than the major California cities. Although California retains a strong educational edge, this is gradually eroding, particularly among our younger cohorts. In the population over age 65, California ranks an impressive fourth in terms of people with bachelor's or higher degrees; but in the population under 35 our ranking falls to a mediocre 28th. If we are becoming more reliant on our native sons than in the past, we may be facing some serious trouble.

This pattern can also be seen in those with graduate educations, where we are also losing our edge, ranking 19th among the younger cohort. More worrying still is the dismal situation at our grade schools, where California now ranks an abysmal 50th in high school attainment. Our students now rank among the worst-performing in the nation in such critical areas as science and math.

If these issues are not addressed forcefully, what then is our demographic trajectory? One element seems to be a decline in the numbers of children, particularly in the expensive coastal areas. Over the past decade, according to the Census, the Los Angeles-Orange County region has suffered among the most precipitous drops in its population under age 15 – more than 12 percent – than any large U.S. metropolitan area.

The numbers are staggering: in 2010 the region had 363,000 fewer people under age 15 than a decade earlier, while competitors such as Dallas-Fort Worth and Houston increased their youngsters by over 250,000 each. Orange County alone suffered an 8 percent decline in its under-15 population, a net loss of 54,000.

If current trends continue, we may not be able to rely on immigrants to make up for an nascent demographic or vitality deficit. In fact, demographer Ali Modarres notes that L.A.'s foreign born-population is now older than the native-born, as their offspring head off for opportunities in lower-cost, faster-growing regions.

Ultimately the state's political and economic leadership needs to confront these demographic shifts, and the potential threat they pose to our prosperity. We can't just delude ourselves that we attract the "best and brightest" from other states without creating improving the basics critical to families, from other states and abroad, such as education, reasonable housing costs and business climate. California 's beauty, great weather and a bounteous legacy remain great assets, but the state can no longer rest on its laurels if it hope to attract, and retain, a productive population capable of rebuilding our state's now-faded promise.

Joel Kotkin is executive editor of NewGeography.com and a distinguished presidential fellow in urban futures at Chapman University, and a member of the editorial board of the Orange County Register . He is author of The City: A Global History and The Next Hundred Million: America in 2050. His most recent study, The Rise of Postfamilialism, has been widely discussed and distributed internationally. He lives in Los Angeles, CA.

This piece originally appeared in the Orange County Register.

Photo illustration by krazydad/jbum

How Polarization Plays Out in Washington state: Voting for President and the Same-sex Marriage

$
0
0

Washington may be a left coast “blue” state, but the geography of the voting well illustrates the national phenomena of intensifying polarization.  The division may be among individual people,   but also expressed in geographies down to precincts and census tracts. 

The Washington 2012 elections provided ample data to assess this political and geographic divide. I review here the two most polarized races, for president (Obama vs. Romney) and for R74, to reaffirm the right to same sex marriage.  

Here are a series of 6 maps, 3 for the presidential race, for the state as a whole, and for the greater Seattle area, and one showing just the extreme tracts for Obama in the Seattle area, and 3 for the R74 contest, for the state, for greater Seattle and again of just the extreme tracts, all in the city of Seattle.  These maps illustrate the extreme dimensions of polarization impacting the regions.         

The results suggest three overlapping dimensions. The dominant one is itself ecological – that is the urban-rural, or better large dense metropolitan territory versus rural, small towns, with smaller cities and metropolitan suburbs in between, and less polarized geographically. The strongest correlations in demographic variables are transit use vs. SOV use, density, single persons, and multi-family versus mobile homes.  

These factors apply to both the Obama race and for R74, but more strongly for Obama. The second dimension is of social liberalism, and is characterized by variables on household relationships, unmarried partners, gay and lesbian, education, e.g., share  with BA vs. with high school only, occupation, e.g., percent managerial professional vs. percent in laboring and construction occupations. The social divide also shows difference by age, those 20-34 more liberal, areas with high shares under 18, that is families, more conservative. This dimension too applies to both contests, but more strongly to R74. The third dimension is race, minority racial areas vs. more white areas, and positively correlated with support for Obama, although the Asian share is much more related to support for R74.  In Washington we will see that the racial dimension really is somewhat distinct from the urban-rural, as Obama did well, but R 74 did poorly in rural small town areas that are now heavily minority (Hispanic and Native American).

In a few cases with a large difference should be noted. Areas dominantly white are non-supportive of Obama, but not opposed to R74.  Similarly, areas high in managerial-professional occupations and higher education generally are more correlated with support for R74, than for Obama.

Obama carried Washington state by 464,000 votes, 56 to 44 percent, and R74 won by some 229000 votes, 54 to 46 percent.  Consider first the maps for Washington State as a whole, realizing that like the US as a whole, rural territory dominates most of the physical space.  I use the same intervals for mapping, so comparison is easier.  The main difference between the Obama and R74 maps is race and ethnicity – many of the lighter blue rural small town areas are  Native American Indian reservations, or strongly Latino areas, which voted for Obama, but also cast ballots overwhelmingly against R74, likely reflecting the role of local churches. Obama also did better than R74 in traditional logging areas of western Washington, a continuation of a long history of their identification with Democratic voting, but more conservative on the social issues like same sex marriage. 

Rural to smaller city areas voting for both Obama and R74 include university towns, notably Pullman (Washington State in eastern Washington,  Bellingham  (Western Washington U), Olympia, the state capitol, and many areas of “spillover” of more educated and professionals, out of the Seattle core to desirable water and mountain environments, for retirement and second homes,    At the other extreme are two areas in western Washington which are extremely “red” , the Centralia area in southwestern Washington,  and the city of Lynden, up at the border with Canada, and still dominated by its Dutch Reformed church adherents.

Turning to the equivalent maps for Obama and R 74 for the greater Seattle area, with two-thirds of the state population, the picture is broadly the opposite of that for the state. Here blue dominates, with “red” areas pushed to the rural edge.  But the differences in the maps are interesting, illustrating the dimensions of polarization.  The Obama map exhibits a simpler belted pattern, the dense urban core, the city of Seattle with spillover north and south, with an inner suburban belt of moderate Obama domination (60 to 75 percent) and an outer suburban and exurban ring. This pattern was repeated for the city of Tacoma to the south. To the west, however, are two islands of very high Obama support, Vashon and Bainbridge, with very high proportions of professionals commuting to the Seattle core. Areas of support for Romney include a few fairly close in affluent areas and more rural areas, including actual farming areas to the southeast.

The map for R74 is subtly different. The area of strongest support is reduced to the city of Seattle, plus the commuter islands, but support for R74 is quite a bit weaker in less affluent and educated black and latino areas. Likewise the majority of inner suburban areas are still supportive for Obama but far less than the core. These are mainly family areas, while the areas of highest support in the city are dominated by singles and childless couples, including unmarried partners.

Conversely, moderately higher support for Obama and R74 extends somewhat farther east to affluent educated suburbs, e.g, the Microsoft workshed, which is also high in Asian population.  The final two maps are of the tracts with the highest support for Obama and for R74, most of which are confined to the city of Seattle. The areas of over 90 % support are two: the historic CD or Central District, which defined the Seattle Black population as of 1970-1980, not much gentrified at the north end, but also including the core of Seattle’s GLBT community (the westward extension over 90 %. The second area is in near north Seattle, extending from west of the University of Washington westward  in areas dominated by young singles and unmarried couples, including many students. The map for R74 is quite different, with no areas of extreme support to the south of the core GLBT area, but with stronger support than for Obama in the highly affluent and professional areas, just north of the GLBT core.

Clearly the 3 dimensions of polarization, by settlement type, by social values-education, and by race, all are exemplified by the map results. The geographic concentration of the vote, especially for R74 can be seen in these amazing numbers:


Vote Results in Washington State
StateState Outside King Co.King CoSeattleKing Co. Outside Seattle
Obama1,7551,087668279389
Romney1,2911,01527646230
Difference46472392233159
  
R74 yes1,6601,021639274365
R74 no1,4311,10731557258
Difference229-86324217107


Obama carried the state by 464,000. Half of this was accounted for by just the city of Seattle. The
Pro vote for R74 was even more concentrated in the metropolitan core, as the margin just in the central  city of Seattle , 217,000, was essentially the margin for the state!  King County outside Seattle provided an additional margin of 107,000, offsetting a net loss of 86,000 in the entire rest of the state, where the vote was 1,107,000 to 1,021,000 against. 

It is similarly amazing to note the relative location of areas with very high or very low vote shares for Obama and for R74.  Eighty-nine census tracts were carried by Obama with over 85% of the vote and 83 tracts voted more than 83 percent for R74. The distributions were:


Number of Census Tracts Voting 85% for Obama or 83% for Measure R74
ObamaR74
North Seattle3733
Central Seattle1926
South Seattle261
Pierce (Tacoma, reservation)1 
Whatcom (WWU)22
Whitman (WSU)21
Yakima (Reservations)3 
Thurston (Olympia)1 

Eighty-two of 89 of tracts with high Obama shares were in the city of Seattle, dominating the city and well distributed across it. The other 7 were in Tacoma, Olympia, Whatcom and Whitman, both university communities, and in Yakima county Indian reservations.  All these tracts were urban core tracts, except for those on the Yakama reservation.   Sixty of 63 tracts with the highest shares for R74 were in the city of Seattle,  concentrated in the north (University of Washington dominated) or highly professional, and in the center, home of the large GLBT community, with few in the south of the city, which is less affluent and higher in minorities.  The remaining 3 are in Whatcom (WWU) and Whitman (WSU). All these tracts are urban.

The distribution of tracts with very low shares for Obama and for R74 shows the other side of the   polarization.  Of the 71 tracts where Obama received less than a third of the vote, 34 were in south central Washington, the region of the Tri Cities of Richland, Kennewick and Pasco, Yakima, county and Grant county, home of the Columbia basin irrigation project, all areas high in Mormon and Latino populations. Another 19 were in north central and northeastern Washington, including much of Okanogan and Lincoln counties, and even some exurban counties around Spokane. Another 8 were in southeastern Washington (wheat country), leaving 9 in western Washington.  Three each were in rural parts of Clark County and Lewis County in the southwest, and 3 were in the very conservative small city of Lynden, on the Canadian border, and home of a large Dutch reformed community. All these tracts are rural except for the city of Lynden and 3 suburban tracts in the Tri-Cities.

Similarly, of 81 tracts with shares below one third for R74, 32 were again in south central Washington, 21 in north central and northeastern Washington, 4 in the southeast, and now a larger 15 in western Washington. The Lynden area of Whatcom county accounts for 4, but now 6 in socially conservative Lewis County, 4 in rural parts of Clark County, and 2 in family dominated military parts of Pierce County.  All these tracts are rural, small town, except for those in Lynden, again in suburban Tri-cities and 2 in suburban Tacoma.

Differences between Obama and R74 Shares

The last discussion compares the vote for Obama and for R74, identifying areas with the greatest difference, recalling that the overall correlation was a very high .87.  Please also see Map 7.

The Obama vote exceeded the share for R74 by more than 20 percent in 56 census tracts.
In rural areas Obama did well with the large Latino vote, which also voted against R74. This was true as well in Indian reservation tracts.  In Seattle and Tacoma the tracts are mainly lower to middle class, worker areas, Black or Latino or both.  All of the King county tracts were in south Seattle, extending southward into lower and middle class industrial suburbs.

The R74 vote exceeded the Obama vote by 5% or more in 51 tracts.

Overall, R74 fared better than Obama in affluent professional areas, socially more liberal but economically more conservative.  But the pattern surprisingly occurs in several military base areas, as in Island and Kitsap counties. In 15 tracts R74 won but Obama lost, all affluent suburb or military areas in several parts of the state.  In King the 4 tracts are the 2 richest tracts in the state plus 2 near the Microsoft Redmond campus.  In 12 tracts both Obama and R74 won, but R74 polled higher. These tracts were spread across the state, in mainly exurban economically conservative areas. In 24 tracts Obama and R74 won. All but one were in King, most in the professional suburbs east of Seattle and a few in the wealthiest tracts inside the city of Seattle.

Conclusion

The electorate of Washington, like that of the country, is ideologically divided, and which is manifest geographically in the familiar red and blue mosaics. Washington overall is on the economically and socially liberal side, although statewide maps would not recognize the degree of this, simply because of the extreme concentration of these sub-populations in the urban cores, and especially in and around the   city of Seattle.

Richard Morrill is Professor Emeritus of Geography and Environmental Studies, University of Washington. His research interests include: political geography (voting behavior, redistricting, local governance), population/demography/settlement/migration, urban geography and planning, urban transportation (i.e., old fashioned generalist).

The California-China-CO2 Connection

$
0
0

Michael Peevey, President of the California Public Utilities Commission, is sincere and concerned about CO2 emissions. At a recent presentation at California State University Channel Islands, he spoke about California’s efforts to limit CO2 emissions. He mentioned green jobs, but, to his credit, he did not repeat the debunked claim that restricting CO2 emissions will be a net job creator. He also acknowledged that it doesn’t much matter what California does, if China doesn’t change its behavior. It turns out that if California were to reduce its carbon emissions to zero, in about a year and a half global CO2 would be higher anyway, just because of the growth in China’s emissions.

Peevey talked about California's increasingly ambitious plans for carbon reduction in the future. The goals include returning to 1990-level CO2 emmisions by 2020, and then an 80 percent reduction by 2050, regardless of population changes.

This is going to be expensive. And the price of some of the potential technology — such as capturing atmospheric CO2 and pumping it underground — will include a lot more than the direct cost. The ultimate costs will, unfortunately, include increased global CO2 emissions.

Some readers will remember the first time Larry Summers, the former US Treasury Secretary (under Bill Clinton) put his public career at risk because of his bluntness. In 1991, while Chief Economist at the World Bank, Summers gained international notoriety by saying in a memo, "I've always thought that under-populated countries in Africa are vastly under polluted."

That was the first of many times that lots of people demanded his head. He's since claimed that it was sarcasm, but I don't believe it. I believe he meant that environmental quality is a luxury good; that poor people need things like food and shelter, and they don't much care if they trash the environment in the process. So, if pollution were localized, the poor would gain jobs and the wealthy would have an improved environment. Presumably, each would be happier.

Of course, that sounds terrible to most people. But that's precisely what we are doing here in California, only we’re doing it worse.

California, by making production so very expensive, is chasing producers to places with low pollution controls. It's worse than the situation Summers describes, because carbon dioxide emissions do not remain local. They spread throughout the atmosphere. Perversely, California is causing a global increase in CO2 emissions by its regulations limiting CO2 emissions in California.

The problem is the result of acting on the concept of Think Globally and Act Locally (TGAL). TGAL works when pollution is local. But when air pollution is free to float around the world, you have to have a different strategy, and get the most reduction for your investment.

And you don’t get the most for your investment in California. In terms of carbon efficiency — the ability to generate output while emitting less CO2 — California is one of the world’s most efficient economies. Each new reduction in CO2 becomes increasingly expensive. That is, reducing emissions is subject to increasing marginal costs. Reducing carbon emission in California is really expensive because we’re so carbon efficient already. Reaching the 2050 goal will be incredibly expensive. Worse, it won’t do any good.

It’s not as if California can really afford it. Last month, I participated in the South Coast Association of Governments (SCAG) Third Annual Economic Summit. This great event provided lots of information about the economic challenges facing Southern California. For example, we learned that Los Angeles County’s economy will probably not reach its pre-recession level of jobs until at least 2018 and perhaps not until 2020.

That’s a sobering thought.

California State Sen. Roderick Wright, D-Los Angeles, a powerful speaker, documented California’s industrial decline, and made an emotional appeal for polices that produce jobs. The audience gave Wright a rousing ovation, something quite rare at economic conferences. The problem is that the audience was comprised of economic development people. Too bad no one else was listening. It was poorly attended by policy makers. There were only a handful of elected officials.

California’s economy is struggling, even if many in the political class refuse to acknowledge the fact. Because of that, our investments need to be wise. The correct strategy for California is global. We need to go looking for the low hanging fruit.

The low hanging fruit is mostly in developing countries like China, India and Brazil. We've tried to get them to cut their emissions at Kyoto and the like, but they refused, pointing out that they are much poorer than the West, and that we were able to develop with lower-cost polluting industries. They have a point.

We should help them cut their carbon emissions. Reducing a ton of CO2 emissions is far cheaper in China than in California. So, let’s reduce it there.

There are political problems with this proposal. California’s carbon regulations were sold to the people on the absurd claim that the regulations would be profitable: better than low cost, better than a free lunch.

The bigger problem would be convincing California voters to tax themselves to clean up Chinese factories. That seems to me to be an information dissemination problem. If Californians knew the true cost of the existing program, and how little reduction in global CO2 concentrations it brings, they might logically be willing to look at other approaches. If they knew how much more effective a dollar spent on Chinese emissions was than a dollar spent on California emissions, they might seriously consider the proposal. The proposal could always be sweetened by requiring that all the work be done by California companies.

It would be good for Californians. It would be a big step towards restoring California’s economic vigor. It would make a serious dent in global CO2 concentration. It would be less costly than our current plan.

Let’s do it.

Bill Watkins is a professor at California Lutheran University. and runs the Center for Economic Research and Forecasting, which can be found at clucerf.org.

Flickr photo by doc tobin: Smog on the Great Wall.

Viewing all 3793 articles
Browse latest View live


Latest Images