Quantcast
Channel: Newgeography.com - Economic, demographic, and political commentary about places
Viewing all 3789 articles
Browse latest View live

Prairie Populism Goes Bust As Obama’s Democrats Lose The Empty Quarter

$
0
0

Along Phillips Avenue, the main street of Sioux Falls, South Dakota, the local theater’s marquee is a tribute to the late Senator and 1972 presidential candidate George McGovern, who was buried last month, and is still regarded as a hero by many here. But with McGovern gone, it seems that the Democratic tradition of decent populism he epitomized was being interred along with him.

In his landmark 1981 book, The Nine Nations of North America, Joel Garreau deemed the vast region stretching from the southern Plains well past the Canadian border The Empty Quarter. Along with the western strip of the neighboring Bread Basket that stretches up from central Texas through the Dakotas, the Quarter—covering much of the nation’s land and home to many of its vital natural resources—is in open revolt against the Democratic Party, threatening the last remnants of prairie populism.

Although long conservative and GOP leaning, the Empty Quarter—containing Nevada, Utah, Wyoming, Idaho, Montana, and most of Alaska, along with inland California and Washington and parts of Colorado, New Mexico, and Oregon—has a proud progressive tradition as well. Over the past half-century, many of the Democratic Party’s most respected leaders —McGovern, Senator Majority Leaders Mike Mansfield of Montana and Tom Daschle of South Dakota, and powerful figures like North Dakota’s Byron Dorgan and Kent Conrad—have represented the Plains.

The tradition is still revered there, but today’s Democrats are becoming an endangered species    as the party has become ever more distinctly urban, culturally secular and minority dominated.

While Obama lost most of the Quarter in 2008, this year polls show that he’s likely to be crushed there, despite the booming economy in many of the states. Obama’s popularity has dropped more in North Dakota, which has the nation’s lowest unemployment rate, than any other state.

Amidst the growing anti-Obama tide, progressive Democrats in most of the Quarter have been increasingly marginalized, both by their own party and by voters.  In the past two years, Republicans picked up a Senate and House seat in North Dakota, and look likely to pick up another this year,  along with a Senate seat in Nebraska,  and quite possibly another in Montana.  They are also poised to claim the only remaining Democratic House seat in Utah, if Mia Love’s lead over Rep. Jim Matheson holds up.

By the end of this election, it's possible that only two classic Prairie Democrats—South Dakota’s Tim Johnson and Montana’s Max Baucus—will remain in the Senate, where they once formed a powerful caucus. The Plains states, plus Alaska, account for 50 Congressional seats and an equal number of electoral votes—more than Florida, North Carolina and New Hampshire combined.

Why has this occurred? One problem, notes former Daschle top economic aide Paul Batcheller, lies with the “nationalization” of the Democratic Party—and its transformation from an alliance of geographic diverse regions to a compendium of narrow special-interest groups, so that under Obama, the Democratic Party has essentially become the expression of urban-dwellers, greens and minorities, along with public employees.

This, says Batcheller, has “made it easier for Republicans to paint Democrats as in cahoots with the likes of Ted Kennedy, Nancy Pelosi, etcetera.  And because politics has always been fairly civil here, having those coastal boogeymen to use has made it easier to paint Prairie Dems as having gotten Potomac Fever.”

He also points to “changes in the media”—especially cable TV—that have made it more difficult for grassroots Democrats to make their case for their own interests, outside of the increasingly polarized national debate.  At the same time, Obama’s policies—focused largely on constituents in dense coastal cities—have widened the gap between the Plains and the Democrats.  It is increasingly difficult to be a successful Prairie progressive when that means striking out consistently against the very industries, from large-scale agriculture to fossil fuels, at the center of these economies.

At the same time, the failings of Democratic big states, most notably California and Illinois, are not exactly advertisements for the virtues of modern progressivism. Particularly galling, notes Mike Huether, the mayor of Sioux Falls, have been the huge deficits and expanded welfare spending associated with the Obama Administration.

“This is a fiscally conservative place, we don’t like deficits,” notes Huether, a lifelong Democrat whose city of 156,000 operates with a fiscal surplus. “People here want self-sufficiency. They are happy to give a hand up but they see that as short term and that’s it.”

And the region’s self-sufficiency is an increasingly important part of our national debate, especially about energy independence. Although often dismissed as a land of rubes and low-end jobs, a study of the Plains  I conducted with the Praxis Strategy Group and Texas Tech University found that, overall, it has outperformed the rest of the country in virtually every critical economic measurement from job creation and wage growth to expansion of GDP.

The area has also thrived demographically, with population growth well above the national average. Most of this has taken place in the region’s flourishing urban centers, from Ft. Worth and Midland, Texas to Sioux Falls, Bismarck, Fargo, Oklahoma City and Omaha. This growth includes migration from still de-populating smaller towns in the region, but increasingly includes migrants from the coastal areas as well as immigrants.

More people now arrive in Oklahoma City from Los Angeles than the other way around.   And these arrivals are hardly poor Okies pushed back unwillingly; the Plains cities have become magnets for educated people. Over the past decade, the number of people with BAs in Sioux Falls has grown by almost 60 percent; Bismarck and Fargo saw growth of over 50 percent, while Oklahoma City, Omaha and Lubbock enjoyed forty percent increases. In contrast, the educated population of San Francisco grew at 20 percent and that of New York by 24 percent.

Any coastal denizen who spends time in these cities may be surprised by the tolerance and lack of bible-thumping one encounters there. Social issues, notes Mayor Huether, have never been drivers in the Plains as they have been in parts of the Deep South. A quiet Nordic spirituality prevails here, rather than evangelical enthusiasm; people and politicians generally do not wear their faith on their sleeves. The real issue in the Plains centers around the future of the economy, and how best to bolster family and community; the Obama program, with its interest-group agendas, simply does not translate well in this environment.

Ultimately, the red tide sweeping over the Plains is bad news, not simply for Democrats but for the country, part of the trend noted by Batcheller in which moderating regional forces within both parties—New England Republicans and Blue Dog Democrats—are losing ground.

Prairie Democrats are crucial for ensuring that producers tangible staples—food, fiber and energy—have a space within their party’s tent, along with the big-city coastal consumers of those resources. Never mind the conservative cliché: If Democrats lose their remaining hold on the Plains, the nation’s parties will truly be split between makers and takers.

This region is likely to become more important over the coming decades, providing much of the food needed for world markets as well as significant share of our new domestic energy. Its manufacturing, technology and service industries are also growing rapidly, integrating the area more into the national and global economies.

Batcheller, among others, believe that the Plains Democrats may not become extinct, but their future will be limited in the increasingly polarized, and nationalized, political order. On the local level, particularly on key infrastructure projects like Lewis and Clark water project  that is being built to meet the needs of Sioux Falls and its environs, Republicans and Democrats are largely in agreement. Neither tea-party extremists nor greens can block progress towards widely accepted local infrastructure goals.

One can only hope that the Prairie Democrats manage to survive. They have  contributed a unique brand of civically minded, decent social democracy that added much to the national debate. Egalitarian in intent, their brand of aspirational liberalism, fully content and compatible with notions of individual achievement and hard work, offers an alternative to the “know nothing” extremism increasingly dominant in both parties. This tradition of progressive decency could be sorely missed in the years ahead.

Joel Kotkin is executive editor of NewGeography.com and is a distinguished presidential fellow in urban futures at Chapman University, and contributing editor to the City Journal in New York. He is author of The City: A Global History. His newest book is The Next Hundred Million: America in 2050, released in February, 2010.

This piece originally appeared at The Daily Beast.

Sioux Falls photo by Jon Platek..


The Evolving Urban Form: Addis Abeba

$
0
0

Addis Abeba is the capital of Ethiopia and calls itself the "diplomatic capital" of Africa, by virtue of the fact that the African Union is located here. Yet Ethiopia is still one of the most rural nations in both Africa and the world. Ethiopia also appears to be among the most tolerant. Various forms of Christianity claim account for approximately 65 percent of the population, with the Ethiopian Orthodox Church (Coptic) holding the dominant share. At the same time there is a sizable Muslim minority, at more than 30 percent of the population. Ethiopia has been spared the interfaith violence that has occurred in some other countries where there are large religious minorities.

Growing Urban Area

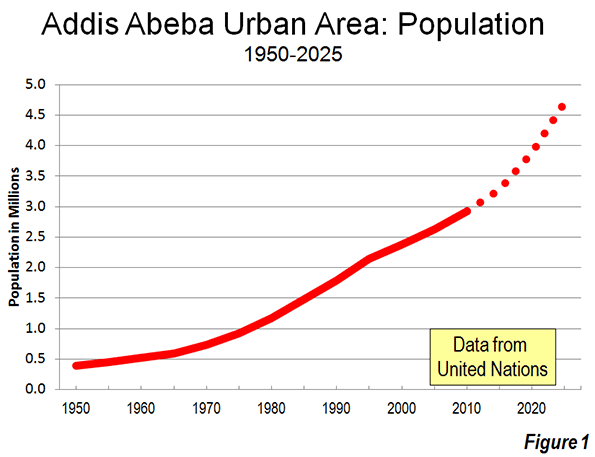
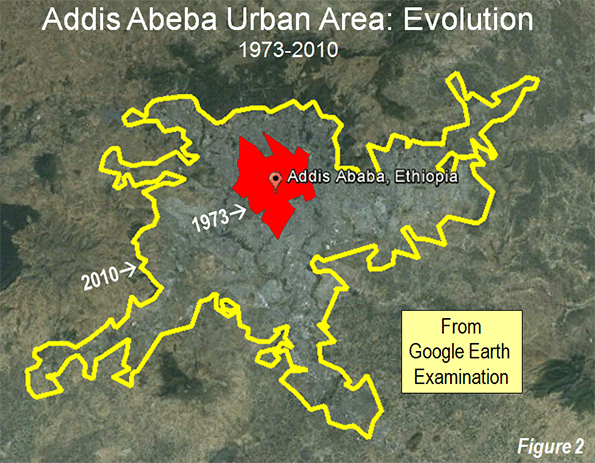
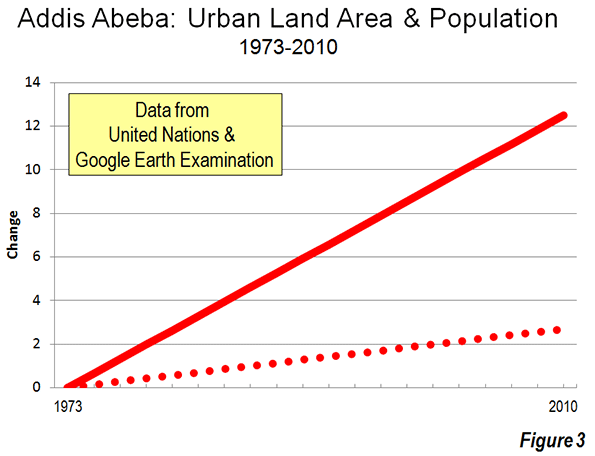
Addis Abeba is among the fastest growing urban areas in the world. Since 1970, the population has increased by nearly three times (Figure 1). However, the spatial expansion of the urban area has been much greater. The earliest available Google Earth satellite photos (1973) indicate that the urban land area (continuous urban development) has expanded over 12 times. Thus, the urban spatial expansion has been at least four times that of the population over the since the early 1970s (Figures 2 and 3).

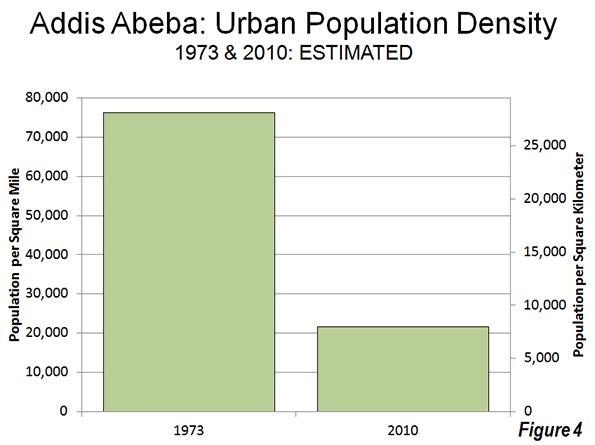
Since 1973, the urban population density of Addis Abeba has declined almost three quarters, from approximately 75,000 per square mile or 29,000 per square kilometer to 20,000 per square mile or 8,000 per square kilometer. Addis Abeba represents yet another example of the counter-intuitive reality of growing urban areas simultaneously becoming less dense, because population growth occurs the generally less  dense periphery in an organic city. It is not unusual for urban analysts to (wrongly) assume the opposite.

One of the results of the spatial expansion is a significantly better lifestyle for residents of Addis Abeba, consistent with the view of Professor Shlomo Angel, who decries attempts to constrain cities within artificial boundaries (compact city policies) because they can deny people both a adequate housing and a decent standard of living.

The Economy

Ethiopia is one of the poorest nations on earth, with a 2010 gross domestic product-purchasing power parity (GDP-PPP) per capita of just above $1,000. This places it 170th out of 183 geographical areas according to the International Monetary Fund. By comparison, the GDP-PPP of the United States was $47,000 and Singapore $57,000.

Ethiopia's low income reflects  Ethiopia's relativey low rate of urbanization. With 17 percent of the population in rural areas (outside urban areas), urbanization is concentrated in Addis Abeba (3.1 million), which is the only urban area in the nation with more than 300,000 population. Ethiopia can expect to experience a strong rate of urbanization in the decades to come, as people flock to the cities to seek better standards of living. By 2030, the total number of urban residents is projected by the United Nations to rise to 28.4 million from 13.9 million in 2010.

Urbanization has its problems, but also economic advantages. The GDP-PPP in Addis Abeba, according to a Price-Waterhouse-Coopers estimate, is up to six times higher than that of the rest of the nation. Assuming that this ratio held to 2010, The GDP-PPP per capita of Addis Abeba would be $6,000 or more.

Moreover, Price-Waterhouse-Coopers predicted that Addis Abeba would experience the 5th greatest economic growth to 2025, out of 151 urban areas. This would result in growth greater than that of Shanghai and Beijing. The four predicted to grow faster are the two large Viet Nam urban areas (Hanoi and Ho Chi Minh) and two in China (Guangzhou in the Pearl River Delta and Changchun in Manchuria).

The Urban Core

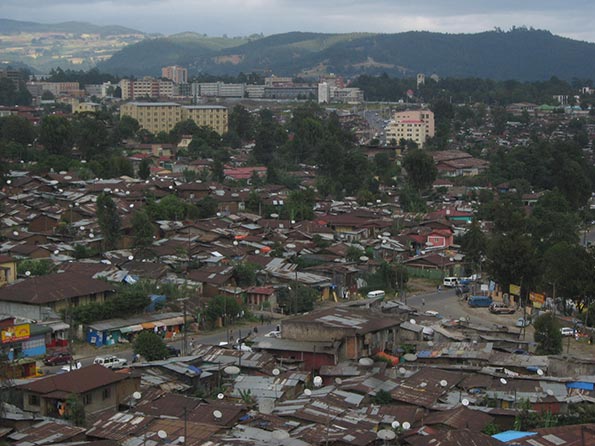
As would be expected in a developing world urban area, there is a large urban core with mixture of government and private buildings, literally surrounded by lower income, principally informal housing. With this predominant informal housing, the population density of the urban core is by far the highest in Addis Abeba (See Photo: Informal Housing in the Urban Core: Parliament and Holy Trinity Dome in the Distance).


Photo: Informal Housing in the Urban Core: Parliament and Holy Trinity Dome in Distance

Major government offices and cultural facilities are in this area, such as the Parliament, the prime minister's residence, museums, the residence of the primate of the Ethiopian Orthodox Church (Coptic), the most important cathedral, Holy Trinity, in which former Ethiopian leader Haile Selassie  is buried, as well as the Catholic Cathedral and the largest Mosques.

The New Addis Abeba

There’s been a huge expansion of the periphery around Addis Abeba. Extensive tours around the urban area provide evidence of relative prosperity. It appears that Addis Abeba is rebuilding itself around its urban core. There is major construction in three directions from the urban core.

The greatest activity is in the Bole District, which includes Bole International Airport, to the south of the urban core. There is a substantial amount of new commercial high-rise construction within a few kilometers to the north of the airport, along two major arterials and in between (Photo: Bole Corridor Development). There are also a large number of large, private condominium buildings. The Bole Corridor represents an edge city, in the sense defined by Joel Garreau in his seminal book Edge Cities  two decades ago. This is also the location of the largest Ethiopian Orthodox Church (see top photo) in the country.


Photo: Bole Corridor Development

An eastern corridor stretches for 6 miles/10 kilometers from what is locally called the "Chinese Road," a ring road built largely with the support of the Chinese government. There are many new commercial buildings, government buildings, public and private condominiums, and at the edges, large new detached houses (See photo: Detached Housing in the Eastern Corridor).


Photo: Detached Housing in the Eastern Corridor

To the west, principally, the southwest, is a new residential neighborhood composed principally of condominiums, generally up to five floors (Photo: Southwest Residential Area).


Photo: Southwest Residential Area

China in Africa

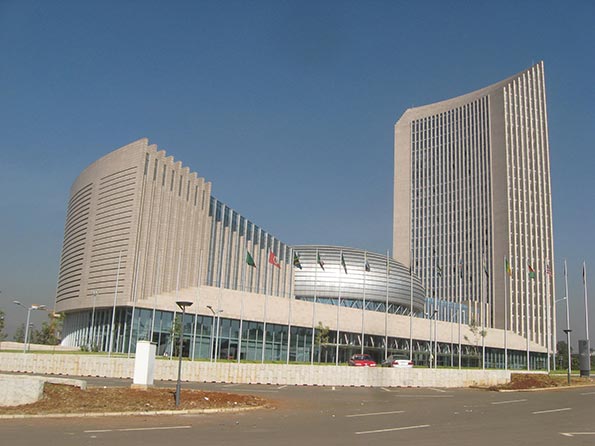
Chinese financial assistance is not limited to the ring road. Much of the funding for the impressive new African Union headquarters (photo) was provided by the Chinese government. Further, a new light rail line will be largely financed by China. At the same time, the massive construction evident in the newer, outlying districts of Addis Abeba resemble (at least in a modest way) the urban development that has occurred in China over the past few decades.


Photo: African Union Headquarters

Conclusion

The economic progress evident in Addis Abeba is encouraging. The government policies  are allowing the city to expand naturally as it grows, which facilitates  better lives for its citizens. It can only be hoped that the day will come that people in developing world urban areas, such as Addis Abeba, will enjoy the high standards of living that have been achieved in the developed world.

Photo: Holy of Holies, Bole Mehani Alem Church (Ethiopian Orthodox Churches all have a replica of the "Ark of the Covenant," behind a screen, which is referred to as the "holy of holies"). According to the Ethiopian Coptic tradition, the Ark of the Covenant, which tradition indicates, contained the tablets on which the Ten Commandments were written. The Ark was maintained in the holy of holies in the Jewish temple. The Ethiopian tradition holds that the Ark was taken to Ethiopia and is now kept at a chapel at a church in Axum, which is 600 miles/1,000 kilometers north of Addis Abeba.

Wendell Cox is a Visiting Professor, Conservatoire National des Arts et Metiers, Paris and the author of “War on the Dream: How Anti-Sprawl Policy Threatens the Quality of Life.”

Why Obama Won: Hispanics, Millenials Were The Difference

$
0
0

President Obama won re-election primarily because he did so well with two key, and expanding, constituencies: Hispanics and members of the Millennial Generation. Throughout the campaign, Democratic pundits pointed to these two groups as being the key difference makers. They were right.

Let’s start with Hispanics, arguably the biggest deciders in this election. Exit polling shows Obama winning this group — which gave up to two-fifths of their vote to George Bush — by over two to one. In 2008, Obama improved his winning margin with Latino voters from 67% in 2008 to 69% in 2012. And for the first time they represented 10% of the overall electorate.

Obama and the Democrats went after this constituency, taking some risks along the way about a backlash among whites. Obama’s move to not deport young undocumented immigrants if they came to this country as a child and met certain other criteria blurred any negative impact from a still weak economy. In contrast, Romney’s platform of more or less making life so horrible that undocumented immigrants have canceled out all the GOP candidate’s credible economic and social proposals that might have appealed to this group.

To this Republican political malpractice there is an even greater threat: the loss of younger voters. According to CNN exit polls, Millennials voted for Obama 60% to 36% and accounted for 19% of all voters, up from 17% in 2008. Although white male millennials turned slightly less enthusiastic, the President’s huge margin among white women as well as minority millennials — roughly 40 percent of this huge generation — more than made up the difference.

Why did this happen? Generational theorists Mike Hais and Morley Winograd attribute this to several factors. One is the intrinsic optimism of millennials, even in the face of very difficult economic challenges. This blunted Romney’s main argument. Other issues such as gay marriage, favored by most millennials, as well as a more tolerant attitude towards immigration drove them away from the GOP and towards the President.

When you combine millennials and minorities, especially Hispanics, the road to recovery for Republicans gets more and more difficult. If you win close to 60% of the white vote and lose the electoral college decisively, you are heading into very difficult territory. In addition, Hais and Winograd note, there are other constituencies — women, particularly singles as well as those with graduate degrees broke strongly for the President.

Together, they conclude, these groups constitute what they describe as a “21st Century Democratic majority coalition for the next few decades at least.”

So where does this leave the now hapless GOP? Certainly they can’t blame evangelicals and white working class voters who, for the most part, rallied to their cause. The problem now is based in history and demographics. The old Reagan coalition– as has been evident here in California for a decade — is literally too old, and too white, to overcome the combination of minorities, millennials and educated professionals that Hais and Winograd have identified.

What should the Republicans do now? They certainly will need to move away from the immigrant-bashing that cost them dearly among the key ascendant voting blocs of millennials and Hispanics. They will also have to turn their family friendly message into something defined more positive; Romney’s tragedy was to embrace Rick Santorum’s views on issues of gay marriage and contraception instead of embracing family, which is a core value among millennials.

Hais and Winograd add they will need to redefine their party as more open, and appeal to millennial preference for local, grassroots solutions. In the coming four years, there will be an opportunity to challenge the “top-down” decisions made by Obama’s now empowered clerisy. But this opportunity could be lost if Republicans continue to run against the tide of history instead of shaping it to their own advantage.

Joel Kotkin is executive editor of NewGeography.com and is a distinguished presidential fellow in urban futures at Chapman University, and contributing editor to the City Journal in New York. He is author of The City: A Global History. His newest book is The Next Hundred Million: America in 2050, released in February, 2010.

This piece originally appeared at Forbes.

Barack Obama photo by Bigstock..

A Racially Polarized Election Augurs Ill for Barack Obama’s Second Term

$
0
0

President Obama, the man many saw as curing the country’s “scar of race,” won a second term in the most racially polarized election in decades. Overall, the Romney campaign relied almost entirely on white voters, particularly in the South and among the working class. Exit polls showedthat almost 60 percent of whites voted for Romney. The former Massachusetts governor even won the majority of whites in California and New York.

In previous elections, including 2008, such a performance would have been enough to assure a GOP victory. But America’s demographics are shifting, with racial minorities constituting upwards of one quarter or more of the vote, and growing.

Essentially, Obama’s margin of victory was made up not only by a strong base of African-Americans but also Latinos, who appear to have voted for him more than two to one, a slight improvement from his 2008 performance. And for the first time, Latinos accounted for one in ten voters, up from 8 percent four years ago.

But—despite his poetic, inclusive victory speech—this alliance of people of color could create a potential tragedy for our democracy. This is not because of the final result, but because it suggests that, unless there is some massive change in GOP politics, we may see a re-hardening of politics along racial lines.

The election showed the efficacy of the new racial politics. Appeals to Latinos paid off massively, even though it may have cost the president some white votes. If Latinos remain solidly Democratic, the new racial outcasts will increasingly be middle- and working-class whites.

The Democrats will continue to press race, as some Republicans did in the past (remember Willie Horton?), because it  works. The president’s race-conscious campaigning this year was assisted in part because the media did not stress his ties to abrasive reverends like Al Sharpton and Joseph Lowery. He also did well with his Latino gambit since, once again, the media, including many conservatives, were sympathetic to amnesty.

So where does this go from here? Political revolutions—particularly successful ones—tend to shift rapidly into excess. With the recalcitrant white vote seemingly neutralized, the Obama team can now ever more openly embrace a multicultural politics of the kind Bill Clinton was careful to avoid. One sure voice pushing for race-centered politics will come from Attorney General Eric Holder, who largely embraces the idea that affirmative-action policies should be continued until Latinos and African-Americans achieve social and economic parity with whites.

Affirmative action and other race-sensitive policies—promoted even by ersatz minorities like new senator Elizabeth Warren—could characterize our politics for the next decade or more. These divisions are already evident among millennials, where whites, particularly evangelicals, have become increasingly alienated from the president. White millennials, who backed Obama in 2008, went with Romney this year 52-44, according to an exit poll—a particularly troubling shift. The gap between white and minority millennials this year appears to be as high as 30 points—a bad augur.

And racial divisions may become worse if the economy continues to sputter. President Obama may be beloved among Latinos and African-Americans, but his economic policies have not been friendly to them. This is particularly true, ironically, for blacks, who, as Walter Russell Mead among others have pointed out, have fared worst of all in the recession. This situation could be exacerbated by growing financial stress in cities and states, whose governments have traditionally been major employers of black white-collar workers.

Unless growth comes back, this means minorities, particularly African-Americans, could become ever more strident in their demands. Their appeal to an administration—particularly now that it faces no new elections—that at times seems sympathetic to a racialized agenda could be stronger than could be imagined just a few years ago. This could end badly. In the long run, history has shown, groups that look too much to government (the Irish, for example) do not fare as well as those, such as yesterday’s Jews and today’s Asians, who look more to education and entrepreneurship.

Alienation among whites is also likely to increase. Like its minority counterpart, the white working class—including millennials—has also suffered in the recession, and suffers double-digit unemployment.  Although this entire generation can be considered screwed, young whites—and young white males—are particularly so. Not only have many been left behind by the economy, but they have been deemed less worthy of assistance by the emerging new ruling class.

In many ways, this has ominous implications. To date America’s white working and middle classes have not drifted toward the kind of nativist movements that have risen in France, Germany, and, most recently, Greece. Yet a group that feels ignored by the establishment, and feels increasingly like second-class citizens in their own country, can drift in that direction.

The great tragedy here: the major challenges facing America are not primarily racial. They include stimulating economic growth for the broadest portion of our population. We need better jobs, roads, and bridges and less symbolism or redress for past sins. If politicians think the way to success is to open the scar of race, we will create the kind of politics that will undermine hope for our future success.

Joel Kotkin is executive editor of NewGeography.com and is a distinguished presidential fellow in urban futures at Chapman University, and contributing editor to the City Journal in New York. He is author of The City: A Global History. His newest book is The Next Hundred Million: America in 2050, released in February, 2010.

This piece originally appeared at The Daily Beast.

Voter sign photo by Bigstock.

The Biggest Winners From President Obama's Re-Election: Crony Capitalists

$
0
0

President Obama’s re-election does not, as some conservatives suggest, represent a triumph of socialism. Instead, it marks the massive endorsement of an expanding crony capitalism that ultimately could reshape the already troubled American economic system beyond recognition.

Nowhere is this clearer than in the President’s victory in the Great Lakes states of Ohio, Michigan, Ohio and Wisconsin. All four of these states are highly dependent on manufacturing and, in particular, the auto industry. Without the bailout, it seems doubtful that Obama — who lost the white working class decisively in most of the country — could have won these critical states.

The auto bailouts have resulted in industrial production growth since February 2010. Furthermore, there has been an industrial revival in the Ohio River valley, with rising output of steel, although much of this has to do with expansion of oil and gas production, which Obama has also taken credit for.

Other beneficiaries of the election will be other crony capitalists, notably in the beleaguered “green” energy industry. Tied closely to venture capitalists in Silicon Valley, the renewable capitalist have been losing big time in the marketplace, the victims of foreign, largely Chinese competition, and the burgeoning natural gas industry.

The Obama victory now provides these firms with a new lease on life. Initially Obama promised to create 5 million green jobs and has pledged $150 billion to his green jobs plan over 10 years. Yet with the Republicans in control of the House, he might not be able to fund them as prodigiously as he might have wanted.

But there may be another way to bail out the “green capitalists.” The federal government and its expanding bureaucracy — another big winner tonight — seems likely to issue Draconian edicts on greenhouse gas, now that the election is over. The whole coal industry is about to get savaged by new regulations and pressure is mounting to regulate fracking as well. Destroying the competition may be the one way to bail out the “green” crony capitalists.

Other crony capitalists could also benefit form the new regulatory assault: the rise essentially of national zoning. Backed by EPA and HUD, urban land speculators could see their suburban competitors regulated — as is already the case in California — into oblivion. Regions could find themselves obliged to built often expensive, and in some cases, wildly inappropriate transit system. This will benefit not only unions, who will build and operate these systems, but companies like Siemens who push for greater rail expansions at the expense of maintaining and improving such critical infrastructure as roads.

Ultimately the biggest winners may be those who finance municipal and state debt. Owing his election to the fiscal failures of New York, Illinois and California, Obama could have to use his executive power to forestall looming bankruptcies at the local and even state level. Ironically the biggest winner here in the crony capitalist sweepstakes will be firms like Goldman Sachs, who turned so vehemently against Obama, but have historically made much of their money on financing government operations.

Some people never seem to lose no matter what the result of the election.

Joel Kotkin is executive editor of NewGeography.com and is a distinguished presidential fellow in urban futures at Chapman University, and contributing editor to the City Journal in New York. He is author of The City: A Global History. His newest book is The Next Hundred Million: America in 2050, released in February, 2010.

This piece originally appeared at Forbes.

Barack Obama photo by Bigstock.

The Biggest Losers In The 2012 Elections: Entrepreneurs

$
0
0

Who lost the most in economic terms Tuesday? Certainly energy companies now face a potentially implacable foe — and a re-energized, increasingly hostile bureaucratic apparat. But it’s not them. Nor was it the rhetorically savaged plutocrats who in reality have been nurtured so well by the President’s economic tag team of Ben Bernanke and Tim Geithner.

The real losers are small business owners, or what might be called the aspirational middle class. The smaller business — with no galleon full of legal slaves pulling for them — will face more regulation of labor, particularly independent contracting. There will be more financial regulation, which is why Romney’s top contributors were all banks.

Small businesses will also face challenges associated with Obamacare, which now will sail on unchallenged. Health care costs are expected to go up 6.5% per employee. Some 58% of businesses say they will shift the costs to their employees. Many owners will face a higher individual tax bill: couples making $250,000 or more and singles making $200,000 or more will pay a 3.8% Medicare tax starting 2013.

All this is troubling, as American start-up rates are already falling. Much of what happens now occurs not from a great hunger to succeed as a desire to maintain. Outside of the inherently entrepreneurial immigrant classes, the only group of Americans starting business more than before are the fifty somethings and above. Many of these may simply be former employees of larger firms, now doing work sometimes in the same industry and even for the same company.

Business owners feel under attack. Gallup reports that, of all professions, those who own or operate their own business dislike President Obama the most.

So what happens now? As an employment engine, small business will continue to hobble given the expected renewed regulatory onslaught. In the blue states, this may come from local authorities, but everywhere from the increasingly powerful federal bureaucratic class. But there may be growth still in the individual proprietor class. For some of them Obama has cut health care costs and start-up costs and increased deductions. And if you take on no or few employees, many of the most difficult mandates will be less onerous.

In the next few years, entrepreneurial America will morph increasingly into what might be called “the 1099 economy.” Every state in the union has gained these kind of jobs, which include everything from a handyman to a physicist for rent, even those still way behind their 2007 employment.

This is occurring in both red and blue states. But increasingly it may become the best strategy to survive in the renewed blue America. If you can’t beat them in a stifling regulatory environment, you look to stay under the radar. No surprise then that self employment now accounts for the highest percentage of the workforce in the bluest of states. California, for example, ranked fourth, behind just Vermont, Maine and Montana.

Obama’s victory, to be sure, places new barriers in front of entrepreneurs of all kinds. But it will not kill off the entrepreneurial spirit, even if it increasingly occurs in an old closet or at the kitchen table.

Joel Kotkin is executive editor of NewGeography.com and is a distinguished presidential fellow in urban futures at Chapman University, and contributing editor to the City Journal in New York. He is author of The City: A Global History. His newest book is The Next Hundred Million: America in 2050, released in February, 2010.

This piece originally appeared at Forbes.

Barack Obama photo by Bigstock.

Why it's All About Ohio: The Five Nations of American Politics

$
0
0

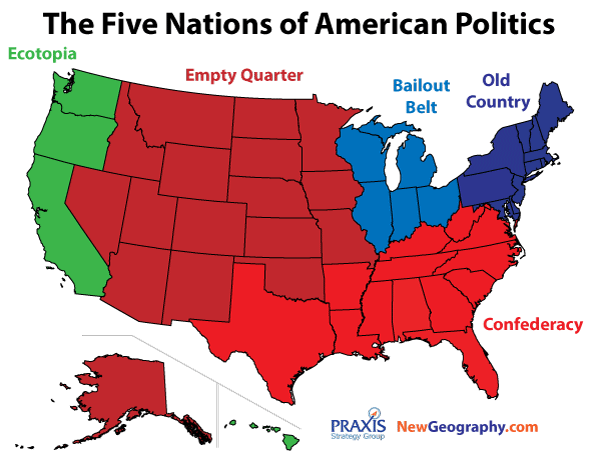
Looking at Tuesday’s election results, it’s clear the United States has morphed into five distinct political nations. This marks a sharp consolidation of the nine cultural and economic regions that sociologist Joel Garreau laid out 30 years ago in his landmark book “The Nine Nations of North America.”

In political terms there are two solid blue nations, perched on opposite coasts, that have formed a large and powerful bloc. Opposing them are two almost equally red countries, which include the historic Confederacy as well as the vast open reaches between the Texas panhandle and the Canadian border.

Between these two largely immovable blocs stands the fifth nation – essentially the Great Lakes industrial heartland. By winning this territory – which could be called “Bailout Nation” – President Barack Obama built a winning coalition. Though this part of the country has suffered economic decline and demographic stagnation for decades, it is now emerging, as former President George W. Bush would put it, as “the decider” of America’s political fate.

It’s no surprise that the coastal nations voted totally blue, reelecting the president, usually by margins of 10 points or more. The first of these nations can be dubbed “the Old Country,” the most European part of America.

It stretches along the coast, from Maine to Maryland, and is essentially the Democratic Party’s base. It’s where the intellectual heirs to the traditions of Progressivism, the New Deal and New Frontier are most entrenched.

Republican presidential nominee Mitt Romney lost by five percentage points or more in every state from this nation. In New York and Massachusetts, Obama won with 60 percent; in Washington, D.C., he received an astronomical 91 percent. Talk about home court advantage.

This area is heavily urbanized and its economy - except for parts of western Pennsylvania – has become largely de-industrialized. Good jobs here are in the professions and financial services. Unemployment is high in some states, particularly New York and Rhode Island, but low – below 7 percent – in Maryland and Massachusetts.

In the Old Country, natural resource extraction industries represent a small part of the economy and populations are concentrated in large metropolitan areas, with strong minority communities. It’s ideal territory for today’s Democratic Party, which is devotedly multicultural, strongly supportive of green energy and hostile to fossil fuels, large-scale agriculture and suburban sprawl.

The region is essentially solid blue – as even the appealing Senator Scott Brown (R-Mass.) found out Tuesday. In the Old Country, things remain more of the same. The election numbers were nearly identical to 2008. States like Rhode Island, for example, didn’t even shift a point, despite lower national polling for Obama and the Dems.

The Old Country’s coalition partner is Ecotopia, named after the science-fiction best-seller by Ernest Callenbach. “Ecotopia” tells the story of a successful breakaway “green” republic, which embraced most of the totems of West Coast progressivism, everything from renewable energy to militant feminism. This nation includes the states of California, Washington and Oregon. To these you can add Obama’s green-oriented, multicultural home state of Hawaii.

In political terms, coastal Ecotopians share their states with less progressive regions on the other side of the mountains. Eastern Washington, Oregon and California all tend to be conservative – but are usually outnumbered, as they were this year, by the more densely populated coastal areas.

Together, these two nations represent 186 electoral votes, almost equal to Romney’s total. They overwhelmingly send Democrats to Congress. And they have outsized influence. Ecotopia is home to Silicon Valley, while the Old Country, along with Hollywood, has turned the culture industry into an adjunct of the Democratic Party.

For their part, the Republicans increasingly control two nations. One is the former Confederacy, which supported the former Massachusetts governor – only Virginia and possibly Florida slipped over to the Obama. This region has some of the nation’s strongest population growth and a strong allegiance to the military, one key GOP voting bloc.

Energy defines much of the southern rim of the Confederacy. Texas and Louisiana have seen strong growth from oil and gas. Even the remaining Democrats in this region fear federal energy regulation under Obama will slow their economic growth. President Bill Clinton won Louisiana in 1996; this year the state went for Romney by an astounding 20 points.

The other nation in the GOP camp is the Empty Quarter, the vast region stretching from the Great Plains and the Inter-mountain West to Alaska. This is where much of America’s food is grown and minerals extracted. Like the Gulf Coast, many in these states feel they have much to lose from a Democratic victory.

Despite losing Nevada and Colorado and possibly Florida to Obama on Tuesday, these regions have seen expanding shares of Republican vote. Across these two nations, Romney’s margin was considerably better than Senator John McCain’s in 2008. In some states, his margins expanded by 10 points or more. From 2008 to 2012, Obama lost by 10 percentage points in Utah; 7 points in North Dakota and 5 points in Montana, South Dakota, Wyoming and Idaho.

Yet these Republican nations may not be as stable as their Democratic counterparts. Conservative politics is almost extinct in places like California and New York. But Great Plains voters, however unhappy with Obama, still send some Democrats to the Senate, particularly when the GOP nominates extreme-right candidates.

Ultimately, the decision comes down to the Great Lakes industrial region – which we can call the Bailout Belt. For these areas, which have high concentrations of manufacturing, the auto bailout was a godsend. And the region is now even more prosperous by the discovery of vast amounts of oil and gas.

The benefits of the bailouts in this election – communities revived, families uplifted – outweighed those from fossil fuel producers, which now operate under threat of a possible Environmental Protection Agency-ordered shutdown. These states, outside of Indiana, stayed with Obama – by a handsome seven-point margin in Michigan. In virtually all these states, however, Romney did better than McCain.

The president was quiet about fracking during the election. Now eyes turn to the EPA, since the House of Representatives would likely oppose a ban of any kind. The Bailout Belt may have to decide its energy future before it sides with either party.

And where this region decides to go, so goes the nation – the entire nation.

Joel Kotkin is executive editor of NewGeography.com and is a distinguished presidential fellow in urban futures at Chapman University, and contributing editor to the City Journal in New York. He is author of The City: A Global History. His newest book is The Next Hundred Million: America in 2050, released in February, 2010.

This piece originally appeared at Reuters.

Barack Obama photo by Bigstock.

America’s Most Competitive Metros Since 2010

$
0
0

The San Jose metro is adding jobs at a faster clip than any other large metro area in the U.S. since the recession. Houston, Austin, Detroit — and a handful of other metros — have also been stellar performers the last few years. But how much of the job growth in these and other metros can be explained by unique regional factors rather than national trends?

To answer that question, EMSI used a standard economic analysis method called shift share, focusing on overall job change from 2010 to 2012. We followed the same methodology that we used to show which states are gaining in competitiveness. However, for this post, we looked at the 100 most populous metropolitan statistical areas (MSAs) in the U.S.

The goal is to see which metros are becoming more competitive (that is, gaining a larger share of total job creation) and which are losing their share of the jobs being created. We ranked all 100 metros based on the overall competitive effect and what percentage of jobs (from 2010-2012) are based on competitive effects.

Our Approach

Shift-share analysis, which can also be referred to as “regional competitiveness analysis,” helps us distinguish between growth that is primarily based on big national forces (the proverbial “rising tide lifts all boats” analogy) vs. local competitive advantages. The primary components of shift share are as follows:

  • Industrial Mix Effect— This represents the share of regional industry growth explained by the growth of the specific industry at the national level.
  • National Growth Effect— This explains how much of the regional industry’s growth is explained by the overall growth of the national economy.
  • Expected Change – This is simply the rate of growth of the particular industry at the national level (equals the sum of the industrial mix and national growth effects).
  • Regional Competitiveness Effect— This explains how much of the change in a given industry is due to some unique competitive advantage that the region possesses, because the growth cannot be explained by national trends in that industry or the economy as whole.

Read more on shift share in this article: Understanding Shift Share.

About the Data

The infographic and table below display aggregate industry data for the 100 most populous MSAs from 2010-2012. To generate our ranking, we summed the overall competitive effect for each broad 2-digit industry sector (e.g., agriculture, manufacturing, health care, construction, etc.) and added them together to yield a single MSA-wide number that indicates the overall competitiveness of the economy as compared to the total economy. We calculate the competitive effect by subtracting the expected jobs (the number of jobs expected for each MSA based on national economic trends) from the total jobs. The difference between the total and expected is the competitive effect. If the competitive effect is positive, then the MSA has exceeded expectations and created more jobs than national trends would have suggested. It is therefore gaining a greater share of the total jobs being created. If the competitive effect is negative, then the MSA is below what we would expect given national trends. In this case the MSA is losing a greater share of the total jobs being created.

The Results

Top Five

The two metros at the top have been economic stalwarts in recent years. After that, our analysis revealed a couple surprises.

Note: The figure in parentheses is the percentage of total 2012 jobs that are due to growing (or declining) competitiveness from 2010-2012.

1. San Jose-Sunnyvale-Santa Clara, Calif. (3.5%) – The heart of Silicon Valley has created 35,803 more jobs than expected since 2010, thanks largely to the information sector (most notably, internet publishing and broadcasting and web search portals and software publishers). Electronic computer manufacturing has also seen more-than-expected growth in the San Jose metro area, as has warehouse clubs and supercenters and private elementary/secondary schools.

In other words, the high-paying jobs generated in the tech sector appear to be leading to more jobs in the retail trade and education sectors than we would expect based on national trends.

2. Austin-Round Rock-San Marcos, Texas (3.4%) – Save for government and retail trade, every broad sector in the Austin metro area has exceeded expectations. The result is 30,472 more jobs than expected from 2010 and 2012. The strongest sub-sectors in Austin are wired telecommunications carriers; wholesale trade agents and brokers; and corporate, subsidiary, and regional managing offices.

3. Bakersfield, Calif. (3.1%) – Bakersfield has one of the highest unemployment rates (12%) among all metropolitan areas. But better-than-expected job growth in the construction and agricultural sectors has propelled this San Joaquin Valley metro to third in our ranking. The agriculture boom has been seen most in crop production and farm labor contractors/crew leaders. Meanwhile, much of the surprising construction growth has been in two sub-sectors — oil and gas pipeline and related structures construction and electrical contractors and other wiring installation contractors.

4. Provo-Orem, Utah (2.8%) – Next is Provo-Orem, which has the fourth-fewest total jobs of any top 100 metro (an estimated 211,639). This metro area just south of Salt Lake City has seen surprisingly large job gains in professional, scientific, and technical services (see here for more); administrative and support services; specialty trade contractors; state/local government; and computer and electronic product manufacturing.

A note on Utah: Provo-Orem, Salt Lake City (No. 6), and Ogden-Clearfield (No. 29) are all in the upper third of the top 100 metros in competitiveness.

5. Houston-Sugar Land-Bayton, Texas (2.7%)— No metro in America has added more jobs than expected since 2010 than Houston (79,815). These jobs aren’t coming in oil & gas extraction or support activities for mining — Houston’s actually doing worse than expected in these two booming industries — but rather in health care, accommodation/food service, and manufacturing. In particular, home health care services, offices of physicians, restaurants, employment services, and fabricated metal product manufacturing are far surpassing expected growth.

The rest of the top 10:

  • Salt Lake City, Utah (2.6%)
  • Grand Rapids-Wyoming, Mich. (2.4%)
  • Omaha-Council Bluffs, Neb.-Iowa (2.4%)
  • Raleigh-Cary, N.C. (2.1%)
  • Detroit-Warren-Livonia, Mich. (2.1%)

Bottom Five

The other side of our ranking is dominated by Southern metros, particularly those in Florida. But an even more common thread with the poor performers is the greater-than-expected losses in administrative and support services, a sub-sector that comprises“establishments engaged in activities that support the day-to-day operations of other organizations,” according to the BLS.

100. Augusta-Richmond County, Ga.-S.C. (-3.9%)— This metro has lost nearly 9,000 more jobs than expected, most in waste treatment and disposal, employment services, and services to buildings and dwellings.

99. Albuquerque, N.M. (-3.4%)— Albuquerque has fared worse than Augusta in total unexpected jobs lost (13,691), with the losses coming in similar areas — employment services, architectural/engineering services, electrical/electronic goods merchant wholesalers, and services to buildings and dwellings. Construction and government (local and federal) have also taken worse-than-expected hits.

98. Palm Bay-Melbourne-Titusville, Fla. (-3.3%)— Like Augusta and Albuquerque, the Palm Bay-Melbourne area has done poorly in administrative and support services (particularly facilities support services) and construction (particularly specialty trade contractors).

97. Lakeland-Winter Haven, Fla. (-2.4%)— Once again, this Florida metro has seen massive (and unexpected) decline in admin and support services, most notably employment services. Government, manufacturing, and construction have also lost more jobs than expected since 2010.

96. Modesto, Calif. (-2.3%)— This Central Valley metro area has struggled more than expected in manufacturing (especially the making of snack foods and frozen foods). Elementary and secondary schools have also suffered.

The rest of the bottom 10:

  • Milwaukee-Waukesha-West Allis, Wis. (-2.3%)
  • Providence-New Bedford-Fall River, R.I.-Mass. (-2.2%)
  • Little Rock-North Little Rock-Conway, Ark. (-2.1%)
  • Birmingham-Hoover, Ala. (-2.0%)
  • St. Louis, Mo.-Ill. (-2.0%)

For the full list of the largest 100 metros, see our accompanying graphic or the table below.

MSA
2012 Jobs
Expected Jobs (2012)
Competitive Effect
% of Jobs Due to Comp. Effect
Source: QCEW Employees, Non-QCEW Employees & Self-Employed - EMSI 2012.3 Class of Worker
San Jose-Sunnyvale-Santa Clara, CA
1,014,025
978,222
35,803
3.5%
Austin-Round Rock-San Marcos, TX
894,864
864,392
30,472
3.4%
Bakersfield-Delano, CA
320,625
310,730
9,895
3.1%
Provo-Orem, UT
211,639
205,722
5,918
2.8%
Houston-Sugar Land-Baytown, TX
2,952,899
2,873,083
79,815
2.7%
Salt Lake City, UT
692,741
674,849
17,892
2.6%
Grand Rapids-Wyoming, MI
402,848
393,138
9,709
2.4%
Omaha-Council Bluffs, NE-IA
501,309
518,223
12,078
2.4%
Raleigh-Cary, NC
563,555
551,457
12,098
2.1%
Detroit-Warren-Livonia, MI
1,902,208
1,861,948
40,260
2.1%
Charleston-North Charleston-Summerville, SC
323,937
317,316
6,621
2.0%
Oklahoma City, OK
649,469
636,476
12,992
2.0%
Knoxville, TN
363,742
356,712
7,030
1.9%
Louisville/Jefferson County, KY-IN
654,871
643,365
11,506
1.8%
McAllen-Edinburg-Mission, TX
268,924
264,231
4,693
1.7%
Phoenix-Mesa-Glendale, AZ
1,916,060
1,883,203
32,857
1.7%
Seattle-Tacoma-Bellevue, WA
1,929,525
1,897,882
31,643
1.6%
Stockton, CA
236,202
232,430
3,773
1.6%
Columbus, OH
998,599
984,248
14,351
1.4%
Dallas-Fort Worth-Arlington, TX
3,263,838
3,219,303
44,535
1.4%
El Paso, TX
336,649
332,206
4,443
1.3%
San Francisco-Oakland-Fremont, CA
2,252,514
2,224,520
27,993
1.2%
Nashville-Davidson--Murfreesboro--Franklin, TN
853,134
843,884
9,250
1.1%
Charlotte-Gastonia-Rock Hill, NC-SC
909,444
899,769
9,675
1.1%
Denver-Aurora-Broomfield, CO
1,367,534
1,354,042
13,492
1.0%
Boise City-Nampa, ID
294,333
291,569
2,764
0.9%
Portland-Vancouver-Hillsboro, OR-WA
1,140,720
1,130,624
10,096
0.9%
San Antonio-New Braunfels, TX
990,899
982,408
8,491
0.9%
Ogden-Clearfield, UT
218,356
216,733
1,624
0.7%
Rochester, NY
535,248
531,540
3,709
0.7%
Fresno, CA
379,331
377,181
2,151
0.6%
Washington-Arlington-Alexandria, DC-VA-MD-WV
3,289,069
3,271,193
17,876
0.5%
San Diego-Carlsbad-San Marcos, CA
1,538,488
1,530,699
7,789
0.5%
Indianapolis-Carmel, IN
942,512
938,843
3,669
0.4%
Columbia, SC
380,167
378,761
1,406
0.4%
Atlanta-Sandy Springs-Marietta, GA
2,463,751
2,455,059
8,691
0.4%
Riverside-San Bernardino-Ontario, CA
1,390,906
1,386,822
4,084
0.3%
Chattanooga, TN-GA
251,933
251,223
709
0.3%
Minneapolis-St. Paul-Bloomington, MN-WI
1,892,017
1,886,761
5,256
0.3%
Tulsa, OK
460,519
459,782
737
0.2%
Des Moines-West Des Moines, IA
354,286
353,772
514
0.1%
Cincinnati-Middletown, OH-KY-IN
1,066,016
1,064,816
1,201
0.1%
Honolulu, HI
541,273
540,736
537
0.1%
Allentown-Bethlehem-Easton, PA-NJ
364,683
364,345
338
0.1%
Greensboro-High Point, NC
370,755
370,532
223
0.1%
Cape Coral-Fort Myers, FL
219,651
219,550
101
0.0%
New York-Northern New Jersey-Long Island, NY-NJ-PA
9,111,820
9,109,799
2,021
0.0%
Baton Rouge, LA
403,099
403,086
12
0.0%
Miami-Fort Lauderdale-Pompano Beach, FL
2,468,634
2,468,912
(279)
0.0%
Worcester, MA
353,710
353,834
(124)
0.0%
Richmond, VA
657,018
657,325
(306)
0.0%
Albany-Schenectady-Troy, NY
459,754
460,069
(316)
-0.1%
Tampa-St. Petersburg-Clearwater, FL
1,218,515
1,219,507
(992)
-0.1%
Jackson, MS
267,877
295,684
(427)
-0.2%
Los Angeles-Long Beach-Santa Ana, CA
6,143,325
6,154,926
(11,601)
-0.2%
Baltimore-Towson, MD
1,400,446
1,403,859
(3,413)
-0.2%
Orlando-Kissimmee-Sanford, FL
1,071,935
1,074,559
(2,624)
-0.2%
Pittsburgh, PA
1,214,245
1,218,032
(3,786)
-0.3%
Dayton, OH
402,031
403,437
(1,406)
-0.3%
Boston-Cambridge-Quincy, MA-NH
2,665,828
2,678,362
(12,534)
-0.5%
Akron, OH
341,435
343,042
(1,607)
-0.5%
Scranton--Wilkes-Barre, PA
272,047
273,574
(1,527)
-0.6%
Greenville-Mauldin-Easley, SC
315,824
317,638
(1,814)
-0.6%
Colorado Springs, CO
316,090
318,171
(2,081)
-0.7%
New Orleans-Metairie-Kenner, LA
582,177
586,123
(3,946)
-0.7%
Chicago-Joliet-Naperville, IL-IN-WI
4,549,732
4,582,384
(32,652)
-0.7%
Youngstown-Warren-Boardman, OH-PA
240,559
242,321
(1,762)
-0.7%
Toledo, OH
317,987
320,534
(2,548)
-0.8%
Lancaster, PA
252,253
254,288
(2,034)
-0.8%
Buffalo-Niagara Falls, NY
562,953
567,694
(4,741)
-0.8%
Memphis, TN-MS-AR
653,464
659,019
(5,555)
-0.9%
Virginia Beach-Norfolk-Newport News, VA-NC
867,917
875,329
(7,412)
-0.9%
Jacksonville, FL
634,680
640,178
(5,498)
-0.9%
Springfield, MA
322,963
325,801
(2,838)
-0.9%
Hartford-West Hartford-East Hartford, CT
651,931
658,182
(6,251)
-1.0%
Syracuse, NY
324,948
328,190
(3,242)
-1.0%
Oxnard-Thousand Oaks-Ventura, CA
348,124
351,742
(3,618)
-1.0%
Bridgeport-Stamford-Norwalk, CT
458,643
463,816
(5,174)
-1.1%
Wichita, KS
312,394
315,968
(3,575)
-1.1%
North Port-Bradenton-Sarasota, FL
265,715
268,786
(3,071)
-1.2%
Kansas City, MO-KS
1,053,613
1,066,414
(12,802)
-1.2%
Tucson, AZ
401,113
406,033
(4,920)
-1.2%
Sacramento--Arden-Arcade--Roseville, CA
957,779
969,534
(11,755)
-1.2%
Poughkeepsie-Newburgh-Middletown, NY
271,783
275,231
(3,447)
-1.3%
New Haven-Milford, CT
394,666
400,055
(5,390)
-1.4%
Madison, WI
361,542
366,488
(4,946)
-1.4%
Las Vegas-Paradise, NV
883,649
896,729
(13,081)
-1.5%
Cleveland-Elyria-Mentor, OH
1,056,167
1,075,588
(19,421)
-1.8%
Harrisburg-Carlisle, PA
334,668
341,123
(6,454)
-1.9%
Philadelphia-Camden-Wilmington, PA-NJ-DE-MD
2,866,722
2,922,956
(56,235)
-2.0%
St. Louis, MO-IL
1,391,853
1,419,265
(27,412)
-2.0%
Birmingham-Hoover, AL
520,572
531,024
(10,452)
-2.0%
Little Rock-North Little Rock-Conway, AR
362,670
370,444
(7,774)
-2.1%
Providence-New Bedford-Fall River, RI-MA
722,008
738,127
(16,119)
-2.2%
Milwaukee-Waukesha-West Allis, WI
849,075
868,393
(19,318)
-2.3%
Modesto, CA
180,419
184,600
(4,181)
-2.3%
Lakeland-Winter Haven, FL
210,233
215,306
(5,073)
-2.4%
Palm Bay-Melbourne-Titusville, FL
207,642
214,568
(6,926)
-3.3%
Albuquerque, NM
399,997
413,688
(13,691)
-3.4%
Augusta-Richmond County, GA-SC
232,695
241,661
(8,966)
-3.9%

The data and analysis for this post comes from Analyst, EMSI’s web-based labor market data and analysis tool. For more information, email Josh Wright. Follow us on Twitter @DesktopEcon.

Austin skyline image by Bigstock.


What Stifles Good Housing Development?

$
0
0

We can't afford outmoded attitudes in housing development anymore - not as businesses, not as citizens and certainly not as development professionals. As development consultants, we're often asked to provide detailed input on project design and the marketing of developments throughout the United States and Canada. We usually work with a local team of engineering consultants that provides construction drawings and serves as intermediaries for the project with local governments. We have concluded that the choice of selecting the engineering consultant is one of the pivotal issues for the success of a development. The developer has to be the one to hold the engineers accountable. Otherwise, all design will continue to be done to minimum standards instead of excellence.

Problems with the consulting engineer generally fall into two broad groups: complacency and undisclosed conflicts of interest. To illustrate, we'll look at two recent examples from projects owned by clients of Rick Harrison Site Design Studio.

The first involves a small proposed neighborhood in Texas. The initial design was drafted before either the site boundaries or floodplain were accurately surveyed, and yielded a total of 35 lots of 0.6 acres or more. Rick prepared an initial revision of the original design, resulting in a more aesthetically pleasing and efficient neighborhood, while maintaining the 0.6 acre minimum lot size. Accurate boundary lines, contours and floodplain were eventually furnished to create a precision plat for submittal. The developer requested that Rick update the revised design, and indicated that he was willing to sacrifice one of the lots in order to allow a more spacious entrance.

While preparing the precision plat Rick realized that he didn’t know why the lots were at least 0.6 acres instead of the more common 0.5 acres on lots without city sewer. In two rounds of questioning, the consulting engineer indicated that the minimum lot size was 0.6 acres, or 26,000 ft². The area of 6/10th of an acre is actually 26,136 ft², so Rick questioned the engineer again. This time, the engineer explained that the minimum lot size was actually 0.5 acres, but his firm had developed a “rule of thumb” that 26,000 ft² was the 0.5 acre lot net of easement areas. However, in the specific case of this development the only easement required was a 12’-wide utility easement along the front lot line. The extra 0.1 acres per lot was a “fudge factor,” developed over time to compensate for the well-known difficulty in computing precise lot sizing using existing CAD software.

The “land surface based” technology Rick used to create the revised design requires no additional time to obtain precision areas, so he was able to easily design each lot to meet the actual 21,780 ft² (half acre) minimum exclusive of the 12’ easement. The new design eliminated the fudge factor, and yielded 37 lots, including the more open entrance area (three more than expected). Furthermore, reductions were made to the length of street..

“Fudge factors” are rules of thumb intended to make the engineer’s work easier, and to provide enough margin in the plans to account for omissions or miscalculations. The problem with fudge factors is that they adversely impact the profitability of their clients’ projects. The chart below demonstrates the differences:


Initial Plan

Revised Plan

Difference

Lot size

0.6 acres (minimum)

0.5 acres

At least 4,356 ft.² per lot

Number of lots

34

37

3

Lot value

$75,000

$75,000


Gross sales

$2,550,000

$2,775,000

$225,000

Pavement area

89,479 ft²

81,509 ft²

7,970 ft²

Estimated cost

$447,400

$407,550

$39,850

Eliminating an imprecise fudge factor would yield a $225,000 increase in gross sales. Since the only increase in costs were per lot consulting fees, almost all of the gross revenue would drop straight to the bottom line. In addition, the community would benefit from a more attractive neighborhood with substantially less street pavement maintained in perpetuity, and a higher property tax base. If the developer was unwilling to sacrifice profits, the cost of each lot would have had to increase by $6,600 to the consumer.

The second example concerns another proposed residential development, this one in North Dakota, in a city prone to severe flooding. As most people know, paved areas do not absorb rainfall, so it would seem logical that the more pavement area in a new development here, the bigger the potential for runoff, which leads to more flooding. In addition, the wider the streets, the more surface area the city has to snowplow and maintain. All these issues – the snowplowing, the road maintenance and the increased water runoff – are burdens to current and future taxpayers, with no discernible benefits to offset the burden. So imagine Rick's surprise when the consulting engineer refused to even submit a plan for 50-foot-wide rights-of-way with 28-foot-wide street sections, instead of the 66-foot-wide rights-of-way with 37-foot-wide street sections, as specified by existing city regulations.

To understand the issue, look at the origin of the standard street width requirement. Centuries ago, roads were unpaved, and were built with wide ditches to handle drainage alongside them. The 66 foot length reflected a land surveyor’s chain, developed in the year 1620 by a British clergyman interested in developing a system that would use easily available tools to survey land in the British countryside. His system caught on, and was brought to the New World by British immigrants and used for hundreds of years. Perhaps as recently as 100 years ago it made sense to use a single surveyors’ chain as the width of community streets, and so many towns did so. Today, most cities have eliminated drainage ditches in modern subdivisions, replacing them with storm sewers and more efficient design. These changes have allowed narrower street and pavement widths, with positive cost and environmental impacts.

So — the minimum street right-of-way in this modern North Dakota city is the result of a decision to make roads 66 feet wide, due to the fact that 400 years ago an English clergyman connected a hundred links that were 6 1/2 inch long to make a convenient, 66 foot long "chain". To our knowledge, there is no other reason.

Given that surrounding cities have adopted modern standards, and that the logic behind narrower streets is solid, Rick could have presented a compelling case. But the engineer refused to even make the proposal. Why not propose a common sense solution? Complacency? Perhaps. The desire to comply with every regulation to avoid conflict? More likely. Are the engineers fees based upon the percentage of construction cost, with wider streets guaranteeing higher fees? Also likely.

Unsustainable? Absolutely.

In the first example, outmoded rules of thumb related to inadequate CAD technology would have cost Rick's client at least $250,000, and would have burdened the local county government with a significantly diminished potential property tax base. In the second example, the engineer's lack of concern for the long-term benefit of his client (with whom he has a contractual or fiduciary relationship), and to the public (to whom he has a professional responsibility), has burdened the community with exaggerated flooding problems and approximately 33% more pavement to be snow plowed and maintained for as long as the community exists.

We can't keep fudging to hide poor practices. If we are ever to achieve a more sustainable world and create better communities and housing products, we simply cannot accept mediocre design, technology and attitude.

Rick Harrison is President of Rick Harrison Site Design Studio and Neighborhood Innovations, LLC. He is author of Prefurbia: Reinventing The Suburbs From Disdainable To Sustainable and creator of Performance Planning System. His websites are rhsdplanning.com and pps-vr.com. Skip Preble, MAI, CCIM is a real estate analyst and land development consultant specializing in market analysis, feasibility studies, project value optimization and market value opinions. He can be reached through his website, landanlytics.com.

Flickr Photo by Billy Hunt: "This is from my photo essay observing the course of development in Charlottesville, Virginia".

The New York Marathon Vs the NFL

$
0
0

The ING New York City Marathon was cancelled, but the football game of the New York Giants against the Pittsburgh Steelers went ahead. Why? The nation places a higher value on sedentary spectators popping Advil and Viagra, than on lean and wiry runners, whose idea of a big night out is pasta and a few sips of Gatorade. It also helps that pro football has a televised address on 21st and Primetime, while the pleasure of a marathon is simply to finish one, even in the dark.

In canceling the road race, New York Mayor Michael Bloomberg made the decision that it would have been insensitive to have marathoners running around a city that was still digging out from the wreckage caused by Sandy, or past those lining up with gas cans. Nor did anyone want police officers or emergency health workers officials involved with the marathon when they could be assisting the recovery of Staten Island or Breezy Point.

On the same Sunday, however, the National Football League, took the position that, even with gasoline short for essential services, the game must go on, much as it did earlier this fall when the regular game officials were locked out of work. The office of NFL Commissioner Roger Goodell spends a lot of time invoking the mysticism of “the Game,” as though it were the Force or the Church—a higher being (“brought to you by Ford...”).

To protect the interests of the Game, the commissioner regularly suspends or levies fines on coaches or players for putting out bounties, making unfair hits, showing positive drug tests, or for conduct “unbecoming” an NFL player, which ranges from sponsoring dog fighting to taking part in drive-by shootings. His job description is to sustain the illusion that the Raider Nation is the spiritual heir to those chariots of fire.

The reason the NFL takes itself more seriously than, say, the Vatican, is that its revenue stream is built on the faith that the games are sport: athletic contests with winners and losers, not simply pay-per-view broadcasts that seek to divide each given Sunday into thousands of thirty-second spots, each of which can be sold to beer companies, hotel chains, and airlines.

The league structure is an oligopoly, sustained by a sweetheart antitrust exemption, with each franchise sharing the collective revenue. Having a winning season doesn’t make the owner of an NFL team richer; the Jets are worth about as much as the 49ers (who actually win their games), and the average value of each franchise is more than $1 billion. The value of the NFL is that it can sell everything from diapers to cures for erectile dysfunction.

To get an idea of the extent to which team owners have contempt for the actual sport of football, look no further than the Great Referee Crisis. The calamity began when about a hundred NFL game officials, at the time of a contract renegotiation, decided that they were entitled to keep their defined-benefit pension plans—meaning, their retirement packages would continue to be a percentage of their annual salaries, which average about $150,000 (for three hours of work, seventeen weeks a year, with a twenty-minute break for halftime).

Owners of the NFL’s 32 football franchises—which have annual payrolls (measured in “cap space”) of $120 million and evenly split a revenue jackpot of $9.5 billion—reacted with indignation that the referees had the temerity to expect a pension from the league, and locked them out from work, pending a contract settlement.

Instead of canceling the games as well, the Dickensian owners scoured the playing fields of Pop Warner and Arena football to find officials capable of throwing a few flags and uttering the phrase, “After further review, the ruling on the field stands.”

The replacement refs showed up at the games like dads waylaid from the stands to umpire at Little League. They mastered the coin toss, some rudiments of whistle-blowing, and were given directions to the sideline peep shows that rerun the booth reviews of controversial plays. The replacement officials thought they were judging a game, and never understood they were regulating an industry.

Without the regular officials seamlessly stopping the game after each punt, incomplete pass, out-of-bounds, or change of possession, there would be no way to securitize the game’s three hours into marketable segments lasting thirty seconds, which is how the league pulls down $9.5 billion a year. Untrained in choreography, the stopgap refs had to go.

In its formative years, when the Game was played with leather helmets, games lasted sixty minutes. At half time, the teams switched ends. The two-minute warning was a courtesy to coaches, but not the occasion to hawk Ram Tough pickups, eTrade, Geico, and Domino's Pizza. Imagine how little the Game would be worth if the clock simply ran for an hour?

When football was a sport, players were expected to play offense, defense, kick, tackle, run, pass, and block. Now, as befits a featherbedded monopoly, the average pro team has about twenty coaches and specialists are engaged to handle kick returns, long snapping, field-goal holding, and obscure functions in “nickel” and “dime” formations on defense. Hyped as he might be, Tim Tebow is scorned as a marginal player in the age of free substitution. In the glory days, however, he would have been compared favorably to Jim Thorpe, as he can do it all.

Perhaps the reason that this year's New York marathon was deemed unworthy to help heal the wounds of a flooded city is because it is only a sport. Its participants are amateurs who buy their own uniforms, travel at their own expense, and sleep on sofas. The runners are in it for the love of the game, to compete, perchance to finish — not to provide a stage set for Cialis-popping men to leer at their wives.

When the networks and corporations finally get their hands on the New York City Marathon, maybe then it will become worthy of a superstorm indulgence. It could go on air with about 32 runners, national sponsors, halftime around mile 13, booth reviews, and coaches’ challenges. The spectacle could last all day, and Dan, Shannon, Boomer, and Coach Cowher could analyze the winners. Then no one would mess with the Race.

Matthew Stevenson, a contributing editor of Harper's Magazine, is the author of Remembering the Twentieth Century Limited, a collection of historical travel essays. His next book is "Whistle-Stopping America".
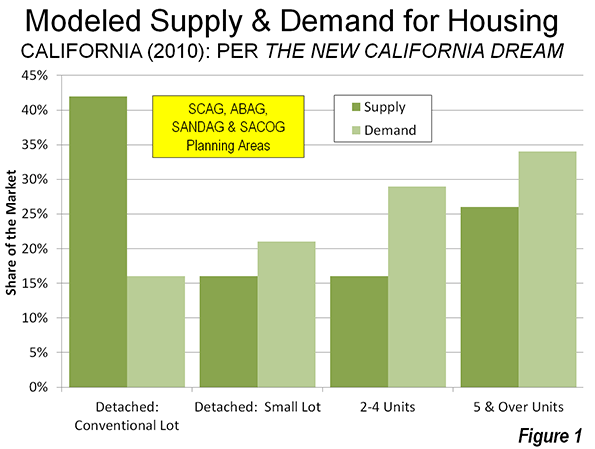
Flickr photo by Joe Shlabotnik: Little Giants. A wall of New York Giants clothes for sale at BuyBuy Baby.

A Housing Preference Sea Change? Not in California

$
0
0

For some time, many in the urban planning community have been proclaiming a "sea-change" in household preferences away from suburban housing in the United States.

Perhaps no one is more identified with the "sea-change" thesis than Arthur C. Nelson, Presidential Professor, City & Metropolitan Planning, University of Utah. Professor Nelson has provided detailed modeled market estimates for California in a paper published by the Urban Land Institute, entitled The New California Dream: How Demographic and Economic Trends May Shape the Housing Market: A Land Use Scenario for 2020 and 2035 (He had made generally similar points in a Journal of the American Planning Association article in 2006).

Professor Nelson says that the supply of detached housing on what he defines as conventional sized lots (more than 1/8 acre) is far greater than the demand in California (Note 1). He further finds that the demand of detached housing on smaller lots is far greater than the supply. Professor Nelson's conclusions are principally modeled from stated preference surveys, which can mislead if people act differently when they make choices in the real world.

The Modeled Demand Estimates

Nelson models the demand for housing types in California's largest four planning regions (Southern California Association of Governments for the Los Angeles area, and the Bay Area Association of Governments for the San Francisco-San Jose area, the San Diego Association of Governments and the Sacramento Area Council of Governments). He estimates 2010 both supply and demand. His demand estimates rely strongly on data from three early 2000s stated preference surveys conducted by the Public Policy Institute of California (PPIC).

  • Nelson's data indicates a strong preference for multi-family housing, which he places at 62% of demand in 2010, compared to the 2000 supply of 42%. Thus, the demand for multi-family housing is suggested to be one half above the supply.
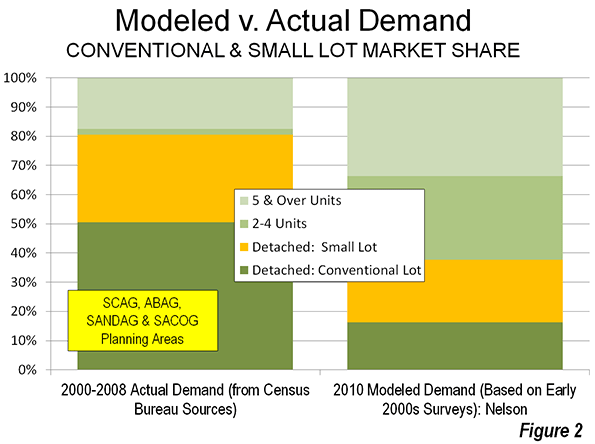
  • The most stunning conclusion, however, is an over-supply of detached housing on conventional lots that Nelson estimates. Compared to a 2000 supply of 42% of the market, Nelson estimates the demand to be only 16%. This would indicate the supply of such housing to be more than 2.5 times the demand as is indicated in Figure 1.

Nelson's findings on conventional lot detached housing have obtained the most attention. He surmises that virtually all of the demand over the next 25 years can be met by the existing stock of conventional lot detached housing. This is music to the ears of many urban planners, who have for decades demonized  the suburbanization that has been preferred by the overwhelming majority of Californians (and Americans, and people elsewhere in the world where they can afford them).

Actual Demand: Revealed Preferences: 2000-2008

To perform a similar analysis, we used revealed preference data: the actual change in housing by type from the 2000 Census data to the latest American Community Survey (ACS) 2006-2010 data at the census tract level (Note 2).  

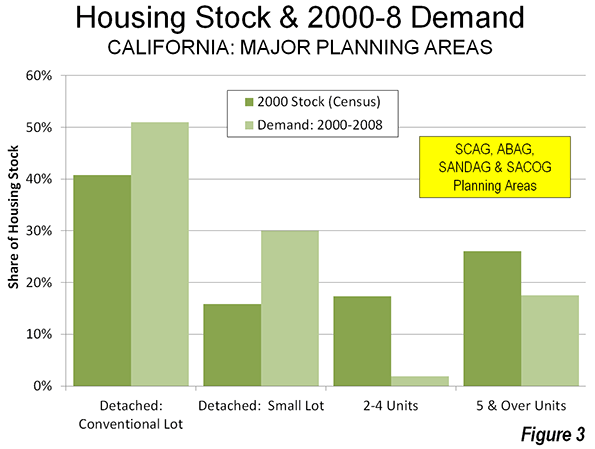
In contrast to Professor Nelson's estimates, the demand data indicates a strong continuing preference among Californians for detached housing on conventional lots. From 2000 to 2008 (the middle year for the 2006-2010 data), 51 percent of the new occupied housing in the four planning areas is estimated to have been detached on conventional lots (Figure 2). This is more than three times the 16% demand estimate in Professor Nelson's data. In fact, the actual demand was higher than the 2000 supply (42%), indicating that the demand for detached houses on conventional lots has increased.

If there is a sea change, it would appear to be in multi-family housing. In contrast with the 62% share for multi-family dwellings modeled by Nelson, the actual demand indicated in the census tract data was two-thirds less, at 19% (Figure 3), well below the supply of 43 percent in 2000. This suggests a tanking of demand for multi-family housing, even as builders, in California and elsewhere, put more product on the market.

Why Accounts for the Difference

Various factors appear likely to contribute to the difference between the modeled demand and the actual demand.

Smaller Lots and Higher Density Do Not Mean Shorter Commutes: The PPIC survey questions implied a connection between larger lots (lower density) and longer commutes. This is the broadly shared perception, but in reality houses on smaller lots (necessarily in higher density neighborhoods) do not mean shorter commutes. This is illustrated in a chart by Southern California Association of Governments (SCAG) researchers on page 62 of The New California Dream. In the original SCAG document, the authors note that"commuting time is about the same for all density" (Figure 4).  This is not surprising, since higher densities are associated with more intense traffic congestion and with greater transit use, both of which lengthen commutes (Note 3).

The "higher density means shorter commute" myth is rooted in the obsolete mono-centric conception of the city. Almost all US urban areas have become poly-centric with job locations highly-dispersed, as jobs have followed people to the suburbs. Gordon and Lee (Note 4) have shown that work trip travel times in the United States are shorter to dispersed employment locations than to central business districts or secondary business centers (such as "Edge Cities").  

Invalid Perceptions of Transit Mobility: Professor Nelson also stresses stated preference responses showing that many people would prefer to live near transit service. All things being equal, who wouldn't?

But all things are not equal. Living near transit does not mean practical transit access to most of the urban area. In most cases, only a car can provide that. Transit systems are necessarily focused on downtown areas (central business districts), which contain, on average, only 8% of employment in the four planning regions. , Travel to other destinations is usually inconvenient, because of time-consuming transfers, or   not available at all.

A Brookings Institution report indicated that 87 percent of people in California's major metropolitan areas (Los Angeles, San Francisco, Riverside-San Bernardino, San Diego and Sacramento) live within walking distance of transit. Yet, the average employee can reach only 6% of the jobs in their respective metropolitan area in 45 minutes (Figure 5). By contrast, the average work trip travel time ranges from 25 minutes to under 30 minutes in the four planning regions .

Households thinking about a move to higher density could have been, upon more serious examination, deterred by transit's severe mobility limitations. 

Data Insufficiently Robust for the Modeling: There is also the potential that the PPIC surveys, with their general questions, were not of sufficient robustness to support Professor Nelson’s assertions. For example, PPIC did not define the size of small lots.

Planning and Reality

If households were so eager to move from detached houses on conventional lots to smaller lots, 2000 to 2008 would have been the ideal time. The mortgage industry was literally falling over itself to fund home purchases. Urban core wannabes could have flooded the market pursuing their smaller lot "stated preferences." The actual, revealed preference data says they did not, which is also indicated by the continuing strength of suburban growth relative to central city growth (Note 5).

Thus, the modeled demand estimates in The New California Dream appear to be at substantial odds with the actual demand.This is much more than an academic issue. The conclusions of The New California Dream have achieved the status of sacred text in the canon of urban planning and are mouthed unquestioningly by organizations like the Urban Land Institute.

Worse, demand estimates from The New California Dream are being relied upon in regional transportation plans being developed by California's metropolitan planning organizations (MPOs). This is particularly risky because these same MPOs have been granted greater power over housing under California's Senate Bill 375, goaded on by a sue-happy state Attorney General's office. The attempt by MPOs to impose their housing plans and regulations on consumers could well backfire, for investors in condominium and multifamily housing.  This would not be a first time that   developers followed urban planning illusions like lemmings over a cliff, to which huge losses in the last decade attest. The more destructive effects, however, are likely to be paid by households and the economies of California's metropolitan areas.

---------

Note 1: More than 70% of the detached housing stock was on conventional lots in 2000.

Note 2: There is no census tract data on detached house lot size. We scaled the detached housing data from the 2000 census to match Professor Nelson's distribution of detached housing supply by lot size, using population density. Nelson's method and ours were sufficiently similar that the results should have been roughly comparable. As the text indicates, they were not.

Note 3:In each of the three PPIC surveys, respondents are asked to choose between housing alternatives that are high in the questions to commute "lengths." From the description and survey instruments in the PPIC reports, there is no indication that respondents were given any idea what commute "length" means. There are two way to judge commute "length." One is distance or miles, while the other is time. Based upon the PPIC survey instrument, it cannot be known which definition was perceived by the respondents.

Even so, it seems more likely that the term "commute length" was perceived by respondents in time rather than in distance by respondents. Each day, people have only so many hours and minutes available. However, distance is not so constrained, depending upon the speed of the commute. Further, the extensive research on commuting often refers to "travel budgets," which are expressed in time, not distance.

Note 4:Reference: Gordon, P. and B. Lee (2012), "Spatial Structure and Travel: Trends in Commuting and Non-Commuting Travels in US Metropolitan Areas," draft chapter for the International Handbook on Transport and Development edited by Robin Hickman, David Bonilla, Moshe Givoni and David Banister.

Note 5: The most recent year (2010-2011), for which the Census Bureau had issued invalid municipal population estimates, indicated a continued the trend toward suburban rather than urban core growth, as has been shown by Trulia Chief Economist Jed Kolko (see: Even After the Housing Bust, Americans Still Love the Suburbs).

=======

Photograph: Suburban San Diego

Wendell Cox is a Visiting Professor, Conservatoire National des Arts et Metiers, Paris and the author of “War on the Dream: How Anti-Sprawl Policy Threatens the Quality of Life.”

For A Preview Of Obama's America In 2016, Look At The Crack-Up Of California

$
0
0

Conservatives of the paranoid stripe flocked to the documentary “America: 2016” during the run up to the election, but you don’t have to time travel to catch a vision of President Obama’s plans for the future. It’s playing already in California.

Some East Coast commentators like Jeff Greenfield saw the election as “a good night” for the Golden State, which the President carried by 20 points, 10 times his margin elsewhere — a massive bear hug from Californians. It certainly was a great night for Democrats, who now have a two-thirds majority in the state legislature and can spend a massive tax increase that targets families making over $250,000 a year.

These results assure that California will serve as the prime testing ground for President Obama’s form of post-economic liberalism. Every dream program that the Administration embraces — cap and trade, massive taxes on the rich, high-speed rail — is either in place or on the drawing boards. In Sacramento, blue staters don’t even have to worry about over-reach because the Republicans here have dried into a withered husk. They have about as much influence on what happens here as our family’s dog Roxy, and she’s much cuter.

California now stands as blue America’s end point, but contrary to the media celebration, it presents not such a pretty picture. Even amidst our decennial tech bubble, the state’s unemployment is among the highest in the country, and is trending down very slowly. Over the past decade, California has slowed as a source of fast-growth companies, as a recent Kauffman Foundation study shows, while other states such as Washington, Virginia, Texas and Utah have gained ground.

Old-style liberals might point out that California’s progressive policies have not done much for the working- or middle-class folks often trumpeted as its beneficiaries. Instead income inequality has grown far more than the national average. True, the fortunate sliver of dot-com geniuses make billions, but the ranks of the poor have swollen to the point that the state, with 12% of the nation’s population, account for one third of its welfare cases. Large parts of the state, notably in the interior regions, suffer unemployment in the 15% range and higher.

Demographics may be working to the Democratic Party’s favor, but not so much for the state. As California loses its allure as a place of opportunity for all but a few — the best connected, educated and affluent — the state is losing its magnetic appeal to migrants from both inside and outside the state. Domestic migration has been negative for 18 of the past 20 years; immigration from abroad is at the lowest point in the past two decades. In terms of growth in college-educated residents, only San Diego managed to add more than the national average from 2000 to 2010; both the Bay Area and Los Angeles were considerably below. (See “The U.S. Cities Getting Smarter The Fastest“)

The growing diversity, a good thing in itself, masks a demographic stagnation. California, remarkable for its population growth over the past century, now is heading toward “zero population growth,” notes economist Bill Watkins; the state now barely grows 1% a year. Los Angeles, the state’s largest urban area, grew less, in total numbers, in the last decade than at any time in the last 100 years.

Although this might elicit hosanas among greens, who generally would like to see fewer people, the emerging reality is sobering. Increasingly the state bifurcates between a generally older, predominately white and Asian coast, and an interior increasingly populated by generally less affluent Hispanics and African-Americans. California now ranks near the bottom in science skills, and while its population over 65 is the fifth largest in the nation, the number of those under 35 is only 23rd. And the future looks even bleaker: California’s eighth graders rank a pathetic 47th in terms of science test scores.

So how did the ladder of opportunity crack in a state that has massive natural and human resources, not to mention a kind climate and spectacular scenery?

To some extent, California is suffering the aftereffects of a century of success. Over that period, a large coastal affluent class, now increasingly elderly, enjoyed a spectacular run of rising real estate prices and in some places, like Silicon Valley, a progression of stock windfalls. Once split among liberals and conservatives, this group is now almost uniformly deep blue, as epitomized by Marin County, which voted almost three to one for Obama.

Blacks, Hispanics and young people may be the new core of the Democratic Party, but  aging affluents may be the most important constituency. Unlike minorities or young people, they have increasingly little reason to support growth. After all, they have theirs and more people simply means more traffic, congestion and crowded schools. Increasingly many affluents also don’t have children — the liberal heartland of San Francisco has among the lowest fertility rates on the continent — the need to create jobs and opportunities for the next generation is not a pressing priority. Feeling “good” about themselves, by voting for the progressive agenda, is good enough for themselves.

Perhaps the most shocking impact of California’s shift to one-party rule has been the complicity of the once powerful business community. In recent years, California’s business community has accommodated itself to the state’s ever higher taxes and regulations. They acquiesced meekly to the state’s climate change regulations, making the development of anything than largely undesired dense housing developments all but impossible. Industries that use energy — including oil refineries but also chip-makers and server farms — simply go elsewhere, either to another country or across the border to less relentlessly regulated states.

In the battle over the Proposition 30 tax hike, notes small business advocate Joel Fox, Governor Brown and his legislative allies prevented business leaders from opposing the tax hike. “It was a lot of support the Governor — or else,” he says. Some business organizations, like the establishmentarian Bay Area Council, even actively promoted the income tax increase, which makes the state’s rate the highest in the continental United States. For this, they get praise from progressive mouthpieces like The San Francisco Chronicle as “brave business leaders.”

To me, this “bravery” looks like a lot more like “Stockholm syndrome,” where a hostage, as famously happened with Patty Hearst, begins to identify with their captors. Once world-beaters and fierce political competitors, California’s business leaders know that if they oppose the Governor or the legislative leadership’s tax or regulatory agenda, he can threaten them with measures specifically targeted at their industry. So the magnates meekly accept an impossible business climate, knowing, like much of the state’s middle class, that they will be welcomed elsewhere.

In this sense California business has devolved into something analogous to Mexican enterprise under the old PRI regime. If you want to survive, you bow, curtsey and pay up — or else. Business demanded little in return, for example, insisting that education funds be conditional on comprehensive reform. After the election some business types belatedly have started to express concerns about the new Democratic supermajority and what they will do with those new tax revenues. But their inevitable fallback strategy will likely be falling on one knee to beg Governor Brown to save them from an ever more invigorated progressive majority.

This cringing and economically counterproductive approach to governance will soon make its appearance in a Washington. In the next few months, business lobbyists will wear out their knee pads trying to appease the increasingly all powerful regulatory clerisy. Some of the new players may also be the very people who have been killing California. There’s already widespread talk of bringing L.A.’s term-limited Mayor Antonio Villaraigosa to Washington for a big cabinet posting, perhaps as Transportation Secretary. All this rewards an empty suit who has presided over Los Angeles’ economic and demographic decline, leading that great city to the brink of bankruptcy, and a political system rife with cronyism.

But in Barack Obama’s America, failure can often pave the road to success. In this age, incompetence is no barrier to promotion, and failed states like California and Illinois are taken not as examples to avoid but as models to emulate. So if you want to get an advanced look at what America could look like in 2016, don’t go to the movies. Just hop a plane to California; after all, the Golden State is a wonderful place to visit in winter. And , as things are going, we will need the cash.

Joel Kotkin is executive editor of NewGeography.com and is a distinguished presidential fellow in urban futures at Chapman University, and contributing editor to the City Journal in New York. He is author of The City: A Global History. His newest book is The Next Hundred Million: America in 2050, released in February, 2010.

This piece originally appeared at Forbes.

Barack Obama photo by Bigstock.

The Emerging Professional, Scientific, and Technical Sector

$
0
0

Although the professional, scientific, and technical industry sector makes up only 6% of the U.S. workforce, it was responsible for 10% of national job growth from 2010 to 2012. In addition, the broad industry (NAICS 54) grew by 6% in the past two years, which illustrates our nation’s march toward a more technical, STEM type workforce. There are over 9.2 million jobs in this industry, which is driven by sub-sectors like computer system design services and management, scientific, and technical consulting services.


The Industries

In this post we’d like to give you a better picture of the top sub-sectors that are driving the professional, scientific, and technical sector. To do this, we’ve selected 16 six-digit industries that fall into this sector. Each one is either:

  1. A big employer (offices of lawyers or engineering services),
  2. Showing impressive % growth since 2010 (media buying or translation and interpretation services), or
  3. Adding a lot of jobs (computer systems design or custom computer programming).

We have included the 2010 and 2012 job totals, change, % change, and top occupations that staff each industry. Many of these sectors can be thought of as “specialists” that generate their income by providing consulting or professional services to their consumers. NOTE: We have not included every sub-sector of NAICS 54 on this list.

NAICS CodeDescription2010 Jobs2012 JobsChange% ChangeTop Occupations
Source: QCEW Employees, Non-QCEW Employees & Self-Employed - EMSI 2012.3 Class of Worker
541512Computer Systems Design Services726,989815,72988,74012%Software Developers, Computer Systems Analysts
541511Custom Computer Programming Services697,318768,09370,77510%Software Developers, Computer Systems Analysts
541611Administrative Management and General Management Consulting Services487,428544,97657,54812%Management Analysts, Services Sales Representatives
541330Engineering Services911,012947,18836,1764%Civil Enginners, Mechanical Engineers
541613Marketing Consulting Services207,357234,47027,11313%Management Analysts, Market Research Analysts
541712Research and Development in the Physical, Engineering, and Life Sciences (except Biotechnology)440,152463,88723,7355%Medical Scientists, Biological Technicians
541211Offices of Certified Public Accountants415,253436,07420,8215%Accountants, Bookkeeping Clerks
541810Advertising Agencies200,344214,08313,7397%Advertising Sales Agents, Public Relations Specialists
541380Testing Laboratories147,147160,56513,4189%Chemical Technicians, Chemists
541214Payroll Services151,406164,76213,3569%Accountants, Bookkeeping Clerks
541711Research and Development in Biotechnology141,037148,5617,5245%Medical Scientists, Biological Technicians
541614Process, Physical Distribution, and Logistics Consulting Services105,799112,0256,2266%Management Analysts, Business Operations Specialists
541110Offices of Lawyers1,256,4371,260,7174,2800%Lawyers, Paralegals
541930Translation and Interpretation Services25,53429,7944,26017%Interviewers, Interpreters and Translators
541830Media Buying Agencies12,51015,3362,82623%Advertising Sales Agents, Public Relations Specialists
541360Geophysical Surveying and Mapping Services17,40918,8981,4899%Surveying and Mapping Technicians, Architects
Total5,943,1336,335,157392,0247%


Observations:

  • Computer systems design and custom computer programming services are the clear leaders and have added a ton of jobs — 89,000 and 71,000 jobs respectively, representing 12% and 10% increases. Software developers and computer system analysts are key occupations for these two sectors. If you are looking for a job, these are fantastic occupations and industries to focus on.
  • While not a large sector, media buying agencies has the fastest % growth (23%) since 2010. This translates to nearly 3,000 new jobs in an industry that employs 15,000. From a talent perspective, advertising agencies (which grew by nearly 14,000 new jobs, or 7%, since 2010) is similar to media buy agencies. Advertising sales agents and public relations specialists are two common occupations that should be in demand across these two sectors.
  • The biggest sector on this list is offices of lawyers. It employs 1.26 million, but has had zero job growth since 2010.

These are the big “E’s” on the eye chart, but other sub-sectors are also worth noting. Research and development (research and development in the physical, engineering and life sciences and research and development in biotechnology) as well as testing laboratories are showing good growth. Together they have added 45,000 new jobs since 2010. They all employ medical scientists, biological and chemical techs, and chemists.

Industries related to business operations also appear to be thriving:

  • Offices of certified public accountants (436,000 total jobs, 21,000 new jobs in two years, 5% growth)
  • Payroll services (165,000 total jobs, 13,000 new jobs in two years, 9% growth)
  • Process, physical distribution, and logistics consulting services (112,000 total jobs, 6,000 new jobs in two years, 6% growth)
  • Administrative management and general management consulting services (545,000 total jobs, 58,000 new jobs in two years, 12% growth)

Geography

Before we take a closer look at the actual occupations, let’s consider how these jobs are distributed. Using Analyst, we filtered for which states have the highest concentration of the 16 sub-sectors. Maryland, Washington, D.C., and Virginia have by far the highest concentration of these industries. These three geographies are also the only areas that we would call “highly specialized” for these jobs, which means that the concentration of professional, scientific, and technical jobs is more than 60% greater than the national average, and is actually getting closer to twice what a typical region has. After that, we see that Massachusetts, New Jersey, Colorado, New Mexico, and California have concentrations between 1.2 and 1.59, which means the jobs are 20-60% more concentrated in these states (the national average equals 1.0).

The other states’ concentrations are closer to or (in most cases) below the national average. Why are most states below the national average? Good question. This is because the states with higher concentrations have such a huge number of these jobs: they throw off the average. This is a great illustration of “clustering.”

Now, if your state doesn’t have a high concentration of these jobs at the moment, fear not. Quite a few states out there have shown some pretty impressive growth for these industries over the past two years. In particular, North Dakota (17% since 2010), Delaware (13%), Georgia (12%), Utah (11%), Vermont (11%), New York (11%), Washington (11%), and South Carolina (10%). A lot of states have shown moderate growth and just a handful have actually declined.

Finally, here are the large MSAs with the highest concentrations (1.2 and up). The San Jose and Washington, D.C. MSAs have concentrations more than twice as high as the national average. See the table for more detail:

MSA Name2010 Jobs2012 JobsChange% Change2012 Avg. Annual Wage2010 National Location Quotient
Washington-Arlington-Alexandria, DC-VA-MD-WV374,638391,99117,3535%$124,4952.85
San Jose-Sunnyvale-Santa Clara, CA99,801109,2319,4309%$157,4252.55
San Francisco-Oakland-Fremont, CA167,627187,35019,72312%$133,1941.88
Boston-Cambridge-Quincy, MA-NH192,212207,62815,4168%$127,1301.79
Detroit-Warren-Livonia, MI119,558132,09912,54110%$95,7741.61
San Diego-Carlsbad-San Marcos, CA99,262102,4263,1643%$112,5131.61
Denver-Aurora-Broomfield, CO81,55387,1555,6027%$102,4841.50
Raleigh-Cary, NC32,70135,4992,7989%$89,6751.48
Baltimore-Towson, MD81,53987,5095,9707%$102,2461.44
Austin-Round Rock-San Marcos, TX49,22455,7736,54913%$102,7321.42
New York-Northern New Jersey-Long Island, NY-NJ-PA505,778551,93346,1559%$121,8561.38
Philadelphia-Camden-Wilmington, PA-NJ-DE-MD159,168165,0375,8694%$110,5911.36
Atlanta-Sandy Springs-Marietta, GA124,980142,26817,28814%$95,3381.27
Houston-Sugar Land-Baytown, TX144,338154,70910,3717%$110,1091.26
Kansas City, MO-KS53,42458,5805,15610%$90,2961.25
Chicago-Joliet-Naperville, IL-IN-WI227,237238,15010,9135%$108,3631.24
Columbus, OH48,40452,0783,6748%$90,3481.23
Seattle-Tacoma-Bellevue, WA90,243101,01010,76712%$100,1381.18


The Occupations

So what jobs are we talking about? We’ve mentioned a few already, but you’ll see a list of the top occupations for the 16 aforementioned sub-sectors below. These are jobs that we could consider “emerging” as these sectors continue to thrive. Note: The growth of these occupations isn’t quite as high as we’ve seen for some of the sub-sectors. This is mostly because the occupations are staffed across other industries that aren’t growing quite as much (or not at all).

For this table, we’re including the occupations from our previous table, their total employment (across all industries — not just the ones above), their 2010-2012 growth, average hourly wage, and typical education level:

OccupationTotal Employment, 20122010-2012 GrowthAvg Hourly WageAvg Ed Level
Computer Systems Analysts527,3505.0%$3845% Bachelor's
Software Developers and Computer Systems Analysts996,9028.0%$4450% Bachelor's
Management Analysts727,3485.0%$3641% Bachelor's
Services Sales Reps710,3852.5%$2538% Bachelors
Civil Engineers269,9081.4%$3757% Bachelor's
Mechanical Engineers253,0336.5%$3852% Bachelor's
Biological Technicians75,1671.6%$1937% Bachelor's
Accountants1,273,8773.7%$3056% Bachelor's
Bookkeeping, Accounting and Auditing Clerks1,859,7522.5%$1739% Some College (no degree)
Medical Scientists104,3967.0%$3764% Doctoral
Busuiness Operations Specialists1,004,9631.2%$3033% Bachelor's
Lawyers768,5960%$5197% Professional Degree
Paralegals and Legal Assistants269,0612.7%$2334% Bachelor's
Interviewers228,6662.8%$1535% Some College (no degree)
Interpreters and Translators68,8958.2%$2230% Bachelor's
Advertising Sales Agents186,4171.4%$2247% Bachelor's
Public Relations Specialists233,6043.5%$2656% Bachelor's
Surveying and Mapping Technicians51,8960%$2037% Some College (no degree)
Architects110,5120%$3352% Bachelor's


Observations:

  • All but four of the 18 occupations are dominated by a workforce that has attained at least a bachelor’s degree. The only jobs where this is not the case are bookkeepers (39% have some college, no degree), medical scientists (64% doctoral degree), lawyers (97% professional degree), and surveying and mapping technicians (37% some college, no degree).
  • Translators and software developers have the highest growth percentage (8.2% and 8.0%, respectively) since 2010. They are followed by medical scientists (7%) and mechanical engineers (6.5%).
  • Lawyers, architects, and surveying and mapping techs did not experience any growth since 2010.

Here are a few helpful definitions if you’d like to explore some of these jobs further:

  1. Computer systems analysts– Analyze science, engineering, business, and other data processing problems to implement and improve computer systems.
  2. Management analysts– Conduct organizational studies and evaluations, design systems and procedures, conduct work simplification and measurement studies, and prepare operations and procedures manuals to assist management in operating more efficiently and effectively.
  3. Biological technicians– Assist biological and medical scientists in laboratories. Set up, operate, and maintain laboratory instruments and equipment, monitor experiments, make observations, and calculate and record results. May analyze organic substances, such as blood, food, and drugs.
  4. Medical scientists– Conduct research dealing with the understanding of human diseases and the improvement of human health. Engage in clinical investigation, research and development, or other related activities. Includes physicians, dentists, public health specialists, pharmacologists, and medical pathologists who primarily conduct research.
  5. Interviewers– Interview persons by telephone, mail, in person, or by other means for the purpose of completing forms, applications, or questionnaires. Ask specific questions, record answers, and assist persons with completing form. May sort, classify, and file forms.
  6. Advertising sales agents– Sell or solicit advertising space, time, or media in publications, signage, TV, radio, or Internet establishments or public spaces.
  7. Surveying and mapping technicians– Perform surveying and mapping duties, usually under the direction of an engineer, surveyor, cartographer, or photogrammetrist to obtain data used for construction, mapmaking, boundary location, mining, or other purposes.

Conclusions

So, quick summary:

  • Though it is small, the professional, scientific, and technical sector is responsible for a greater and greater share of jobs.
  • The jobs tend to be more concentrated in specific areas, namely Maryland, D.C., and Virginia.
  • The jobs tend to be associated with four-year degrees.
  • The industries tend to be more highly specialized — meaning, they add value and do a lot of consulting work based on that expertise.
  • Business operations, logistics, software, scientific research, and engineering are the major areas of focus.

Data and analysis from this report came from Analyst, EMSI’s web-based labor market tool. Please contact Rob Sentz (rob@economicmodeling.com) if you have questions or comments. Follow us @desktopecon.

Lab technician photo by Bigstock.

The Rise of the Third Coast

$
0
0

In the wilds of Louisiana’s St. James Parish, amid the alligators and sugar plantations, Lester Hart is building the $750 million steel plant of his dreams. Over the past decade, Hart has constructed plants for steel producer Nucor everywhere from Trinidad to North Carolina. Today, he says, Nucor sees its big opportunities here, along the banks of the Mississippi River, roughly an hour west of New Orleans by car.

“The political climate here is conducive to growth,” Hart explains as he steers his truck up to the edge of a steep levee. “We are here because so much is going on in this state and this region. With the growth of the petrochemical and industrial sectors, this is the place to be.” Already, some 500 people are working on the project. When completed in 2013, the plant—which is expected to process more than 3.75 million tons of iron ore a year—will create about 150 permanent jobs immediately. Another 150 are expected after a second development phase.

Nucor isn’t alone in coming to Louisiana, or to the vast, emerging region along the Gulf Coast. The American economy, long dominated by the East and West Coasts, is undergoing a dramatic geographic shift toward this area. The country’s next great megacity, Houston, is here; so is a resurgent New Orleans, as well as other growing port cities that serve as gateways to Latin America and beyond. While the other two coasts struggle with economic stagnation and dysfunctional politics, the Third Coast—the urbanized, broadly coastal region spanning the Gulf from Brownsville, Texas, to greater Tampa—is emerging as a center of industry, innovation, and economic growth.

The Gulf area long lacked industry. Even when the Spaniards and the French ruled it, the Gulf was a planters’ region, and its economy was largely dependent on exports of indigo, sugar, and cotton. The economy also relied on the slave labor that made such exports possible, a state of affairs that continued until the Civil War. After the war, the region therefore lost much of its economic influence as growth shifted to the rail-dominated east-west axis, though the construction of the Panama Canal eventually helped New Orleans and Mobile, Alabama, again become busy ports. Developing slowly, the Third Coast’s agricultural economy was dominated largely by tenant farmers, who in 1930 constituted more than 60 percent of the agricultural producers in an arc from Texas to Georgia.

The Gulf region also suffered from vulnerability to natural disasters. In 1900, more than a century before Katrina, the deadliest hurricane in American history all but destroyed Galveston, Texas. In 1927, the Great Mississippi Flood inundated a 27,000-square-mile area, much of it in Texas, Mississippi, and Louisiana. And then there was the hot and humid climate, especially miserable in those pre-air-conditioning days.

What Joel Garreau, in his landmark book The Nine Nations of North America, writes about the South as a whole—that it became a “region identified with stagnation—backward, rural, poor and racist, a colony of the industrialized north, enamored of an allegedly glorious past of dubious authenticity”—applied with particular force to the Gulf Coast, whose major cities, especially New Orleans, were seen as hopelessly corrupt and decadent. It’s no surprise that for much of the last century, the region exported people, particularly those with skills, to other parts of the United States.

So it’s particularly striking that the region’s steady economic growth is now attracting so many people. Over the past decade, Texas and Florida have ranked first and second among the states in net domestic immigration, combining for a gain of roughly 2 million people. Together, Houston and Tampa have gained more than 1.5 million people over the course of the decade; in fact, in 2008 and 2009, net domestic migration to Houston was the highest of any major metropolitan area. An examination of migration flows to Houston, New Orleans, and Tampa by Praxis Strategy Group, where I work as a senior consultant, shows that many of their new citizens are coming from the East and West Coasts, especially New York and California. Also over the past decade, Houston has attracted as many foreign immigrants, relative to its population, as New York has—a considerably higher rate than in such historical immigration hubs as Chicago, Seattle, and Boston, though still lower than in San Francisco, Los Angeles, and Miami.

What’s more, the Third Coast is winning the battle of the brains. Over the past decade, according to the Census Bureau, 300,000 people with bachelor’s degrees have relocated to Houston. Between 2007 and 2009, as demographer Wendell Cox has chronicled, New Orleans—which had hemorrhaged educated people for the previous few decades—enjoyed the largest-percentage gain of educated people of any metropolitan area with a population of over 1 million. The New York Times reported in 2010 that Tulane University, the city’s premier higher-education establishment, had received nearly 44,000 applications, more than any other private school in the country. The largest group of applicants came not from Louisiana but from California, with New York and Texas not far behind.

Thanks to all this immigration, the population of the Third Coast has grown 14 percent over the past decade, more than twice the national average. The growth continued even when the Great Recession struck in 2008. Between 2008 and 2011, Houston grew by 6.7 percent, according to census estimates, while New Orleans expanded by 6.9 percent; over the same period, the nation’s population increased by only 2.5 percent. New Orleans, the biggest population loser in the first half of the last decade, is now the fastest-growing U.S. metropolitan region. Many smaller cities in the region—Brownsville, Gulfport, Lafayette, and Baton Rouge, for example—have also grown faster than the national average. Overall, the Gulf region is expected to be home to 61.4 million people by 2025, according to the Census Bureau.

Many of the region’s new arrivals are attracted by the low cost of living. The median home-price-to-income ratio in Houston, Tampa, and New Orleans is roughly one-half that of New York, Los Angeles, San Francisco, or San Jose. Over the last decade, Houston boasted the highest growth in personal income of any of the country’s 75 largest metropolitan areas.

The region’s most dramatic appeal, however, is its remarkable employment growth. Between 2001 and 2012, the number of jobs along the Third Coast, according to Economic Modeling Specialists International (EMSI), increased by 7.6 percent, well over three times the national growth rate. The vitality of the Third Coast persisted even during a brutal recession, with four metropolitan areas—Houston, Corpus Christi, Brownsville, and New Orleans—gaining jobs between 2008 and 2012, even as the nation’s job rolls shrank by 3.6 percent. Of the three states that have recovered all the jobs lost during the recession, two—Texas and Louisiana—are on the Third Coast.

The region’s job-creation engine is powered by the growth of basic industries: manufacturing, energy, and agricultural commodities. The region from south Texas to Florida now bristles with scores of new steel plants, petrochemical facilities, and factories producing everything from airplanes to canned food. Along with the Great Plains and the Intermountain West, the Gulf Coast has enjoyed a huge boost from energy and other commodity growth. Over the past decade, Texas alone has added nearly 200,000 oil- and gas-sector jobs, with an average salary of about $75,000. Thanks largely to expansion in energy, manufacturing, and engineering services, Houston now boasts a considerably higher per-capita concentration of STEM jobs—those relating to science, technology, engineering, or mathematics—than Chicago, Los Angeles, or New York, according to an analysis by EMSI.

The magazine Site Selection says that four of the Gulf states are among the nation’s 12 most attractive states to investors: Texas topped the list, with Louisiana ranking seventh, Florida tenth, and Alabama 12th. Texas and Louisiana also ranked first and third among the 50 states in terms of new plants built or being constructed. “There’s been a drastic change in the business climate here,” says Chris McCarty, director of the University of Florida’s Bureau of Economic and Business Research. “A lot of regulations have been moved aside, and there’s a big push by the state to get out of the way.”

Energy is the key driver. The Third Coast already accounts for roughly 28 percent of the nation’s oil and gas employment, despite the federal crackdown on offshore drilling after the 2010 Deepwater Horizon disaster. The region boasts new shale plays, such as those now being developed in northern Louisiana, and massive crude reserves, which follow the arc of the Gulf Coast from Brownsville to New Orleans.

The future for American energy is bright. According to the consultancy PFC Energy, the United States is on course to surpass Russia and Saudi Arabia as the world’s leading oil and gas producer sometime during this decade. With the Atlantic and Pacific coasts either banning or sharply curtailing energy production, the Gulf’s pro-business, right-to-work states have emerged as the likely staging ground for this energy resurgence. Here, unlike in California or New York, support for energy development tends to be highly bipartisan. Third Coast Democrats—such as Louisiana U.S. senator Mary Landrieu, New Orleans mayor Mitch Landrieu (her brother), and Houston mayor Annise Parker—can be as ferocious in their defense of the industry as any Republican. “Texas and Louisiana understand the oil business,” says Ralph Phillip, vice president of a Valero oil refinery located just a few miles from the rising Nucor steel plant. “They understand what this industry is all about and expect you to manage the risks. If you want to do a permit in California, they won’t return your call. But here they want everything to work.”

Not only does the energy industry employ people and pay them well; the effect works in reverse, too, with a growing pool of skilled workers offering companies like Nucor and Valero a compelling reason to expand into the Third Coast. “When you are building a petrochemical facility, you have a great need for skills in such things as maintenance and construction,” Phillip points out. “If you open up in another part of the country, you have to bring in people to run things. Here, the skills are all over the Gulf.”

Another important part of the region’s economy is exports, since trade patterns are shifting away from the Atlantic and Pacific coasts and toward the Gulf. Since 2003, the Third Coast’s total exports have tripled in value, and its share of total American exports has grown from roughly 10 percent to nearly 16 percent. Last year, trade reached record levels at the Port of New Orleans, says Donald van de Werken, director of the U.S. Export Assistance Center in that city. Louisiana has become a dominant player in the agricultural-export industry, with half of the nation’s grain exports going through the state’s ports. Houston now ranks as the top port in the United States in terms of total value of exports; New Orleans ranks fifth.

The trends favoring the Third Coast will accelerate further once the $5.25 billion Panama Canal expansion is completed in 2014, as I pointed out in Forbes last year. The wider canal will be able to accommodate Asian megaships, which are currently forced to dock in California. That will open the Gulf to more Pacific trade, since most northeastern and West Coast ports have been reluctant to make the necessary capital investments to capture it. China’s abandonment of the Maoist ideal of self-sufficiency and its growing willingness to rely on imports of food and other items represent a huge opportunity for the region.

When Garreau published Nine Nations 30-some years ago, he predicted that as growth kicked in, the Gulf region would “clot” into an archipelago of cities similar to the Boston–New York–Washington megalopolis, or to the band stretching from San Diego through Los Angeles and San Francisco to Portland and Seattle. If he proves right, Houston will be the hub of this new system, much as New York anchors the East Coast and Los Angeles the West.

The greater Houston metropolitan area is one of the fastest-growing in the country; its population, now 6 million, is expected to double over the next 20 years. Houston is also the nation’s third-largest manufacturing city, behind New York and Chicago. Over the past decade, the city and its surrounding communities have added almost 20,000 heavy-manufacturing jobs, the most of any metropolitan area in the United States. Further, Houston has the third-largest representation of consular offices, after Los Angeles and New York, and it hosts more Fortune 500 companies—22, as of 2011—than any city other than Gotham. Over the past half-century, says Federal Reserve economist Bill Gilmer, Houston has consolidated its position as the center of the global fossil-fuel industry. In 1960, Houston was home to just one of the nation’s large energy firms, ranking well behind New York, Los Angeles, and even Tulsa; by 2007, 16 such companies were headquartered in Houston, more than in those three cities combined.

The burgeoning health-care industry is also finding a home in Houston, especially at the Texas Medical Center—“the largest medical complex in the world,” its website boasts. Like so many things in Houston, this cluster of 48 nonprofit hospitals, colleges, and universities owes its existence largely to the energy industry. According to its chief executive, Richard Wainerdi, the center benefits from “probably the biggest confluence of philanthropy in the world, and a lot of it is oil money.” Every day, 160,000 people enter the vast campus, equal in size to Chicago’s downtown Loop; its office space, now over 28.3 million square feet, exceeds not only that of downtown Houston but also that of downtown Los Angeles. The figure is expected to surpass 41 million square feet by the end of 2014, making the center the seventh-largest business district in the nation.

Houston’s solid business climate empowers entrepreneurs. Between 2008 and 2011, according to a study by EMSI, the number of self-employed workers grew more quickly in Houston than in any other large metropolitan area. Greater numbers of educated workers are coming, too: Houston’s total increase in people with bachelor’s degrees over the past decade bested Philadelphia’s, was three times that of San Jose, and was twice that of San Diego. “I don’t get the pushback I used to get” from potential recruits, says Chris Schoettelkotte, who founded Manhattan Resources, a Houston-based executive-recruiting firm, 13 years ago. “You try to find a city with a better economy and better job prospects than us!”

Though Houston has always been a good place to do business, it continues to suffer from a bad cultural image. In 1946, journalist John Gunther described Houston as a place “where few people think about anything but money.” It was, he added, “the noisiest city” in the nation, “with a residential section mostly ugly and barren, a city without a single good restaurant and of hotels with cockroaches.” The miserable city that Gunther described no longer exists, but residents on the other two coasts have been slow to acknowledge that development, despite Houston’s first-class museums and lively restaurant scene. “Let’s face it, we have a bad reputation,” says L. E. Simmons, a legendary Houston energy investor. “But the good news is, it keeps the stylish opportunists out. It makes us kind of an urban secret.”

Houston’s cultural weakness—more perceived than real these days—has long been New Orleans’s strong suit. Yet the Big Easy’s long-standing appeal to artists, musicians, and writers did little to dispel the city’s image as merely a tourist haven, and a poor one at that. The problem, as Hurricane Katrina made all too plain, was a corrupt city plagued by enormous class and racial divisions and one of the lowest average wages in the country. The city’s urban core continues to endure one of the highest violent-crime rates in the nation.

Though energy is responsible for much of New Orleans’s recent economic growth, the city has also begun attracting the information industry. Since 2005, New Orleans’s tech employment has surged by 19 percent, more than six times the national average. And at a time when movie production has dropped nationally, Louisiana has nearly tripled its production of motion pictures, from 33 per year in 2002–07 to 92 per year in 2008–10.

East of New Orleans, Mobile has a different strength: manufacturing. Nearly 1.5 million cars and trucks are made within four hours of the city. In fact, the Third Coast, together with the adjacent southeastern manufacturing belt, is now competing with the Great Lakes as the center of the automotive industry. And Tampa, with robust population growth and Florida’s largest port—including a container terminal expanding from 40 acres to 160 acres—is poised perfectly to take advantage of any opening of Cuba, a country with which the city has had a long economic relationship.

The region’s ascendancy, however, faces significant impediments. Gilmer says that the greatest risk to growth comes from Washington, especially if a second-term Obama administration cracks down even more aggressively on offshore oil development. Federal regulators’ reluctance to let drilling resume in the wake of the BP oil spill ruined hundreds of New Orleans–area businesses. Potentially strict new controls on extracting gas by means of hydraulic fracturing could slow the energy boom further, which in turn would derail the expansion of petrochemical and other manufacturing facilities.

Perhaps more troubling are social problems, some the legacy of centuries of underdevelopment. Despite the influx of skilled and college-educated workers, Third Coast states continue to lag in college graduation rates and the percentage of their adult populations with college degrees. Of the 18 metropolitan areas across the Third Coast, only two—Tallahassee and Houston—have a higher percentage of college grads than the national average of 30 percent. When you rank states by their students’ proficiency in math and science, only one Third Coast state—Texas—sits near the middle of the list. Efforts to reform public education—notably, Louisiana’s new statewide voucher program and aggressive expansion of charter schools—offer some hope of addressing these weaknesses. In a new report, government efficiency expert David Osborne describes New Orleans’s reforms as a “breakthrough.” The results, he says, are “spectacular: test scores, graduation rates, college-going rates, and public approval have more than doubled in five years.” He adds, “I believe this is the single most important experiment in American education today.”

And the obstacles facing the Third Coast today aren’t so different from those that once confronted other American economic dynamos. In the nineteenth century, New York was seen as a hopelessly corrupt sewer. In the early twentieth century, Los Angeles was dismissed as superficial and equally corrupt, with only one industry: fantasy. Few would make those claims today.

It is much the same with the Third Coast. Weather, education, and, in some places, a legacy of corruption still present considerable challenges to its ascendancy. But if the region can surmount these challenges—and it appears to be succeeding at this—the Third Coast could become one of the major forces in twenty-first-century America.

Joel Kotkin is executive editor of NewGeography.com and is a distinguished presidential fellow in urban futures at Chapman University, and contributing editor to the City Journal in New York. He is author of The City: A Global History. His newest book is The Next Hundred Million: America in 2050, released in February, 2010.

This piece originally appeared at The City Journal.

New Orleans photo by Bigstock.

Joel Kotkin is a City Journal contributing editor and the Distinguished Presidential Fellow in Urban Futures at Chapman University.

Petraeus's Turf: The South Tampa Scene

$
0
0

Bimbo eruptions are never fortunate occurrences, least of all for the bimbos involved. When they occur in South Tampa, they carry the sordid spectacles to new frontiers. A gentle but feisty cultural mix of blue-collar, white-collar, and varied ethnicities stretches between Old Tampa Bay and Hillsborough Bay on a peninsula tipped with MacDill Air Force Base. Local reactions in Tampa to the news vortex that now surrounds General David Petraeus will likely range from shock, to "meh," to a certain pride in being in the spotlight, and to the addition of yet another notorious figure to Tampa's colorful history.

Tampa has always played in the shadow of New Orleans, with a good music and ethnic food scene, and a quirky local culture that isn't quite mainstream American and isn't quite Caribbean. A somewhat white bread version of New Orleans, Tampa has a local parade and festival that occurs the first week of February, but instead of Mardi Gras, Tampa's party honors the apocryphal José Gaspar, a pirate who reportedly operated out of Tampa Bay.

A spicy cultural mix to be sure, but it is meek and heavily regulated compared to the out-of-control scene in New Orleans. Perhaps the city's overbearing white leadership has something to do with this; no one wants to be responsible if things get really wacky. Gasparilla is a kind of Mardi Gras you can take your kids to, perhaps in deference to Florida's reputation as a family vacation destination.

Cuban cigars, once made in Tampa by the case, linked the city to male hedonism early in its history, and this link has been reinforced ever since. Once home to Cuba's freedom fighter, José Marti, Tampa's Cuban heritage has faded from its fierce past glory as well. By the 1980s, the Miami Cuban community's brash voice had taken over. "Yellow-rice Cuban" had become a putdown, implying one was from Tampa instead of Miami.

The city itself started as a Caribbean freight port in the 1880s. Teddy Roosevelt and his Rough Riders stopped for provisions in Tampa along their way. A young British war correspondent, Winston Churchill, rode with Roosevelt into nearby Ybor City to sample a local bordello, before sailing on to Cuba. The city's colorful past traditions includes military scandals that even date back to the straight-laced Victorian era.

South Tampa blossomed as a streetcar suburb in the early part of the 20th century, and when Plant's Hotel failed in the Great Depression, it was converted to a private college. The bay shore was sculpted into a 4-1/2 mile linear public park, still one of the most beautiful civic spaces in America. This boulevard reads like a spicy historical narrative of the city, with uniquely styled, Edwardian-era houses giving way to newer homes and condominium towers as one travels its length. Along this road, the magnates that helped build Tampa made their homes: Hugh Culverhouse, a tax lawyer who started the Tampa Bay Buccaneers, lived one condominium away from legendary George Steinbrenner Jr., who came to town to manage his shipping concerns when he wasn't hollering at the Yankees.

MacDill Air Force Base started as a training base for B-26 pilots during World War II. The bomber was so hot and difficult to handle that it was nicknamed the widow-maker, and its reputation gave MacDill its first catchphrase: "One a day in Tampa Bay." Conviviality between town and base became an instant tradition, along with the town's reputation for hosting a good time for all. And this reputation did not go away after the war.

In the meantime, the infill neighborhoods behind the affluent waterfront residences acquired a unique flavor. Not quite as tropical as Miami, the over-scaled flora -- huge banana trees, traveler's palms, figs – are interwoven with gorgeous craftsman-style bungalows with deep, shady porches and high windows to let hot air escape. Like Boston, the little neighborhoods and districts of South Tampa are distinct, colorful, 'hearty and vibrant. Along South Howard Avenue, a string of commercial and restaurant properties marks a definite dividing line between old and new.

Bern's Steakhouse dominates South Howard, where stars like Johnny Carson would stop and tuck into a prime rib when in Florida. Bern's is emblematic of Tampa itself: a proud, independent, homegrown restaurant, known for its excellent food, but ungracefully crammed underneath an interstate overpass and about as charming on the outside as a warehouse. Inside, the fifties era red velvet and gold leaf decor conjure up visions of a Parisian brothel.

Back behind Bern's lies Parkland Estates, a quiet, depression-era neighborhood where Santos Trafficante Jr. retired in the 1960s. Considered the last of the old-line mafia dons, with territory stretching far into Cuba, the Trafficante family lived in his modest, blond brick home. While Tampa may seem remote from the action, it actually was an active territory for syndicates that reportedly controlled road construction and other businesses. And Tampa was the location for scenes in Good Fellas, a source of pride to many Tampa natives.

By the time Trafficante died, however, Joe Redner had overtaken him in notoriety, operating a string of strip clubs and striking a highly visible profile in the city's business and political circles. Never quite accepted enough to win his many bids for mayor, yet still a persuasive leader, Redner's success may have had something to do with MacDills presence. Prurient behavior, tolerated but never quite accepted, gives Tampa a decidedly old-world flavor in the South's entrenched white Protestant mainstream culture.

MacDill still has a strong influence on South Tampa, employing some 3,000 people and actively participating in community projects. Its open house days, hugely popular, are a source of patriotic pride among locals, as are the jets flying overhead. Otherwise lacking a presence on the national scene, Tampa hosts the United States Central Command, with top military brass acting as local heroes. MacDill is immediately surrounded by base housing and service workers, but it's pressed up next to high-net-worth neighborhoods for those who prefer the quiet anonymity of South Tampa to flashy, overheated South Florida.

This week, as a warrior fell in Tampa, the event was fawned over by spotlight-hungry locals. The spectacle diminished not one, but multiple institutions, beginning with the FBI, the CIA, and the Army. What Taliban bullets could not do, our own culture did.

Richard Reep is an architect and artist who lives in Winter Park, Florida. His practice has centered around hospitality-driven mixed use, and he has contributed in various capacities to urban mixed-use projects, both nationally and internationally, for the last 25 years.

Flickr photo: by amanderson2: A very tame pirate ship in Gasparilla, 2010.


Review: Driving Detroit, The Quest for Respect in the Motor City

$
0
0

For more than a century, the city of Detroit has been an ideological and at times actual battleground for decidedly different views about the economy, labor and the role of government.  At one time it was the center of a can-do entrepreneurialism that helped launch the American automobile industry.  By 1914, for example, no fewer than 43 start-up companies were manufacturing automobiles in the city and surrounding region.  Following a wave of sit-down strikes that began almost immediately after FDR’s landslide victory in 1936, the economic character of the city changed dramatically.  Detroit soon became the quintessential union town, producing in the first decades after World War II the closest facsimile of Social Democracy that the United States has ever seen and in all likelihood will ever see again.    

Detroit also specialized in race riots.  In 1943, for example, a brawl that broke out at a popular getaway on a Sunday evening in June quickly escalated into mob attacks that resulted in the death of nine whites and 25 blacks.  Because the white police force could not or would not restrain the violence, the mayor asked the governor to call in federal troops.  Twenty four years and one month later in 1967, another Sunday riot broke out.  This time most of the violence occurred between black residents and the police and National Guard.  The death toll was similar, 10 whites and 33 blacks.  Property damage, on the other hand, was far more extensive.  Before the week was out, President Johnson appointed the Kerner Commission to make sense of the conflict and the growing unrest that was afflicting numerous cities all across America. 

The next major event in the history of Detroit occurred in 1973, when Coleman Young was elected as the city’s first African-American mayor.   He would go on to serve five terms.  While clearly a reflection of the changing demographics in Detroit, Young also personified the city’s long history of union activism, having first gained prominence in the early 1950’s as the leader of the National Negro Labor Council.  In the early 1980’s, in response to persistent economic decline, Young also led the fight to increase the city’s income tax, which included a tax on commuters.  This signaled an important shift in progressive politics in Detroit and elsewhere.  Rather than trying to wring additional revenue from private sector shareholders, labor and its political allies would now focus on the public sector as the preferred vehicle for income redistribution.

In Driving Detroit: The Quest for Respect in the Motor City, George Galster employs a multi-layered technique to bring the history of the city to life and help explain its current economic predicament.  The title, for example, invokes the R&B classic “Respect” released by Aretha Franklin in 1967.  Lyrics from other popular songs are also quoted, as well as a steady stream of poems by local Detroit poets.  In addition, Galster weaves the stories of select individuals and families into the broader narrative that he constructs.  At the very end, we learn that among the people we have gotten to know are his German-American parents and their forebears.   And finally, Galster, who is the Clarence Hilberry Professor of Urban Affairs at Wayne State University, tries to explain the development of the city and region through what he calls geology, but in urban economics would more commonly be called geography.  This may be the book’s most interesting contribution.

Galster emphasizes respect, which he defines as a combination of physical, social and psychological needs, because he argues that for many people in Detroit, for a long period of time, these needs were not adequately met.  This was true for blacks, who faced racial prejudice.  It was also true for factory workers, who historically had to endure dangerous working conditions, the monotony of the assembly line, and cyclical unemployment.  The labor movement helped soften the sharper edges of factory work, but Galster shows that it was far less successful at promoting racial harmony.  In part, this was a function of history.  The largest boom in Detroit occurred during World War II, when the city was dubbed the Arsenal of Democracy.  Because immigration had been stopped in the 1920’s, many of the new transplants came from the old South, often bearing well practiced well animosities.  Solidarity in this context was difficult to achieve.   

Along with the burden of history, another major challenge that Detroit faces today, surprisingly enough, is geography.  In traditional terms, Detroit was an excellent place to build a city, located on a river that has never flooded and soon reaches Lake Erie.  But in modern times, the local topography has proven something of a curse in disguise.  Galster calls this topography a “featureless plain.”   From the beginning, the city and region grew in a land extensive way.   Assembly line manufacturing contributed to lower land use density, because efficiency required large, one story buildings.   Typically, these factory buildings were interspersed among residential communities.  This arrangement made for an attractive and prosperous lifestyle, but with de-industrialization, Detroit has not been able to fall back on a vibrant “old city” that could attract new and creative businesses.

So what kind of future can Detroit expect?  Galster does not address this question directly, but clearly he appreciates the magnitude of the challenges at hand.  The phenomena that characterize the metropolitan region are not unique, he says, but “Greater Detroit is distinguished by the intense degrees of all these phenomena and their special origins.”  So perhaps the best take-away of Galster’s analysis is that the experience of Detroit should not be used to reach broad conclusions about the prospects of older industrial cities in general.  Rather, it should be used as a cautionary case study.  Detroit cannot alter its topography, but it can address problems like political chauvinism and sub-standard governance that Galster demonstrates have clearly had a negative impact on the business climate.  Progress here in combination with a low cost-of-living and the revolution in natural gas production might then make it possible to attract the investment that the economy needs to re-invent itself.   Certainly that would be the best case scenario.

Eamon Moynihan is Managing Director for Public Policy at EcoMax Holdings, a specialty finance company that focuses on the redevelopment of previously used properties. 

Faking It: The Happy Messaging of Placemaking

$
0
0

Picasso said “Art is a lie that tells the truth”. Nowadays, there’s less truth to that, as the creative process is increasingly about prettying up and papering over what’s broke.

More on that shortly, but first, about the breakage: it’s legitimate. Said Nobel laureate Joseph E. Stiglitz in a recent NY Times piece that plain-talks our economic conditions: “Increasing inequality means a weaker economy, which means increasing inequality, which means a weaker economy.”

That assessment—from a very smart man studying the problem—isn’t good. But in the American feel-good milieu you wouldn’t know it: “We’re coming out if it.” “Tomorrow is forever.” “Start-ups will save the U.S.” Etc. And while tone deaf, this kind of brushing off of problems isn’t new, but part of what social critic Barbara Ehrenreich refers to as America’s “cult of cheerfulness”, and it’s a “cult” that has spawned a longstanding and growing American feel-good industry.

Recently, researcher Jeff Faux—in his book The Servant Economy: Where America’s Elite is Sending the Middle Class—says the feel-good industry has disarmed social urgency and unrest with “cheerful denial”, particularly as it relates to declining standards of living. Faux writes:

[T]he positive-thinking industry has gone from publishing self-improvement books and training sales people to smile even when they don’t feel like it to loosely constructed system of social engineering that distracts and discourages Americans from dealing with what is happening to their society.

This form of social control is wide and far-reaching, ranging from the smiley face Wal-Mart logo to motivational seminars for laid off workers that spoon feed a “can do” attitude like it’s castor oil, regardless if it is the context that really “can’t.” Increasingly, cheerful denial has become the purview of artists and designers; that is, instead of using aesthetics to tear down—like did Picasso, Duchamp, and Matta-Clark—we use aesthetics to prop up.

Enter placemaking, or that medium of developing “place” in our cities through shared efforts of artists and designers alike.

Placemaking does a lot of good. Parks, festivals, and various urban design interventions can create for a myriad of positive attributes related to happiness, worth, and reinvestment. But placemaking in its pervasive search for vibrancy can often come off as Pollyannaish, or yet another means at happy messaging. At its worst, placemaking not only distracts from pressing concerns if only to provide a place to collectively clap, but—when done in exceedingly high rent spots continuously immune to economic downturns—can also serve to reinforce the bubble mentality of the elite.

One needs to go no further than America’s cultural capital, New York City, to see this operating. For instance, in a recent article called the “How Rust Became the New Urban Luxury Item”, the author talks about how the aesthetic of rust is being remade from a reality into a motif. The new billion-dollar Barclays Center was made rusty on purpose, and a new section of the High Line—the park made from an abandoned rail line—will most certainly retain its wear, with its decay polished if need be.


Courtesy of Techcat

Why is this occurring? The author writes:

[R]ust has become fashionable. It’s a sign of street cred, kind of like the pre-fab holes in a pair of $500 designer jeans…

…The kind of rust you find on the Barclays Center and in the refurbished High Line park is a luxury item. In places like Cleveland and Detroit and the parts of New York without corporate sponsorship, rust is still just rust.

There is a lot of truth there: rust is still just rust in places that have come to exist in post-industrialization, but for others: rust is luxury, rust is christened from the landscape of one’s hard times up to the decor of the powerful’s play areas.

On one hand, there is nothing new here. Beautification efforts to attend to social ills is a longstanding method of inflicting good feelings over hard realities. There was the City Beautiful Movement, the Urban Renewal Movement, etc. But what’s rarer is the fact that the aesthetics of disinvestment—in this case rust, and its “hard time” connotations—are being brought in to “dirty” the pretty up. In other words, by “street cred-ing” spaces for the elite, design is used to legitimize the extravagant via images of the honest-to-god consequences of the all-too every day.

The problem of course is that it elevates how things look and feel in places like the Rust Belt into a luxury status. But in reality, the Rust Belt has been anything but. And while rust is a genuine and pulsating aesthetic in post-industrial America, it is more so akin to the look of a scar: or a character-molding image of resilience that’s now part of the culture’s flesh, and as such can come off as lame when it’s fabricated to make the appearance of something look “harder” than what is.


Courtesy of Vagabondish

Of course this adopting of the Rust Belt aesthetic is but part of a cultural authenticity movement that has been going on for some time. People are tiring of the flighty, ephemeral, and the rootless. People want reminders of where America came from and the fight it has in it. But designing for authenticity, according to scholar Jeanne Liedtka, is not only foolhardy—“the authentic emerges; it is not summoned…”—but yet another indication that America is spending more energy on faking it then fixing it.

Richey Piiparinen is a writer and policy researcher based in Cleveland. He is co-editor of Rust Belt Chic: The Cleveland Anthology. This piece originally appeared at his blog.

Happy smiley photo by Bigstock.

What is a Half-Urban World?

$
0
0

Within the last couple of years, the population of the world has become more than one half urban for the first time in history. By 2025, the world's urban areas are expected to account for 58% of the world population, rising further to two-thirds in 2050. This represents a huge increase from the 29% that was urban in 1950, or estimates of approximately 10% (or less) in 1800. (Figure 1).

Urban areas have also gotten much bigger. In 1800, only Beijing had a population over 1,000,000. A number of others, such as Baghdad, Rome, Xi'an, Hanghzhou and Ayutthaya (Thailand) are reported to have reached between 1.0 and 1.5 million in the more distant past, but all had fallen back below the 1.0 million threshold by 1800 (Note 1). These population declines occurred for a variety of reasons, such as military losses, disease, as well as political and economic instability. In short, before the 19th century, large urban populations were largely unsustainable (Figure 2).

Over the intervening two centuries there has been an exponential increase in the number of large urban areas. By 1900, there were at least 15 urban areas over 1,000,000 population. By 2010, the figure had grown to approximately 450. New York had become the world's first megacity (over 10 million population) by 1950, now there are at least 25 over 10 million.

What is Urban?

However, it would be a mistake to imagine that "half urban" means a world of large cities, or that the world is highly urbanized. The principal source for urban population data is the United Nations, which relies upon individual countries to provide the urban versus rural data. These nations each have their own definitions, which can vary markedly.

For example, in the United States, a settlement must reach 2,500 population before it is considered urban. Thus, Van, Texas, with a population of 2,502 in the 2010 census is urban, like New York with its 18 million. Canada requires settlements to have 1,000 residents. This means that Nobleford, Alberta, with a population of 1,000 in the 2011 census is urban, along with Toronto with its 6 million population. It seems curious that, with their similarities, United States and Canada have such different urban definitions.

However, as the UN indicates, differing definitions make sense in some cases. For example, agricultural villages in China can be larger than small urban areas in the United States, Canada or Western Europe. However, given the common view that agricultural dependence is an important difference between rural and urban, a Western urban definition would be inappropriate in China.

The differences in urban definitions can be substantial. According to the UN, urban definitions can require a population of as much as 50,000, and as little as 200, as in Sweden. With thresholds so low as 200, 1,000 or 2,500 population, the world urbanization data includes not only "cities," but also smaller settlements like small towns and villages (though there is no standard definition to differentiate between cities, towns and villages and the definitional problem is made worse by the sometimes use of these terms for administrative boundaries).

It is generally recognized that the world's largest urban area is Tokyo, with a population of more than 35 million. However, there is no consensus about the smallest urban area in the world. Our candidate is Godegård, located in the Motala municipality (Östergötland County) in Sweden. The 2010 census indicated that Godegård had a population of 200 residents, at the urban definition threshold for Sweden.  Godegårdians live in an urban area of 0.10 square miles or 0.26 square kilometers (see Google Earth image above).

Distribution of the World Urban Population

Urban areas are becoming physically larger and that a larger share of the urbanization is moving to the larger urban areas (areas of continuous urban development, including both urban cores and surrounding areas, generally called suburbs). However, a majority of the world's urban population lives in smaller urban areas. In 2000, 30% of the world urban population lived in urban areas of less than 100,000 population (Note 2). Another 20% of the population lived in urban areas with between 100,000 and 500,000 population. Thus, nearly 55% of the world's urban population lived in small and medium-sized urban areas in 2000 (Figure 3).

Historical and Projected Distribution of World Urban Population

The United Nations data is available back to 1950 and includes projections to 2025, based upon the size of urban areas in each year in five-year increments. The data is specific to the population categories, so that as an urban area changes categories (generally moving to a higher category), its population is reflected in the higher category and subtracted from the lower category.

Despite all of the attention given to the world's megacities, only 10% of the world’s urban residents are in urban areas with more than 10 million population. However, both the number and share of people living in megacities has increased substantially. From 1950 to 2010, the share of world urban population living in megacities more than tripled, from 3% to 10%. By 2025, the United Nations projects that the megacities will have nearly 14% of the urban population.

Strong growth has also emerged among the urban areas with from 5,000,000 to 10,000,000 population. Their share of the population has more than doubled since 1950 and is expected to rise further by 2025.
The share of the population in urban areas with from 1,000,000 to 5,000,000 population has grown more slowly, but accounted for 20% of world urbanization in 2010 and is expected to rise to nearly 25% by 2025. These urban areas are projected to add more people than the world's megacities by 2025.

Urban areas from 500,000 to 1,000,000 population have increased their share even less, rising from 9% of the world urban population in 1950, to 10% in 2010 and a projected 11% by 2025.

Virtually all of the loss in urban population share has been in the urban areas with populations below 500,000. In 1950, these urban areas represented more than two thirds of the world urban population. This has since fallen to one-half and is expected to drop to 42% by 2025. (Figure 4)

Share of Growth

This does not mean the smaller urban areas are losing population. Between 1950 and 2010, these urban areas added more than 1.3 billion residents, and are expected to add nearly 150 million more between 2010 and 2025. However, urban population growth has been increasingly to the larger urban areas. Between 1950 and 2010, 47% of the urban population growth was in areas with less than 500,000 people. This dominance continued from 2000 and 2010, with a 38% share of the growth. However, it is expected that between 2010 and 2025 the greatest growth will be among urban areas with from 1,000,000 to 10,000,000 population (47%) and in the megacities (26%), while the smaller urban areas are expected to account for less than 13% of growth (Figure 5). Even so, the smaller urban areas will still have nearly three times as many residents as the megacities.

An Urbanizing, But Not Heavily Urbanized World

A half urban world is a world of settlements that includes villages, small towns, larger urban areas and megacities. Even as the population becomes more concentrated in the larger urban areas, smaller urban areas will continue to account for a large share of the world urban population for the foreseeable future. Thus, a half (or more) urban world will continue to include the likes of Godegård, Nobleford and Van as well as megacities that could approach 50 million.

Wendell Cox is a Visiting Professor, Conservatoire National des Arts et Metiers, Paris and the author of “War on the Dream: How Anti-Sprawl Policy Threatens the Quality of Life.”

----

Photo: Google Earth image of Godegård, Sweden, which may be the smallest urban area in the world (see text above).

Note 1: There is a considerable range of research on the size of the largest urban areas throughout history. The authoritative source is Tertius Chandler (Four Thousand Years of Urban Growth: An Historical Census).

Note 2: This estimate is developed from data in Angel, Parent, Civco, Blei and Potere (2010) and United Nations data. Angel, et al (also see A Planet of People: Angel's "Planet of Cities") provide estimates for urban areas from 100,000 to 500,000 population in 2000, which makes it possible to estimate the population of urban areas below 100,000 population, using UN data for 2000. Estimates for urban areas under 100,000 population is not available for other years.

Detroit: America's Whipping Boy Needs a Second Chance

$
0
0

Every so often, Detroit seems to pop up in our popular consciousness in a negative way.  Ever since the ’67 riots, a steady stream of bad press has altered the national perception of the Motor City.  Right now the city’s efforts to prevent state takeover because of its fiscal problems seems to shape discussion about Detroit.  The most recent demonstration of this is the State of Michigan’s proposal to make Detroit’s Belle Isle Park, the jewel of the city’s park system, into a state park through an extended lease agreement. 

But I’ve had a rather counterintuitive thought for some time – Detroit is our nation’s urban “boogeyman”, our poster child for urban decline, and we are the ones who prevent the city’s revitalization because we won’t let that image go.  America needs Detroit to be our national whipping boy. 

Whipping boys came into prevalence in 15th Century England.  I think Wikipedia’s entry on the subject captures it well:

They were created because of the idea of the divine right of kings, which stated that kings were appointed by God, and implied that no one but the king was worthy of punishing the king’s son. Since the king was rarely around to punish his son when necessary, tutors to the young prince found it extremely difficult to enforce rules or learning.

Whipping boys were generally of high status, and were educated with the prince from birth. Because the prince and whipping boy grew up together they usually formed a strong emotional bond, especially since the prince usually did not have playmates as other children would have had. The strong bond that developed between a prince and his whipping boy dramatically increased the effectiveness of using a whipping boy as a form of punishment for a prince. The idea of the whipping boys was that seeing a friend being whipped or beaten for something that he had done wrong would be likely to ensure that the prince would not make the same mistake again (emphasis added).

If that doesn’t accurately describe Detroit’s position in our nation’s collective conscience, I don’t know what does.

I grew up in Detroit.  Like so many others, I’ve long since moved away (been gone for 30 years), but I occasionally come back to visit family.  I left the city as a teen, but I remain an avid fan of the city’s sports teams.  I regularly read about events and happenings in the city via the Internet.  And, if given a chance, I could still navigate pretty easily throughout the city.  I heartily root for the city’s revitalization.

I sincerely believe that growing up in 1970s Detroit contributed to my ultimate career path.  As a kid, I remember news reports of people leaving the city for the suburbs or any number of Sun Belt cities – Houston, Dallas, Atlanta, Phoenix.  I remember reports of arson fires to abandoned buildings.  I remember Mayor Coleman Young taking such a defiant political stance on most issues that he may have urged (if not necessarily directly so) continued “white flight” and suburban expansion.  And, of course, I remember the tag that dug deep – “Murder Capital of the World”.  That kind of environment might prompt – did prompt – many people to just give up on cities in general and Detroit in particular, but I always had the vague notion that someone should stick around and try to make the city better.  I was first exposed to the field of urban planning during an eighth-grade career fair, and I later made it my career choice.

It was clear, however, that most people did not react to Detroit’s decline as I did.  The city’s decline allowed it to be pushed into the recesses of the American mindscape.  It was only to be recalled as a foreboding reminder of the evils of cities.

In my mind, four films from the last fifteen years seem to capture the general national image of Detroit and continue to shape our perceptions.  The 1997 film Gridlock’d features Tupac Shakur and Tim Roth as heroin addicts traversing a bleak urban environment, trying without success to get the help they need to drop the habit.  The much more celebrated 2002 Eminem film 8 Mile takes place in the same stark physical environment and details the visceral world of MC battling.  The 2005 film Four Brothers covers yet again the same desolate setting as four adopted young men seek to avenge the senseless murder of their mother.  And 2008’s Gran Torino, featuring Clint Eastwood, put a different spin on the meme by putting an elderly white widower into the same gritty landscape, full of resentment toward the people around him who represent the city’s demise. 

Of course, we don’t need films to tell us what to think about Detroit.  Journalists, business leaders, artists, and others are more than happy to report on a physical environment that is a gray and gritty, post-industrial collection of smokestacks, abandoned buildings.  Everyone knows that Detroit is a city with huge swaths of vacant land and substandard housing.   Time Magazine famously purchased a house in Detroit to provide a launching pad for reporters to chronicle the city’s collapse.  On more than one occasion I’ve heard people suggest that Detroit is undergoing a “slow-motion Hurricane Katrina”.  The image of the city’s people is one of, at best, ordinary blue-collar, hockey-loving, working-class slugs, holding on but facing inevitable economic obsolescence because of an inability to compete in today’s bottom-line global economy.  At worst, they are poorly educated and isolated miscreants who relish burning buildings every October 30th (“Devil’s Night”), and causing mayhem when one of the local sports teams actually wins a championship.

There are aspects of this in virtually every large city in America.  You can find Detroit in Cleveland, St. Louis, Buffalo, Milwaukee, Baltimore and Philadelphia.  You can find it in Indianapolis, Minneapolis, Cincinnati, Columbus and Louisville.  You can find it in Atlanta, Miami, Houston, Dallas and Phoenix.  You can find it in Las Vegas, Seattle, San Francisco and Portland.  And yes, you can definitely find it in New York, Chicago, Los Angeles and Washington, DC.  You can find elements of the Detroit Dystopia Meme ™ in every major city in the country.  Yet Detroit is the only one that owns it and shoulders the burden for all of them.

Why is Detroit our national whipping boy?

The image of Detroit serves as a constant reminder to cities of what not to become. This is the real Boogeyman syndrome right here.  City leaders around the nation can always refer to Detroit as the quintessential urban dystopia, invoking images of crime and crumbling infrastructure.  By doing this they can garner support for (or just as likely, against) a local project, because if this project does or doesn’t happen, you know what could happen to our fair city?  We could become like Detroit!

The image of Detroit allows the rest of the nation’s cities to avoid facing their own issues – urban and suburban. As long as Detroit’s negative image remains prominent in people’s minds, they can forget about trying to improve what may be just as bad, or even worse, in their own communities.  I remember visiting Las Vegas about twelve years ago, and was astounded by the amount of homelessness I saw, away from the Strip.  No one immediately associates homelessness with Las Vegas, but such an issue would be completely understandable for discussion to the average guy when talking about Detroit.  Cities like Miami and New Orleans have long histories of high crime rates, but that perception rarely registers like Detroit’s because they have other assets like South Beaches and French Quarters to mitigate it.  Cities like Memphis and Baltimore have a violent crime profile similar to Detroit’s, but they fail to excite in the way Detroit does.

The image of Detroit allows the rest of the nation to maintain a smug arrogance and sense of superiority. I imagine a nation pointing its collective finger at Detroit and saying its situation is the result of its own bad decisions.  Shame on Detroit, they say, for going all in on auto manufacturing.  Shame on Detroit for aligning itself so closely with labor unions.  Or the Big Three.  Shame on Detroit for not dealing with its racial matters.  Shame on Detroit for its political failures and corruption.  And I imagine this being said without the slightest bit of irony by the American people.  We are not you, they say, because we made better choices.  But the truth is dozens of cities made the same choices but escaped a similar impact, or had other physical or economic assets that could conceal the negatives.  This is a conceit that prevents not only Detroit’s revitalization, but that of former industrial cities around the nation.

Detroit needs a reprieve.  It needs a second chance.  Motown needs our nation to let go of its past and allow it to move on into the future.  There are millions of people who have had troubled lives in the past, but do we continually hold that against them?  There are corporations that betray the public trust, but we go back to buying their products.  There are Hollywood actors who make atrocious movies, but we go back to see their latest flick.  There are politicians who’ve been disgraced out of office, and even they are able to come back.  Detroit needs to be allowed to move into its next act.

More importantly, we must recognize that Detroit’s story is not unique.  It is the story of every American former industrial city, just writ large.  America is the land of second chances – we need to let go of our “at-least-we’re-not-Detroit” smugness and support this city.  Detroit has paid its dues, and it is long past time for the city to cash in.

By allowing Detroit to move on, we’ll find that it will free up other communities across the nation to actually focus on their own problems.  There’s a checklist of activities that require urban leadership.  Dealing with foreclosures.   Crushing income inequality and economic disparities.  Mind-numbing traffic congestion on our roads.  Crumbling infrastructure.  Unsustainable sprawl development.  The impact of global climate change on water availability in the Sun Belt.  That represents just the tip of the iceberg. Certainly, other cities certainly have their fair share of problems.

But I look at Detroit like this.  To paraphrase Frank Sinatra in his song “New York, New York” – if it can be fixed there, it can be fixed anywhere.

Pete Saunders is a Detroit native who has worked as a public and private sector urban planner in the Chicago area for more than twenty years.  He is also the author of "The Corner Side Yard," an urban planning blog that focuses on the redevelopment and revitalization of Rust Belt cities.

Photo: The "Detroit" we've all come to love -- and expect

Off the Rails: How the Party of Lincoln Became the Party of Plutocrats

$
0
0

For a century now, Republicans have confused being the party of plutocrats with being the party of prosperity. Thus Mitt Romney.

To win back the so-called 47 percent—an insulting description Romney doubled down after the election when he blamed his loss on Obama’s “gifts”—Republican might look farther back, past Calvin Coolidge and Herbert Hoover to their first president, Abraham Lincoln.

Not only did he spring from the ranks of the plebeian, not the preps, but—as Michael Lind points out in What Lincoln Believed—he aimed to both increase opportunity and expand national power. A corporate attorney, he backed railroad interests and their expansion, which paced the nation’s economic ascendancy, but saw this as part of creating greater opportunity, particularly in the West, for the country’s middle and working classes. He also enacted the Homestead Act, which supplied aspiring settlers with a gift: 160 acres of federal land.

Whether or not these acts were populist in their intent, their effects helped people achieve their aspirations. Expansion westward was nothing less than the basis of the American dream, allowing millions, many from land-poor and feudalized Europe, an opportunity to strike out on their own.

This aspirational element should be the centerpiece of the Republican message in this age of growing class bifurcation. The loss of upward mobility long predates President Obama, though it has accelerated under him—with median household incomes down by more than $4,000 since he took office. Even the tepid economy has not done much to improve middle-class fortunes since nearly three-fifths of new jobs are in lower-wage positions.

Without some unforeseen economic rebound, class issues will dominate our politics in the future even more than they do today. To recover, Republicans, now losing consistently (and often deservedly) on cultural issues, need to outmaneuver the Democrats on their ability to provide opportunity and upward mobility to a broad range of Americans.

In his time, Lincoln understood the usefulness of class warfare. Tied to industrial interests, he waged a bloody class war on the slave-owning gentry of the South, a group so detestable it makes today’s Wall Street elites seem almost saintly by comparison. Financiers and industrialists may have supported this brutal war between the states, but it was largely aspiring yeoman farmers, skilled workers, and small merchants—all beneficiaries of Lincoln’s expansive economic vision—who fought it.

In recent decades, Republicans—conscious of their patrician backers—have suppressed thinking about class, often criticizing Democrats for having no such scruples.

This made them unable to turn issues such as the bank bailouts to their favor; Romney, himself an economic royalist, could not bring himself to denounce the administration’s policies that have worked out wonderfully for large banks now enjoying record profits while pummeling the middle class.

In the past, Republican deflected class concerns by focusing on cultural issues, national defense, or ideology—but these tactics have worn themselves out. Of course, some conservatives will blame their defeat on a candidate of uncertain convictions and without commitment to the social regressive policies. Yet evangelicals mounted a record effort to get out the vote; it’s hard to see how Romney would have done better trying to sound more like Todd Akin and Richard Mourdock.

What should concern Republicans was declining turnout in traditionally GOP-leaning suburbs, the very places where middle-class professionals and business owners reside. These voters were not energized by Romney. So even though he improved the GOP’s 2008 vote among the middle class and independents, Romney’s total was about 1,000,000 below that of John McCain. Had Romney equaled McCain’s performance in four states (Florida, Ohio, Virginia, and Colorado), he would have won, rather than losing to a president who received 7 million fewer votes than in the previous election.

Let’s take a measurement of base stagnation: the nation’s population has grown 20 million since George Bush was elected in 2004, but the GOP vote has actually shrunk. This correlates as well with a stunning decline of roughly 8 million white voters compared to 2008. The white population may be getting old, but it’s not dying off that rapidly.

This low turnout is remarkable given how unfavorably Obama is viewed by much of the yeoman class. In fact, as Gallup notes, nearly 60 percent of small-business owners disapprove of Obama. The problem was many simply did not see Romney as a viable—let alone an attractive—alternative. In contrast, the Obama team did a far better job of turning out their base of minority, youth, single and childless women, and union members—an effort that delivered their margin of victory in swing states including Ohio, Nevada, and Colorado.

To change the political dynamic, Republicans need to address class concerns, particularly those of small property owners and aspirant small entrepreneurs. Yet the GOP has no program for this group other than lower taxes and hollow promises to cut the budget (which, of course, they have not done, even when holding both houses of Congress and the presidency). The party’s hodgepodge of corporate managerialism, social regressiveness, and, above all, protection of the plutocratic class is demonstrably not compelling to most Americans.

It’s hard for a Main Street business owner, or sole proprietor working from home, to relate to a plutocrat, like Romney, who pays lower effective tax rates than they do. Outrage against looming tax hikes would be justifiable, if the true motivation were not so plainly to preserve the privileges of the haute bourgeoisie. This is a politically doomed approach; while small business is widely revered by Americans, big business and banks are among the least well-regarded.

Class also would provide a means to define negatively the current regime. Instead of making silly attacks on President Obama as a “socialist,” he would be more accurately portrayed as the tribune of both the crony capitalists on Wall Street or Silicon Valley and of big labor, particularly public-employee unions. Obama should also be toxic to grassroots entrepreneurs, who will bear the brunt of the new regulatory regime, health-care system, higher energy prices, as well as rising income taxes.

Rather than label him as a radical, Republicans should identify him as an avatar of those who are doing best in our concussed economy, and presumably want things to stay that way. His most ardent backers include many of our richest, most celebrated citizens—fabulously wealthy Hollywood types, the Silicon Valley elite as well as those controlling our major media and universities. There’s a reason Obama bested Romney in eight of America’s 10 richest counties.

In Marin County, Calif.—where Obama claimed nearly 75 percent of the vote—expensive energy and higher housing prices represent not a burden but an environmental good, and, when it comes to housing, an economic opportunity for some to benefit from artificial, government-imposed scarcity. Ban new single-family homes, and the value of the existing stock goes up; for the elite investing class, incentives for “green energy” developments offer insider opportunities to enjoy windfall profits at the expense of middle-class-rate payers.

If Wall Street wants to join the “progressive” gentry parade again, as it did in 2008, Republican should encourage them. Being the candidate of the phenomenally unpopular financial overclass may have bought Romney the nomination, but it sealed his fate in the general election.

To reclaim its Lincolnesque transformation, the GOP needs to fundamentally pivot on the role of government. Laissez-faire ideology has its merits, but cannot compete successfully with a population weaned on the welfare state, whose members are keenly attuned to their vulnerability in our volatile era.

By admitting that government is sometimes a necessary partner in nurturing and sometimes financing infrastructure critical for economic expansion, Republicans can offer their own vision of what growth-inducing services such as new roads—as opposed to the increased regulation and transfer payments and pension bloat peddled by Democrats—government can and should provide. This could appeal to Hispanics, Asians, and younger people who would be the prime beneficiaries of tangible investments.

As generational chroniclers Morley Winograd and Mike Hais have suggested, most younger people support government action to solve problems but generally dislike the kind of top-down solutions often supported by Democrats. As these voters age, seek to buy homes and start businesses, they might listen to a sensible alternative that does not seek to enhance the left-wing clerisy’s ambition to control all aspects of their lives.

It’s time for Republicans to break with the traditions of Goldwater, Reagan, and, particularly, Bush and shift to something more akin to the party’s roots in the mid-19th century. This party needs less preaching and libertarian manifestos that essentially defend plutocracy. Instead it’s time to embrace class warfare on today’s gentry, and embrace the aspirations of today’s middle-class. Honest Abe in 2016?

Joel Kotkin is executive editor of NewGeography.com and is a distinguished presidential fellow in urban futures at Chapman University, and contributing editor to the City Journal in New York. He is author of The City: A Global History. His newest book is The Next Hundred Million: America in 2050, released in February, 2010.

This piece originally appeared at The Daily Beast.

Lincoln Memorial photo by Bigstock.

Viewing all 3789 articles
Browse latest View live


Latest Images