Quantcast
Channel: Newgeography.com - Economic, demographic, and political commentary about places
Viewing all 3793 articles
Browse latest View live

The Middle Kingdom and the U.S. Economy

$
0
0

In the poker match between President Donald Trump and China’s new all-but-emperor, Xi Jinping, it’s widely assumed that Xi holds the best hand. Yet President Xi’s hand may not be as awesome as it appears, while the United States, even under this very flawed president, may hold some fine cards.

Of course, Xi wields power in a way that Trump could only dream about. He has close to total control over the media, academia and the business community. In a way not seen in my over three decades of travel to China, Xi has fostered a cult of personality that looms over that vast country, and even has developed a strong cheering section among western business and intellectual leaders.

Trump, in contrast, faces an almost universally hostile press, an academy that detests him and an elite business community that largely fears his nationalist program. Having lost control of the House of Representatives, he is politically weakened and hardly seems a match for the Chinese leader.

The bizarre politics of class

Yet Xi’s position is not as strong as it seems. His country, which has enjoyed one of the greatest booms in human history, is clearly losing its economic momentum. Its once all-powerful industrial sector has begun to wobble and now Trump’s tariffs, coupled with competition from other countries, threatens the principal driver of China’s economic ascendency.

This decline could exacerbate what is a growing class chasm in the country. A large portion of China’s population remains very poor, and the prospects for moving up even for the educated middle class have diminished. China now suffers a surplus of college-educated people for whom the economy has little place, a potential threat to the Mandarin elite that runs the country.

More serious still is unrest among China’s lower classes, particularly the over 200 million migrant laborers who drove much of the country’s remarkable growth. There have been mounting protests from this constituency, some supported by new Marxist clubs on university campuses. Detestation for the crony regime — 90 percent of China’s millionaires, notes Australian political scientist David Goodman, are the offspring of high-ranking officials — is already widespread. This is forcing Xi to focus more on economic inequality when he might rather be conquering the planet.

Can the American economy live without China?

China’s profound economic problems weaken Xi against Trump. The country’s rising debt, much of it tied to real estate speculation, threatens the country’s fundamental health. If China tries to become more responsible on environmental issues — it is now a bigger emitter than the U.S. and the European Union combined — it could further weaken the country’s industrial competitiveness.

In contrast, despite all the hysteria from the establishment in both parties, Trump’s trade policies have not yet undermined the economy. Indeed U.S. employment, now at historically high levels, has been resurging, including in the industrial sector. Wages are increasing for manufacturing and other blue-collar workers, something that President Obama’s “progressive regime” never accomplished.

As in the run-up to the Second World War and in the winning of the Cold War, America remains a country of enormous sokojikara or “reserve power,” as Japan’s Fuji Kamiya pointed out decades ago. We seem deeply divided, poorly organized, but possess a far more fertile land mass, enormous technical and potential industrial capacity that have not yet been fully deployed.

The demographic dilemma — Democrats’ opening?

China’s greatest weakness lies in demographics. The “one child” policy helped produce an economically convenient confluence of fewer children and more working-age people. Now China’s workforce is already shrinking, and suffers a birthrate lower than Japan’s. China will lose 60 million people less than 15 years of age by 2050 and gain nearly 190 million people 65 and over.

The United States also suffers from aging demographics, but immigration has helped maintain some vitality largely. Trump, in his craven desire to appeal to his more nativist base, fails to recognize this factor. He is correct that the current chaos on the border is unacceptable, and the country clearly cannot allow in millions of largely unskilled people, which would threaten the still fragile gains of our own, highly diverse working class.

Yet anyone who visits a tech company, an industrial facility or a research lab knows the enormous overall value that many immigrants bring to this economy. It’s not just brainiacs but the skilled blue-collar workers that the country desperately needs. The immigrants may also be critical for taking care of our growing elderly population, building our houses and starting new businesses.

If they wish to take power, the Democrats need to integrate Trump’s economic nationalism with an immigration policy designed not as a version of global affirmative action but something that makes the country more competitive. They should not, in their fury about Trump, go back to becoming pawns of the investment banks, tech oligarchs and others who get rich exporting jobs across the Pacific. Leaders in both parties need to recognize that the moment to press the advantage with China is now.

This piece originally appeared on The Orange County Register.

Joel Kotkin is executive editor of NewGeography.com. He is the Roger Hobbs Distinguished Fellow in Urban Studies at Chapman University and executive director of the Houston-based Center for Opportunity Urbanism. His newest book is The Human City: Urbanism for the rest of us. He is also author of The New Class Conflict, The City: A Global History, and The Next Hundred Million: America in 2050. He lives in Orange County, CA.

Photo Credit: US Embassy Canberra [Public domain], via Wikimedia Commons


Will Canada Break Up Cver Carbon Dioxide?

$
0
0

Countries have broken up for very serious reasons like slavery, religious differences and ethnic tensions. But, so far, never in history has a country been at risk of breaking up because of a harmless gas – carbon-dioxide. Canada could, thanks to an ideologically-driven federal government.

Carbon Dioxide makes up a tiny portion (.04%) of our atmosphere and is essential to life – a trace gas that accelerates plant growth. The Trudeau government wrongly labels it “pollution” and believes it has to be sharply curtailed or future warming of the planet will result in catastrophe. To Trudeau, saving the planet means weaning Canada off the use of fossil fuel (which produces carbon dioxide when burnt). Despite Canada’s miniscule ‘contribution’ to world CO2 emissions, and other countries aggressively adding new coal plants, climate zealots are obsessed with strangling Canada’s oil and gas industry. However, it’s a vitally important industry, being the country’s largest export industry and essential to our continued economic prosperity.

During the last federal election campaign, and since, the ‘winning’ Liberals promised to reduce emissions to help address “global warming” while still supporting Alberta’s oil and gas industry. Neither promise has been kept. Pipeline projects have been stopped or slowed, meaning Alberta cannot get its oil to market. This is now strangling the lifeblood industry of Alberta’s economy which has lost over 100,000 oil and gas worker jobs in the last 3 years. It has damaged Canada’s overall trade picture, and knocked the loonie down to $.74 cents (vs. $.90 in an unsuppressed market). As for reducing emissions, it’s not happening despite coal plant closures, wind and solar power subsidies and other questionable actions.

Most sane Canadians recognize that the oil and gas industry is vital to the continued prosperity of the entire country. Most believe that the marketplace should be the place where these decisions are made, but others, ill-advised on economic realities, want the oil and gas industry to be “phased out”. The mix of views means that the federal government and oil and gas producing provinces are on a collision course. The country is headed for big trouble if the Liberals win the next election and continue with plans to phase out the oil and gas industry by stalling pipelines and thickening regulatory delays.

It is not inconceivable that oil and gas power Alberta will seek either outright independence or an arrangement with the United States. Even serious talk of such options by Alberta would rock Canada. Without Alberta, capital markets would dive, pension plans and the loonie would swoon.

Canada’s incredibly skewed equalization formula has Québec receiving 70% of the annual pot, with much of those massive yearly payments ultimately supported by the traditional economic bonanza from Alberta’s oil and gas industry. Those massive money transfers have, effectively, bribed Quebec to stay in Confederation and is part of the glue holding the country together. But, were Alberta to head for the door, the federal government would have to revise or scrap the equalization program – threatening Quebec. The breakup of the country would likely be the result.

And all of this because of Trudeau’s capture by the climate change industry and its obsession with reducing carbon dioxide, a harmless gas.

This piece originally appeared on Frontier Centre for Public Policy's website.

Brian Dale Giesbrecht received his education at United College and The University of Manitoba, where he obtained his LLB in 1972. He worked with Walsh, Micay and Co., and then joined Legal Aid Manitoba in 1975 to become Senior Attorney and the first Area Director for western Manitoba in Brandon.

Appointed to The Provincial Court (Family Division) in 1976, he heard child welfare cases and general family matters until he transfered to the Criminal Division in 1989. During his career he served on the National Family Court Committee, and various provincial court committees. He was an Associate Chief Judge from 1991 to 2005, and he became Acting Chief Judge in 1993. Among the notable cases he heard was the Lester Desjarlais Inquiry. His report strongly criticized the government’s decision to devolve child welfare responsibilities to racially based child-care agencies. Following his retirement from the Bench in 2007, Mr. Giesbrecht has written extensively for various publications. His main theme has been the need to abolish The Indian Act and the separate systems of government that exist in Canada.

The High Residential Densities of California (and “Wild Wild” Texas)

$
0
0

US major metropolitan areas show considerable differences in their median house sizes and median lot sizes among major US metropolitan areas. Reviewing the median square footage for owner occupied housing units (single-detached and manufactured/mobile homes) and median lot sizes for single unit houses varies significantly between metropolitan areas although, by contrast, median house sizes are remarkably similar.

The Census Bureau’s American Housing Survey (AHS), provides data on housing by metropolitan areas, with the latest posting on the American Fact Finder website covering metropolitan areas in 2011 and 2013 (Note 1). These surveys use “AHS areas,” which roughly conform to metropolitan areas or metropolitan divisions (in the few cases where metropolitan areas are divided for analytical purposes).

Lot Sizes

The largest existing lot sizes are about three times that of the national median lot size for one-unit lot of 0.26 acres. The largest median lot sizes for existing 1-unit houses are principally in the South and Northeast. Birmingham and Nashville share the top positions, with a median lot size of 0.75 acres. Hartford’s median lot size is 0.66 acres. Richmond, Atlanta, and Charlotte each have half-acre median lot sizes. This is to be expected, since each of these metropolitan areas has an urban density below 2,000 per square mile (Figure 1).

The smallest lot sizes are one-half smaller than the national median of 0.26 acres. The major California metropolitan areas have among the smallest median lot sizes for existing 1-unit houses. This is not surprising, since California has the densest urbanization in the nation, as well as the first, second and third most densely populated major urban areas (Los Angeles, San Francisco and San Jose, in that order and ahead of fourth place New York).

The San Francisco metropolitan area has the smallest median lot size, at 0.13 acres. The nearby San Jose metropolitan area has a 0.15 acre median lot size, as does Las Vegas. The Los Angeles median lot size is slightly above 0.15 acres. New Orleans, Phoenix, Miami, Houston, San Diego, Denver, Sacramento and New York also have median lot sizes below 0.20 acres. Houston’s small lot size (0.18 acres) is particularly surprising, given the general contempt of many planners who characterize it as excessively sprawling (Figure 2). In fact, Houston has smaller lot sizes than urban planning favorite Portland and has an urban density only a little less dense (Note 2).

House Sizes

The variation in lot sizes, at 5.8 times between the smallest and the largest lots, is considerably greater than the variation in house sizes (Figures 3 & 4). The largest median house size is 36 percent larger than the smallest among the major metropolitan areas. The largest houses are in Atlanta (2,300 square feet) and the smallest in Tampa-St. Petersburg (1,690 square feet).

Median Lot Sizes and Urban Densities

Reporters, planners, academics and others who cling to the notion that the highest urban area densities are in the East and Midwest are likely to be surprised by this data.

Of course, the population densities of America’s most unique urban core, New York, are far greater than anywhere else in the nation. But taken as a whole, the Los Angeles urban area is 30 percent denser and has much smaller lots than New York, despite being frequently cited in national and international literature as the ultimate in urban sprawl (Note 4). Other California urban areas, San Francisco, San Francisco and San Jose, each a prime example of post-War, automobile oriented suburbanization are denser than New York as well as Chicago, Philadelphia, Washington and Boston and have smaller median lot sizes. Riverside-San Bernardino, San Diego and Sacramento are all denser than Chicago, Philadelphia, Washington and Boston and also have smaller lots.

But it goes much further. Even the metropolitan areas of Texas have comparatively high residential densities, despite their reputation for urban sprawl. A seminal analysis by the Brookings Institution characterized Texas metropolitan areas as having “an unparalleled openness to growth and development.” Indeed, Brookings named the Texas land use category, “Wild Wild Texas,” noting that “Wild Wild Texas presents the closest thing the United States has to land use deregulation.” This reflects the most market oriented land use regulations in the United States, and as every planner seemingly from Adelaide to Berlin seems to have been taught, “Houston has no zoning.”

In fact, the four largest Texas metropolitan areas, Dallas-Fort Worth, Houston, San Antonio, and Austin each have median lot sizes of from 0.18 acres to 0.25 acres, small or smaller than Philadelphia, Boston or Washington. The market orientation of Texas land and residential development have not resulted in less efficient use of land.

All of this is a yet another reminder that the data does not always support pre-conceived perceptions.

Note 1: AHS areas corresponding to metropolitan divisions are combined to establish metropolitan area estimates, using weighted median calculations. There is AHS data is provided for 50 of the 53 major metropolitan areas (over 1,000,000 population). AHS does not provide data for Grand Rapids (MI), Raleigh (NC) or Salt Lake City (UT). All of the data for the 50 metropolitan area analysis is included in either the 2011 or 2013 surveys. Where data is provided for AHS areas comparable to metropolitan divisions, metropolitan data is estimated using weighted medians.

Note 2: Despite Portland’s aggressive urban containment policy, its urban density is approximately one-half that of Los Angeles. Further, Houston and Dallas-Fort Worth, often used as examples of the greatest sprawl rank in the middle, at 18th and 20th respectively in urban density out of the 41 urban areas with more than 1,000,000 population (Latest data, from the 2010 census). Houston is 16 percent less dense than Portland, while Dallas-Fort Worth is 18 percent less dense. Portland ranks 988th in urban density among the 1,064 urban areas with more than 500,000 residents in the 2018 edition of Demographia World Urban Areas.

Note 3: For three quarters of a century, much of the international urban planning community has been obsessed with stopping “urban sprawl.” Urban sprawl has become, in effect, the equivalent of a deadly sin in the Medieval church. Yet, urban sprawl has never been well defined. High density does not inoculate a city against criticisms of urban sprawl, such as the world’s densest large urban area (Dhaka, Bangladesh) shows. Perhaps the most significant attempt to classify American cities by their extent of sprawl (by Smart Growth America), found Springfield, Illinois to be less sprawling than Los Angeles. Yet, if Los Angeles had the same urban density as Springfield, it would cover four times as much land area. With such a lack of clarity, the charge of “urban sprawl” is often nothing more than “name calling.” (Adapted from “Poverty is Worse than Sprawl: California’s Housing Affordability Crisis”).

Wendell Cox is principal of Demographia, an international public policy and demographics firm. He is a Senior Fellow of the Center for Opportunity Urbanism (US), Senior Fellow for Housing Affordability and Municipal Policy for the Frontier Centre for Public Policy (Canada), and a member of the Board of Advisors of the Center for Demographics and Policy at Chapman University (California). He is co-author of the "Demographia International Housing Affordability Survey" and author of "Demographia World Urban Areas" and "War on the Dream: How Anti-Sprawl Policy Threatens the Quality of Life." He was appointed to three terms on the Los Angeles County Transportation Commission, where he served with the leading city and county leadership as the only non-elected member. He served as a visiting professor at the Conservatoire National des Arts et Metiers, a national university in Paris.

Photograph: Houston’s higher residential densities (by author)

The Labor Market Is Changing: Is Your Company Ready?

$
0
0

Ever since the economy began to bounce back, with unemployment at an all-time low, the familiar refrain from pundits has been that growth, particularly of the higher wage variety, would head to the tech-oriented elite cities along the coasts. Yet, today, despite the headlines about Amazon’s expansions in New York and Washington, D.C., the real story is the aggressive growth taking place on a changing stage, both in terms of geography and changing labor demands.

While tech is still among the fastest-growing job categories, up 29 percent since 2010, that’s not where the biggest shortfalls are now. Instead, jobs in food preparation, personal service, production and construction have the highest job-opening rates. In skilled blue-collar fields, there’s also the issue of a substantially older workforce—average age 45—than the general level.

An exclusive analysis of job trends for Chief Executive finds serious changes in the locale of economic growth. Although the Silicon Valley, and, to a lesser extent, its urban annex of San Francisco, continues to create higher-wage jobs, the momentum there has shifted primarily to lower-cost, less-heavily-regulated economies. Similarly, some of the “super-star cities,” such as New York, Los Angeles, Chicago and Boston, are seeing only modest job growth, often at or below the national average.

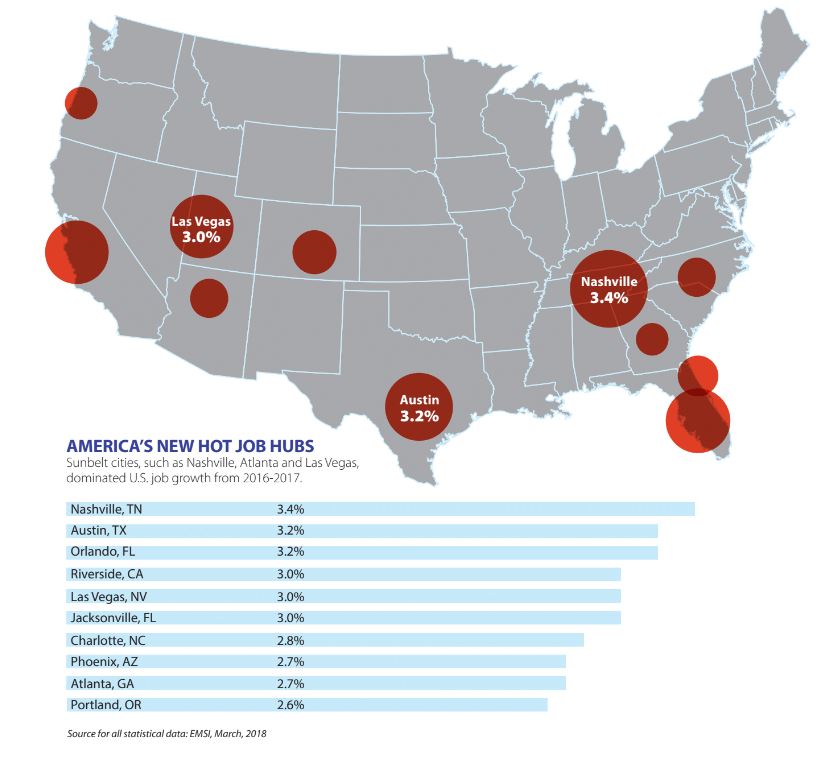
This can be seen most clearly by comparing job growth over the past seven years to growth over the last year. Metropolitan job growth from 2010 to 2017 looks like a hip, high-tech central casting. Top five metros include Austin, San Jose-Sunnyvale and San Francisco. Last year’s numbers, however, show a distinct trend towards Sun Belt cities, which accounted for all eight top-growing economies, including Nashville, Las Vegas, Jacksonville, Atlanta, Phoenix and Riverside-San Bernardino, an exurb east of Los Angeles.


The Leaking of High Tech

The Bay Area metro area job picture remains robust, growing well above the national average, yet no longer outperforming all comers in tech growth. San Jose-Sunnyvale ranked second, with 25 percent growth since 2010, but last year notched a respectable, but not overwhelming 15th, with San Francisco right behind at 16th. This reflects an ongoing shift of work in technology and business services to other markets.

We looked at the growth in computer and math-related jobs. Since 2010, the field, which includes 4.6 million workers, has been led by the Bay Area, which took two of the three fastest expansions of this critical sector. Last year, the San Jose area still ranked No. 2, but San Francisco, third since 2010, fell below 25 and slightly below the national average. The big gainers were first place Orlando, which added 7.3 percent to its employment in this field. Other rising Sun Belt upstarts include Las Vegas and Atlanta. Perhaps more surprising, places like Cleveland and Kansas City are growing up to twice the national average in this critical field and far more than self-described “tech hubs” Washington, Los Angeles, Boston and San Diego, all of which are producing new tech jobs at or below the national average.

Much of the geographic widening of tech work is made possible by the growth of high-tech business services, which tends to be more integrated with the economy and works often with non-high-tech sectors. The professional, scientific and technical services sector employs 1.7 million (36 percent) of computer and math workers, compared to just under 600,000 employed by the more celebrated software and Internet industries. More importantly, business services sectors generated 2.5 times more jobs for computer and mathematics workers than IT sector businesses since 2010.

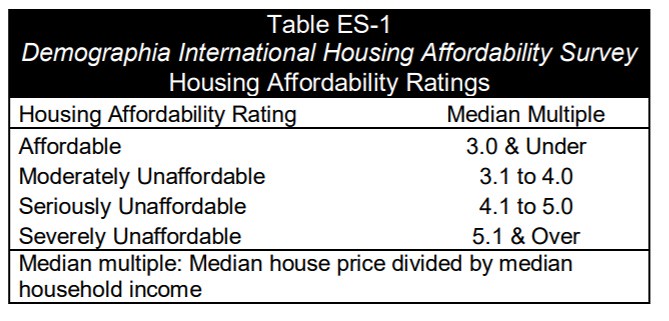
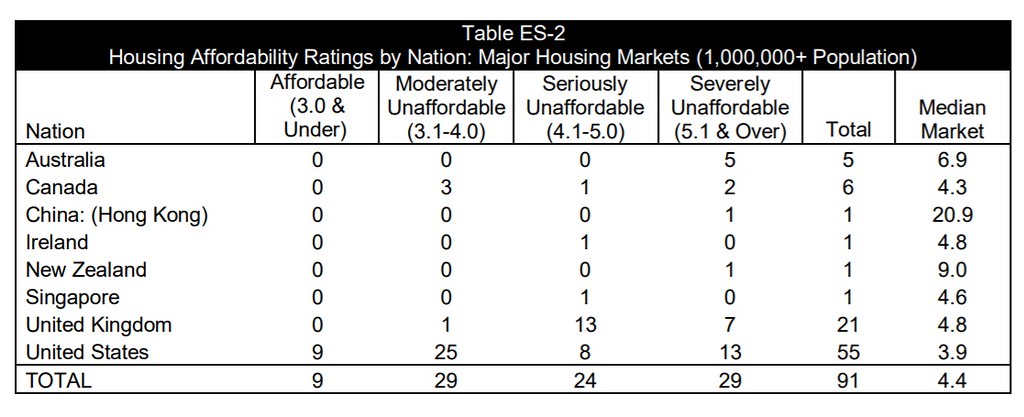
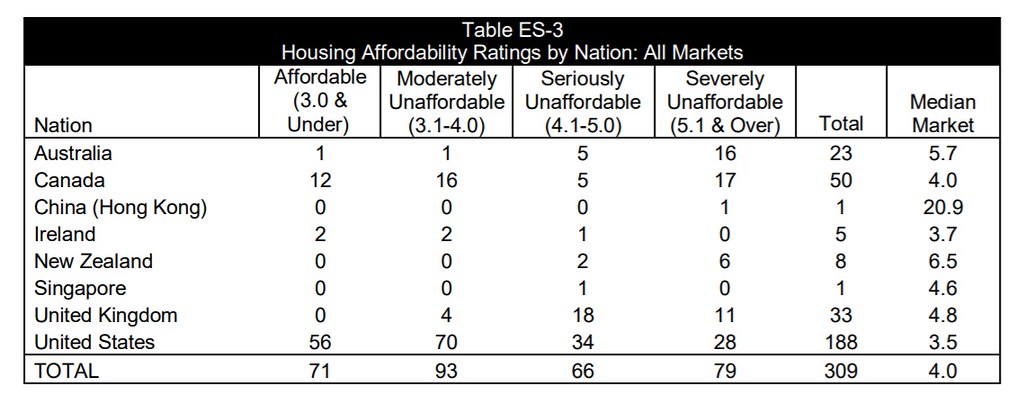
The big issue behind this change may be costs, notably housing, as is widely admitted by tech industry leaders. Once wages are normalized, Bay Area workers’ relative salary plummets. Overall, the average salary in San Jose turns out to be less, in real terms, than places like Minneapolis, Washington D.C., Raleigh, Kansas City or Austin. Migration patterns from the Bay Area have changed radically over the past five years, with more people leaving than coming. Nearly half of millennials and more than half of all current residents say they are considering a move out.

The Business of Business Services

Employing more than 10 million workers, the biggest sector of high-wage jobs—paying $87,000 on average—comes from the business services sector. The dynamics here differ from what is traditionally considered high-tech in that this is a field that may not be as amenable to the urban phenomena of single, young people sharing small, overpriced apartments. Along with its 1.7 million IT workers, the professional and technical services sector employs more than 900,000 in management occupations.

We took a deep dive into management occupations—including top executives and managers of all types of employees—to get a sense of where these higher-wage jobs (paying $43 an hour, $4 above computer and math-related jobs) are heading. The picture shows considerable change. Taking the pulse since 2010 shows San Francisco and San Jose ranking first and third, respectively, in growth. But if we look at 2016-2017, the picture changes, with again the momentum weakening, particularly in San Francisco, which dropped from first in growth to a still-respectable 12th.

Who’s gaining? For the most part, it’s smaller, less-costly Sun Belt locations. Nashville and Las Vegas topped our list, but Phoenix, Atlanta, Salt Lake City and Jacksonville all made the top 10. Tech region standbys like Portland and Seattle are also increasingly outperforming other elite economies such as New York, Los Angeles and Boston by a wide margin.

These patterns are, if anything, more pronounced when we turn to financial management and general business operations services, as opposed to top management. Here it’s Orlando in fourth place since 2010, in first last year, with other Sun Belt cities, including Jacksonville, Raleigh, Las Vegas, Austin and Charlotte, in the top 10. Although it placed second, Silicon Valley retained an impressive five percent growth. San Francisco fell from fifth to 22nd, while most other superstars are actually falling below the national average.

The Blue-Collar Boom

Whether due, at least partially, to President Trump’s policies, blue-collar America faces its most enviable situation in years. Wages are rising for lower-income workers for the first time in decades. Manufacturing employment, which flattened in the last year of President Obama’s term, has picked up, adding 1.2 million jobs since 2010 and 400,000 since November 2016, enjoying its best growth since the mid-1990s. Even retail, a big employer of blue-collar workers, has expanded. Critically, incomes are up for the lower deciles of the labor force, including youth.

One sign of a blue-collar resurgence: the most serious labor shortages tend to be in fields that suffered heavily in the recession, such as personal service, transportation, production and construction. We zeroed in on production workers like welders, machinists, fabricators and plant managers. This part of the economy has been traditionally concentrated in the “Rust Belt” along the Great Lakes but is now spreading to other parts of the country. Grand Rapids, the leader in this category since 2010, still held a respectable 11th place. Detroit, the epicenter of industrial America, did better, securing a strong sixth-place finish, adding 2.3 percent to its already large manufacturing work force.

The biggest growth, however, is now largely in the Sun Belt, as evidenced by the presence of No. 1-ranked Nashville, which added 3.9 percent to its industrial workforce last year. Other Sun Belt cities in the top 10 include Las Vegas, Jacksonville, Orlando and San Antonio, all emerging industrial powers. In contrast, many Northeast and West Coast areas saw a loss of jobs for production workers in the last year, including Seattle, Chicago, Los Angeles, San Diego, Philadelphia, New York and Boston.

Rust Belt cities may benefit from these trends. Although many places are declining, some are seeing millennial migration, as well as the greatest growth in seniors. Since 2010, notes demographer Wendell Cox, Indianapolis, Des Moines, Kansas City and Columbus have all enjoyed higher rates of millennial population growth than New York, Chicago, Boston, San Jose, San Francisco or Los Angeles.

What the Future Portends

Given uncertainty around interest rates, the stock market, high-tech regulation and trade policy, it is not easy to predict the exact shape of the future. But the data seems to indicate a shift in the basic economic structure. Places like Silicon Valley, Seattle and Portland will continue to dominate in the high tech and some business service fields, but their growth rates appear to be slowing while new players emerge in both the less costly Sun Belt and a select Midwestern markets like Columbus, Kansas City and Cleveland.

At the same time, there are big increases in fields that pay wages that will allow a middle-class lifestyle in a less expensive areas but would leave a family near poverty levels in New York, Los Angeles or the Bay Area. After adjusting for cost-of-living using the C2ER index, places like Minneapolis, Kansas City, Detroit, Columbus, Raleigh and Cleveland move into the top 10 for median wage.

Ultimately, this pattern is being reflected in migration out of California and the Northeast towards the Sun Belt and a few Midwestern cities. These are also the areas that are showing the slowest decline in fertility, an issue that impacts both family migration and, in the long-term, the future of the job market.

The talent challenge may be shifting from luring workers from elite colleges toward developing local resources that emphasize the kind of specialized technical training needed locally. In many places, these programs—both in the high schools and community colleges—were scrapped in favor of a concentration on four-year degrees. But some areas are now taking steps to correct these deficiencies by linking local high schools and technical colleges using a career academy model. Close to 30 percent of all computer-oriented jobs, what could be called “new-collar” jobs, do not require a four-year degree, notes a recent Brookings study.


For companies, this may mean rethinking the best places to profitably access human capital. Impossibly expensive regions, such as the Bay Area, may remain magnets only for the highest-end professionals, or those with family money, but not for those who earn more modest wages. Some of the slowest labor force growth, notes economist Jed Kolko, is precisely in markets that on the surface might be most attractive to workers. In some sense, elite markets like Boulder, Silicon Valley, Boston and Boston now have the same problem some Rust Belt markets have had for years—even when there are jobs, it’s increasingly hard to attract people to the area to do them.

In contrast, lower cost areas like Greeley, Colorado, Provo, Boise, Austin, Orlando and Fayetteville, says Kolko, still have tight labor markets, but are still growing their labor forces. Yet, there’s also an important message for millennials and future generations: a college degree may not be as valuable as you have been told. The returns for college degrees have been in decline for at least a decade.

Perhaps the biggest opportunity, or challenge, may be in meeting growing needs for personal care, much of it to care for our rapidly aging population. This sector grew by 33 percent since 2010 and 5 percent in 2016-2017. Many workers in the field would benefit from basic training in healthcare and gerontology, as opposed to a four-year or master’s degree. The rapid movement of seniors to lower cost, mainly Sun Belt regions and smaller cities, including in the Intermountain West, could help create a natural market for such work.

Overall the new trends provide an enormous opportunity for many areas of the country that can both accommodate blue-collar and high-paid sectors, including big cities like Houston and Dallas, which are projected to lead the nation in new “mid-skilled jobs,” as well as many smaller communities. Their big challenge may lie in training workers in fields with the largest number of openings, such as construction and manufacturing.

This means there needs to be a strong emphasis on bringing young people into many tactile fields that pundits have claimed are “gone forever” but have now come back with a vengeance. In fact, despite all the information age banter, significant opportunities lie in the “middle-skill” jobs. In the last year, nearly 250,000 new jobs were created in the construction and extraction and installation and maintenance job categories, paying roughly $20 per hour. Another 600,000 new business operations specialists, managers and healthcare practitioners joined the economy at pay rates above $30 per hour.

Critically, regions also know that new arrivals are not likely to solve their shortages; the current rate of job-related moves is roughly half to one-third what it was as recently as the 1990s. This provides an excellent opportunity for regions that did not shine earlier in the decade but are making a marked comeback now. For scores of towns and cities, the looming labor shortage represents a golden opportunity—if they can take advantage of it.

This piece originally appeared on Chief Executive.

Joel Kotkin is executive editor of NewGeography.com. He is the Roger Hobbs Distinguished Fellow in Urban Studies at Chapman University and executive director of the Houston-based Center for Opportunity Urbanism. His newest book is The Human City: Urbanism for the rest of us. He is also author of The New Class Conflict, The City: A Global History, and The Next Hundred Million: America in 2050. He lives in Orange County, CA.

Mark Schill is a community and corporate strategy consultant with Praxis Strategy Group and Managing Editor of New Geography.

Photo Credit: Thomas Hawk, via Flickr, using CC License of Nashville.

Lyfting Herself Up From Her Bootstraps

$
0
0

I occasionally find myself in an Uber or Lyft. I like to hear about the lives of the people who do the driving. They’re overwhelmingly from the distant suburbs and drive in to the city to collect fares. An hour away is the most typical distance. I ask why they don’t just drive near where they live. The numbers don’t add up. Not enough volume. The distances are too far and the empty round trips burn up miles with no income. And the price they get for each trip is geographically sensitive based on supply and demand. A driver can pick up and drop off fares continuously all day and all night in the city at a higher rate than a few scattered fares in the suburbs with a lower rate. Commuting in to town is wildly more profitable.

A neighbor was in the hospital with some health issues a while back so I hopped a Lyft Line to visit him and his wife. Faster than biking uphill. Easier than parking in the city. Sooooooo much better than waiting for a bus that may or may not appear. $8. A bit pricey, but it’s a once-in-a-while thing. What’s not to love? I walked back home downhill on a sunny Saturday. My Lyft driver Andy was busy chatting with a young Asian woman in the front seat. I was in back with a Latina. All heading to different destinations near each other.

The Asian also Lyfts and Ubers on the side. She was comparing notes with Andy. Worst trip? A drug deal going down in the vehicle. A guy and two women. Andy was uncomfortable with the sale of federally regulated substances (evidently the hard stuff) in his car, but he kept his eyes on the road and pretended not to notice. Then one of the women insisted on some product in exchange for services rendered. The dealer wasn’t interested. Cash money only. Things escalated and he got physical with her. That’s when Andy pulled the car over and told everyone to get out. He couldn’t tolerate a guy hitting a woman in his presence. He doesn’t take fares in that particular town anymore.

In Denver I chatted with a 30-ish woman driver about her situation. She left West Virginia looking for work. She rents an apartment in Colorado Springs an hour away since rents are half what they are in Denver. This arrangement is what economists call geospatial arbitrage. Her commute in and out of the city is paid for with airport fares from suburbia. She earns 90% of her income from Lyft and Uber. She said she’s saving up to buy a house back in Appalachia. She had a pleasant hippy vibe. She just got her certificate for therapeutic massage and a table at a work share space in a trendy neighborhood. She talked about how she liked Colorado because people ask if she enjoys her work and what she’s striving to achieve in her personal growth. No one back home in West Virginia ever asks about happiness. They focus more specifically on bread and butter and keeping warm and dry. But it’s home and West Virginia is beautiful and the kind of place where you can buy a house on the cheap and be close to your people. She’ll never buy a home in Denver. Never.

This piece originally appeared on Granola Shotgun.

John Sanphillippo lives in San Francisco and blogs about urbanism, adaptation, and resilience at granolashotgun.com. He's a member of the Congress for New Urbanism, films videos for faircompanies.com, and is a regular contributor to Strongtowns.org. He earns his living by buying, renovating, and renting undervalued properties in places that have good long term prospects. He is a graduate of Rutgers University.

15th Annual Demographia International Housing Affordability Survey: 2019

$
0
0

The 15th Annual Demographia International Housing Affordability Survey covers 309 metropolitan housing markets (metropolitan areas) in eight countries (Australia, Canada, China [Hong Kong Only], Ireland, New Zealand, Singapore, the United Kingdom and the United States) for the third quarter of 2018. A total of 91 major metropolitan markets (housing markets) --- with 1,000,000+ population --- are included, including three megacities, with more than 10,000,000 residents (New York, London and Los Angeles).

Middle-Income Housing Affordability

The Demographia International Housing Affordability Survey rates middle-income housing affordability using the “Median Multiple,” which is the median house price divided by the median household income. The Median Multiple is widely used for evaluating housing markets. It has been recommended by the World Bank and the United Nations and has been used by the Joint Center for Housing Studies at Harvard University. The Median Multiple and other price-to-income multiples (housing affordability multiples) are used to compare housing affordability between markets by the Organization for Economic Cooperation and Development, the International Monetary Fund, The Economist, and other organizations.

Historically, liberally regulated markets have exhibited median house prices that are three times or less that of median household incomes (a Median Multiple of 3.0 or less). Demographia uses the housing affordability ratings in Table ES-1.

Housing Affordability in 2018

Over the past year, there has been moderation of house prices in some of the most unaffordable markets. In some markets, prices have stabilized, while in others actual declines have occurred. However, none of the price declines have been sufficient to materially improve housing affordability. These developments could, in the long run, simply be further indication of the price volatility exhibited associated with stronger land use regulation.

There are 9 affordable major housing markets, all in the United States. There are 29 severely unaffordable major housing markets, including all in Australia (5), New Zealand (1) and China (1). Thirteen of the major markets in the United States are severely unaffordable (out of 55), seven in the United Kingdom (out of 21 major markets) and two out of Canada’s six.

The most affordable major housing markets are in the United States, with a moderately unaffordable Median Multiple of 3.9, followed by Canada (4.3) and Singapore (4.6). Ireland and the United Kingdom both have Median Multiples of 4.8. The major markets of Australia (6.9), New Zealand (9.0) and China (20.9) are severely unaffordable (Table ES-2).

There are 9 affordable major housing markets, all in the United States. Pittsburgh and Rochester are the most affordable, with a Median Multiple of 2.6. Oklahoma City has a Median Multiple of 2.7, while Buffalo, Cincinnati, Cleveland and St. Louis each has a 2.8 Median Multiple. Indianapolis (2.9) and Detroit (3.0) are also affordable.

There are 26 severely unaffordable major housing markets in 2018. Again, Hong Kong is the least affordable, with a Median Multiple of 20.9 up from 19.4 last year. Vancouver has replaced Sydney as the second least affordable, with a Median Multiple of 12.6. With slightly declining house prices, Sydney’s Median Multiple dropped to 11.7. Melbourne (9.7), San Jose (9.4), Los Angeles (9.2) and Auckland (9.0) were also among the least affordable. San Francisco (8.8), Honolulu (8.6), as well as London (Greater London Authority) and Toronto (both 8.3) were also among the 10 least affordable major markets. Schedule 1 includes Median Multiples for all major markets.

Table ES-3 summarizes housing affordability in all markets.

Well-Functioning Cities

There has been significant progress in the reduction of poverty around the world, first in the high income world and now in other nations. Paradoxically, threats are emerging in some urban areas of the high-income world, as middle-income households face intensifying economic challenges.. Much of the cause can be traced to much higher house prices.

Former World Bank principal urban planner Alain Bertaud’s new book (see Introduction: Avoiding Dubious Urban Policies) expresses concern that urban policy in cities is being driven by planning that ignores fundamental economics. This, he warns, can lead to a “costly utopia.” According to Bertaud, “The objective of the book is not to propose new urban forms but to apply already consensual basic economic principles to the practice of urban planning.”

In the environment of current urban policy, principally urban containment policy, middle-income housing has become too expensive for many middle-income households and poverty has increased. Significant national economic losses have been associated with more restrictive land use regulation.

Economists Paul C. Cheshire, Max Nathan and Henry G. Overman of the London School of Economics state the obvious priority: “… the ultimate objective of urban policy is to improve outcomes for people.” Economists Edward Glaeser of Harvard University and Joseph Gyourko of the University of Pennsylvania, have that “well functioning” housing markets are crucial to housing affordability. Housing affordability requires well functioning land markets.

Bertaud adds: “The main objective of the planner should be to maintain mobility and housing affordability” This would produce substantial opportunities, permitting residents the widest access to employment and shopping and other pursuits--- in short, well functioning cities (labor markets).

15th Annual Demographia International Housing Affordability Survey

Wendell Cox is principal of Demographia, an international public policy and demographics firm. He is a Senior Fellow of the Center for Opportunity Urbanism (US), Senior Fellow for Housing Affordability and Municipal Policy for the Frontier Centre for Public Policy (Canada), and a member of the Board of Advisors of the Center for Demographics and Policy at Chapman University (California). He is co-author of the "Demographia International Housing Affordability Survey" and author of "Demographia World Urban Areas" and "War on the Dream: How Anti-Sprawl Policy Threatens the Quality of Life." He was appointed to three terms on the Los Angeles County Transportation Commission, where he served with the leading city and county leadership as the only non-elected member. He served as a visiting professor at the Conservatoire National des Arts et Metiers, a national university in Paris.

Photograph: Pittsburgh - Tied for Most Affordable Market with Rochester (by author)

Pittsburgh & Rochester: Best 2018 International Housing Affordability

$
0
0

Pittsburgh and Rochester have the best housing affordability among 91 major markets (metropolitan areas with more than 1,000,000 population) in eight nations. Both have a median house price that is 2.6 times the median household income, a measure called the Median Multiple. This is the conclusion of the 15th Annual Demographia International Housing Affordability Survey, which rates housing markets based on estimates from the 3rd quarter of 2018.

Other Affordable Major Markets

Seven other major markets in the Survey are rated as affordable (Figure 1), with Median Multiples of 3.0 or less. They include Oklahoma City (2.7), Buffalo, Cincinnati, OH-IN-KY, Cleveland, and St. Louis, MO-IL, at 2.8, Indianapolis at 2.9, and Detroit at 3.0 (Figure 2).

Severely Unaffordable Major Markets

While households in affordable markets can buy middle-income houses for the equivalent of three years or less of gross median income, households in some other markets need from 10 years to over 20 years income to pay for their houses (Hong Kong, Vancouver, and Sydney).

For the ninth year in a row, the Demographia International Housing Affordability Survey shows Hong Kong to be the least affordable major housing market. Hong Kong's Median Multiple is 20.9, up from 19.4 last year. This is the highest Median Multiple in the Survey’s 15-year history.

The Major Markets

In addition to the very large markets noted above, the least affordable 10 includes Vancouver, which at 12.6 the third second least affordable major market, retaking that position from Sydney, after four years. Melbourne had a Median Multiple of 9.7, followed by San Jose (9.4), Los Angeles (9.2) and Auckland (9.0). The balance of the least affordable 10 included San Francisco (8.8), Honolulu (8.6) along with London (Greater London Authority) and Toronto, both at 8.3.

There are 29 severely unaffordable markets, which are shown in Figure 4. These include all major markets in Australia (5) and New Zealand (1). Two of Canada's six major metropolitan areas and six of the United Kingdom's 21 major markets, including London and the London Exurbs. There are 13 severely unaffordable markets is in the United States. This represents, however, less than one-quarter of its 54 rated markets.

All 309 Markets

Among the 309 markets of all sizes in the Survey, 79 are severely unaffordable, with 28 in the United States (out of 188), 16 in Australia (out of 23), 17 in Canada (out of 50), 11 in the United Kingdom (out of 33) and six in New Zealand (out of eight). There are no severely unaffordable markets in Ireland or Singapore.

There are also 62 affordable markets (Median Multiple of 3.0 and less --- 49 in the United States, 11 in Canada, two in Ireland and one in Australia. There are no severely unaffordable markets in Ireland or Singapore. Canada’s Cape Breton, NS is the most affordable of the 309 markets, with a Median Multiple of 2.1.

Introduction (“Avoiding Dubious Urban Policies”) by Alain Bertaud

This year’s Introduction (“Avoiding Dubious Urban Policies”) is by Alain Bertaud, of New York University (NYU) and former principal urban planner at The World Bank. Bertaud has just published a much anticipated book (Order without Design: How Markets Shape Cities) expressing concern that urban planning is ignoring fundamental economics, which can lead to a “costly utopia.”

In the book, he blames “the lack of interaction” between urban planning and urban economics” for the “serious dysfunction in the development of cities,” and calls for incorporation of economics into urban policy. Berthoud elevates the issue of housing affordability to its genuine significance, suggesting that: The main objective of the planner should be to maintain mobility and housing affordability. Obviously, mobility is important because of the need for people to reach work in metropolitan areas (see: “Employment Access in US Metropolitan Areas”). Housing affordability drives the cost of living. Nearly all the cost difference between high cost metropolitan areas and the national average is the difference in housing costs (Figure 5).

In the Introduction, Bertaud discusses notes the necessity of providing more housing “rapidly enough to accommodate the new demand without creating real estate price inflation.” Virtually all the severely unaffordable markets have failed in this task. Bertaud says that the necessary “expansion is blocked by inadequate land management policies and arbitrary land use regulations, and by an absence of mechanisms to finance infrastructure and transport to respond to demand for new greenfield land development.” However, public officials are often “are not effective in allowing the supply of floor space and land to increase rapidly because many of them firmly believe in three myths:”

Myth #1: planners know how to allocate land equitably through the design of increasingly complex zoning regulations while ignoring price signals.

Myth #2: Regulators can mandate the creations of new affordable housing units by obliging private developers to provide a share (usually 20%) of the housing units they build at prices fixed by the government below market; regulators call these “affordable housing units.”

Myth #3: The compact city fallacy. A city can accommodate increasing income and population through densification of the existing built-up area; expansion into greenfield would result in “sprawl.”

The mindsets resulting from these myths have dire consequences. Middle-income households are increasingly unable to afford middle-income housing, because their prices have been driven up by excessive regulation. More households are added to the queue for subsidized housing, as they can no longer afford the market rate housing that has increased so much in price. With this demand, induced by excessive regulation, its governments typically have long waiting lists for subsidized housing. It is not surprising that homelessness is increasing in this environment. When people must pay more for housing relative to their incomes, they have less for other goods and services. This explains how California, home to some of the world’s greatest wealth, is also home to the highest poverty rate among the 50 states when housing costs are considered.

But reform is challenging. Bertaud summarizes the solution, “…urban regulatory reform” should be approached “…in the same way as a doctor develops a treatment for a drug addict: a progressive withdrawal planned over the long term. The main lesson to be drawn is not to become addicted to dubious urban regulations in the first place. I wish planning professional associations, and academic institutions would contribute to dispelling the three myths described above that are causing so many urban dysfunctions.”

Finally, in “Avoiding Dubious Urban Policies,” Berthoud characterizes the Demographia Survey message to be that unaffordable housing is not an unavoidable fatality linked to economic success. We have not said it better before.

15th Annual Demographia International Housing Affordability Survey

Wendell Cox is principal of Demographia, an international public policy and demographics firm. He is a Senior Fellow of the Center for Opportunity Urbanism (US), Senior Fellow for Housing Affordability and Municipal Policy for the Frontier Centre for Public Policy (Canada), and a member of the Board of Advisors of the Center for Demographics and Policy at Chapman University (California). He is co-author of the "Demographia International Housing Affordability Survey" and author of "Demographia World Urban Areas" and "War on the Dream: How Anti-Sprawl Policy Threatens the Quality of Life." He was appointed to three terms on the Los Angeles County Transportation Commission, where he served with the leading city and county leadership as the only non-elected member. He served as a visiting professor at the Conservatoire National des Arts et Metiers, a national university in Paris.

Photograph: Pittsburgh & Rochester - Best 2018 International Housing Affordability

The Tech Economy’s Untold Story

$
0
0

The decisions by Amazon and Google to expand into the New York area have led some pundits to claim that the nation’s high-tech economic future will be shaped in dense urban areas. “Big cities won Amazon and everything else,” proclaimed Neil Irwin of the New York Times. “We’re living in a world where a small number of superstar companies choose to locate in a handful of superstar cities where they have the best chance of recruiting superstar employees.” Yet the trends in job creation, particularly in technology, are not nearly as favorable to the “superstars” as some urbanists imagine. If one looks at data, not press releases, a more nuanced picture emerges, with much of the fastest growth—including in tech—shifting dramatically not to the elite, dense urban centers but to more sprawling regions and the suburban periphery.

As Ali Modarres, Director of Urban Studies at the University of Washington at Tacoma suggests, not all tech jobs are created equal. “Second wave” tech firms like Amazon tend to be short-term employers, where young workers earn their spurs before heading elsewhere. Of course, Amazon also has its warehouses, mostly in the exurbs, where workers labor in often Dickensian conditions, while Apple builds virtually everything in grim Chinese factories plagued by on-the-job suicides. Such practices contrast with those of more traditional tech firms—those involved with semiconductors, computers, network equipment, and aerospace—which rely on long-term employees. These firms, Modarres suggests, thus have different priorities when it comes to siting and corporate planning.

Read the entire piece at City Journal.

Joel Kotkin is executive editor of NewGeography.com. He is the Roger Hobbs Distinguished Fellow in Urban Studies at Chapman University and executive director of the Houston-based Center for Opportunity Urbanism. His newest book is The Human City: Urbanism for the rest of us. He is also author of The New Class ConflictThe City: A Global History, and The Next Hundred Million: America in 2050. He lives in Orange County, CA.

Photo Credit: Leonard J. DeFrancisci [CC BY-SA 3.0 or GFDL]


Getting METRONext 2040 from B- to a real A+

$
0
0

METRO recently released a draft $7.5 billion 2040 transit plan they’ve labeled “A Plus” (the previous “A” plan plus some additions), but unfortunately it’s more like a B- when it comes to addressing Houston’s real transportation needs over the next two decades.  It has some wonderful, cost-effective local and express bus improvements – including bus-rapid transit (BRT) at less than one-third the cost per mile of light rail – but continues to throw mountains of good money after bad on wasteful new light rail extensions.

The A+ plan proposes to add 20 miles of new light rail for $2.45 billion, or a third of the overall plan cost, to serve only a tiny 18,900 trips per day at a pricey $130,000 per daily rider – about the same as buying each rider a Porsche Cayenne Turbo SUV. The two redundant light rail routes to Hobby airport will serve a trivial 7,200 boardings per day at a projected cost per rider of a quarter-million dollars (like a Ferrari for each rider!), totaling $1.8 billion or around $129 million per mile, which is probably low since the Green and Purple lines cost $154 million per mile when completed in 2015.  Why is the ridership estimate so low? It might have something to do with the fact that the 13mph light rail is so slow it will take almost an hour to get from Hobby to Downtown!  Why couldn’t that be replaced with far cheaper and faster express lane BRT service like Bush Intercontinental airport is getting?

Unfortunately we're already all too familiar with low ridership on light rail. The $1.4 billion Green and Purple lines have dismally low patronage, with only 5,077 weekday boardings on the Green Line and 7,416 weekday boardings on the Purple Line. For comparison, the Main St. Red Line has 53,412 weekday boardings, and the Katy Freeway near Beltway 8 served 366,000 vehicles carrying a half-million people per day in 2017.

Beyond the wasteful cost-inefficiency, rail is also at significant risk of technological obsolescence as autonomous vehicles and shared-ride services like Uber, Lyft, and Google’s Waymo continue to evolve.  The impact of new technology on public transit is unknown but could be hugely disruptive, potentially substantially reducing demand for traditional public transit. That’s why we need a plan which is adaptable to whatever the future may bring. For future planning purposes and METRONext, it really does not matter if autonomous vehicles become available in 5 years or decades in the future. Anything built in the MetroNext plan can be expected to be in service to the year 2100 and beyond. METRONext needs to be ready for autonomous transit, if and when it comes, but also maximize mobility benefits of transit investments if autonomous transit is slow to develop or has a minimal impact.  Practically, that means concrete guideways with rubber-tired vehicles that can evolve as the technology does.

Bus rapid transit guideways substantially reduces the risk of obsolescence, since concrete can accommodate the potential autonomous transit vehicles of the future. But we also need to be cautious with BRT: yes, it is much less expensive than light rail, but $42 million/mile is still not cheap, and it’s no bargain if it causes traffic chaos at intersections.  METRO needs to complete the Uptown BRT, optimize it, and study its impact and effectiveness before building more of it, especially the Universities line along Richmond that will cross many congested intersections like Kirby, Shepherd, Montrose, and multiple key thoroughfares in Midtown.  In some cases, Signature Bus service may be good enough, less disruptive, and far less expensive. Existing bus service on Gessner receives 6,879 boardings per day, about half of the daily volume on Westheimer (slated for Signature service) and less than the daily volume on Bellaire, Beechnut, and Richmond (all slated for enhanced BOOST service). Why spend $793 million on Gessner BRT when much less expensive Signature Bus or BOOST service is likely to be sufficient?

How should METRO redeploy that $2.45 billion light rail budget instead? They should focus on three priorities:

Faster commutes: METRONext makes substantial regional express improvements to the HOV lane network, including two-way service and service between job centers, but it is still too downtown-centric and fails to provide regional service from all areas to all major job centers. The Texas Medical Center, Greenway, Uptown, Westchase, and the Energy Corridor all get express service from only limited parts of town, some requiring time-consuming transfers.  H-GAC predicts jobs will continue to disperse with less than 17% of the region’s jobs inside the 610 Loop by 2045. METRO, in partnership with TXDoT and HCTRA, needs to serve more of the other 83% with interconnected express lanes stitching together the entire region (including connecting around downtown).  We don’t need more high capacity transit, but instead need more routes that can be operated affordably to more destinations with low rider counts at high service levels.  The major economic risk is that more employers will give up on being in Houston’s congested core and move to the outer suburbs like Exxon did, draining our tax base and vitality.

Equity: LINK Houston recently released a report estimating almost a million Houstonians need better basic bus service.  The METRONext plan calls for 241 miles of BOOST network bus service with higher frequencies, better reliability, and sheltered stops for the bargain cost of only $53 million ($220k/mile).  Why not dramatically expand that to more of the city?

Increased ridership and reduced congestion: To buck the national trend of shrinking transit ridership, METRO needs to go big and eliminate fares entirely.  Metro’s revenue is mostly sales tax, with less than 9% coming from the farebox. $1.3 billion of that $2.45 billion saved from light rail could provide free fares for the next 20 years, and it would actually cost less than that because of the internal cost savings from no longer having to collect, process, and enforce fares.  That also makes boarding and trips faster.  Free fares and faster trips means more riders and less traffic congestion – a win whether you ride transit or not.  As a bonus, the boost to Houston’s national reputation would be substantial as well.  Additionally, METRO could use the savings to improve the rider experience with more shelters and better sidewalks, making Houston more pedestrian-friendly in the process.

METRO is planning a multi-billion-dollar bond referendum in 2019.  If we learned one thing after the 2003 referendum, it’s that METRO will doggedly stick with voter-approved plans even in the light of changing circumstances and shifting cost-benefit ratios.  Whatever gets passed in 2019 is likely to shape Houston transportation for better or worse for decades to come amid rapid technological change, with a high risk of obsolescence and white elephants.  It’s a plan we really need to get right. I encourage every Houstonian to get involved through the METRONext website and public meetings to help make it a truly A+ plan.

This piece originally appeared on Houston Strategies.

Tory Gattis is a Founding Senior Fellow with the Center for Opportunity Urbanism and writes the Houston Strategies blog.

Photo: BrianReading [GFDL or CC BY-SA 3.0], from Wikimedia Commons

Low-Density Fire Buffer

$
0
0

Someone in Bend must be reading this blog, or at least thinking along the same lines. In 2017, after the Wine Country fires had burned homes in Santa Rose, the Antiplanner noted that the problem was the homes were too dense and needed a buffer of low-density homes around them. I made the same point after the Camp Fire burned homes in Paradise.

Now Deschutes County is zoning a buffer between Bend and the national forest for low-density housing. The zone calls for one home every 2.5 acres, which is probably not dense enough — one home every acre would be sufficient and would make it more likely that homeowners would treat their entire properties to minimize fire risk.

The land that Deschutes County is zoning as a fire buffer is outside of Bend’s urban-growth boundary. Under Oregon land-use planning rules, lands outside of but adjacent to the boundary may be zoned “rural residential” with 5- to 10-acre minimum lot sizes. It is likely that the county is going for 2.5-acre lot sizes because it fears it couldn’t get away with one-acre lot sizes.

In addition to the large lot sizes, the new zoning will require homeowners and subdivisions to have “dedicated open space” and “wildfire prevention mitigation plans.” As the Antiplanner noted a decade ago, homes built to “shelter-in-place standards” can survive the worst wildfires. In fact, they are so safe that residents are encouraged to stay in their homes rather than evacuate. This is the type of development Deschutes County should encourage between the national forest and the city.

While many free-marketeers object to zoning of any kind, this is one situation where zoning creates huge positive externalities. If low-density development of a buffer area can protect more conventional Bend neighborhoods from suffering the fate of those in Santa Rosa, the benefits may outweigh the costs. In this particular case, the county is upzoning from the ultra-low-density zoning that preceded it, so the rural landowners benefit as well.

Ironically, after fires failed to harm homes in southern California shelter-in-place neighborhoods, a representative of the California Department of Forestry and Fire Protection criticized developers for building such homes because they encouraged people to live in fire-prone areas. But, as the fires in Santa Rosa, Paradise, Malibu, and elsewhere demonstrated, most of California is fire-prone; the solution is to build low-density fire-proof neighborhoods and use them as a buffer around denser cities.

This piece first appeared on The Antiplanner.

Randal O’Toole (rot@ti.org) is a senior fellow with the Cato Institute and author of the new book, Romance of the Rails: Why the Passenger Trains We Love Are Not the Transportation We Need, which was released by the Cato Institute on October 10.

Photo credit: The National Guard [Public domain], via Wikimedia Commons

Today’s Cultural Engineers

$
0
0

Soviet dictator Joseph Stalin once labeled writers and other creative people “engineers of the soul.” In his passion to control what people saw and read, Stalin both coddled artists and enforced unanimity through the instruments of a police state. Today, fortunately, we don’t face such overt forms of cultural control, but the trends in American and to some extent European mass culture are beginning to look almost Stalinesque in their uniformity. This becomes painfully obvious during awards season, when the tastes and political exigencies of the entertainment industry frequently overpower any sense of popular preferences, or even artistic merit.

Our cultural climate has become depressingly monochromatic. Award ceremonies, once a largely nonpolitical experience, have become reflecting pools for preening progressive artistes. Those emceeing the awards must be as politically pure as possible—sorry, Kevin Hart—and those winning acclaim get the best press if, besides thanking their producers and agents, they take a shot at Donald Trump.

This dynamic is not exactly the byproduct of popular demand. In recent years, ratings for the Oscars have fallen to the lowest levels since the awards were televised, down from over 40 million to fewer than 30 million. The ratings decline tracks the fall in movie attendance, which has sunk to a 25-year low. We’re a long way from a time when awards nights were dominated by popular mainstream winners such as West Side Story, The Sound of Music, or even the original Lord of the Rings. The movie industry makes money now by producing sequels of movies based on comic books, with relentless action and violence but little character development.

As movies and television shows in both the United States and Britain today increasingly adopt the feminist, gay, and racial obsessions of their makers, they have written off a large portion of the less politically “woke” audience. Many of these shows, such as Britain’s venerable Doctor Who, have hemorrhaged viewers since taking on a more preachy, PC aspect. “It’s supposed to be entertainment,” one disgruntled viewer complained. Late-night television, now dominated by stridently anti-Trump comedians, also has seen ratings drop in recent years; no show has close to the number of viewers, let alone the iconic status, enjoyed by the late—and largely apolitical—Johnny Carson.

Read the entire piece at City Journal.

Joel Kotkin is executive editor of NewGeography.com. He is the Roger Hobbs Distinguished Fellow in Urban Studies at Chapman University and executive director of the Houston-based Center for Opportunity Urbanism. His newest book is The Human City: Urbanism for the rest of us. He is also author of The New Class ConflictThe City: A Global History, and The Next Hundred Million: America in 2050. He lives in Orange County, CA.

Photo: jdeeringdavis [CC BY 2.0], via Wikimedia Commons

The Bifurcated City

$
0
0

After drifting toward decrepitude since the 1970s, many core cities have experienced real, often bracing, turnarounds. Yet concern is growing that the revitalization of parts of these cities has unevenly benefited some residents at the expense of others. The crucial, and often ignored, question remains whether the policies that have helped spark urban revivals have improved conditions for the greatest number of residents. In a new study for the Center for Opportunity Urbanism, we found that, in most cities, unbalanced urban growth has exacerbated class divisions, while doing little to address the decline of middle-class households. Our analysis, which puts special focus on the urban cores of Chicago, Los Angeles, and Dallas, shows that the once-rapid growth of urban cores and their surrounding neighborhoods has slowed dramatically; net domestic outmigration, according to Census estimates, has increased from 10,000 in 2012 to 440,000 in 2017. At the same time, some of the most actively gentrifying areas, such as San Francisco, Portland, and Seattle, have become increasingly plagued with social dissolution and rising homelessness.

In recent years, a relatively small downtown population has done better, but surrounding areas have not. Philadelphia’s central core rebounded between 2000 and 2014, but for every district that gained in income, two suffered income declines. Research by urban analysts Joe Cortright and Dillon Mahmoudi shows that the number of high-poverty (more than 30 percent below the poverty line) neighborhoods in the U.S. has tripled in the last half-century, from 1,100 in 1970 to 3,100 in 2010.

Poverty is not, as is widely suggested, now primarily a suburban problem. The poverty rate, according to the American Community Survey, remains two-thirds higher in urban cores than in suburbs. Equally important, many longstanding middle- and working-class neighborhoods are disappearing. Teachers, firemen, and police officers are struggling to afford homes in many American cities, according to a study from Trulia. This pricing-out also applies to many skilled blue-collar professions like technicians, construction workers, and mechanics.

Read the entire piece at City Journal.

Joel Kotkin is executive editor of NewGeography.com. He is the Roger Hobbs Distinguished Fellow in Urban Studies at Chapman University and executive director of the Houston-based Center for Opportunity Urbanism. His newest book is The Human City: Urbanism for the rest of us. He is also author of The New Class Conflict, The City: A Global History, and The Next Hundred Million: America in 2050. He lives in Orange County, CA.

Wendell Cox is principal of Demographia, an international public policy and demographics firm. He is a Senior Fellow of the Center for Opportunity Urbanism (US), Senior Fellow for Housing Affordability and Municipal Policy for the Frontier Centre for Public Policy (Canada), and a member of the Board of Advisors of the Center for Demographics and Policy at Chapman University (California). He is co-author of the "Demographia International Housing Affordability Survey" and author of "Demographia World Urban Areas" and "War on the Dream: How Anti-Sprawl Policy Threatens the Quality of Life." He was appointed to three terms on the Los Angeles County Transportation Commission, where he served with the leading city and county leadership as the only non-elected member. He served as a visiting professor at the Conservatoire National des Arts et Metiers, a national university in Paris.

Photo: Eric Allix Rogers, via Flickr, using CC License.

Gentrification Is Failing in Los Angeles

$
0
0

If Los Angeles Mayor Eric Garcetti runs for president, he will no doubt point to the high-rises that have transformed downtown L.A. into something of a hipster haven. He could also point to fevered dense development, both planned and already in process, spreading across the Los Angeles basin, particularly near transit stops, as well as an increasingly notable art scene.

Yet for all the changes in the city, have things improved for most Angelenos? Sadly, the answer is no. For all the speculative capital pouring into the city from China and elsewhere, the L.A. area suffers the highest levels of crowding, the greatest levels of poverty, the least affordable housing, the lowest homeownership rates and the second-largest concentration of homeless in the nation.

In many ways this reflects national trends, where, despite gentrification efforts, the number of poor districts in cities has continued to rise. And there are signs, in the most recent census numbers, that the “back to the city” trend has slowed considerably, including among millennials.

Gentrification is a function of real estate speculation

Compared to other more traditional cities, such as New York or Chicago, multi-polar L.A.’s gentrification reflects less organic development than massive real estate speculation, supported by public dollars and policy. In a new report on gentrification nationwide co-authored with Karla Lopez del Rio and Chapman University researcher Kenneth Murphy, released by the Center for Opportunity Urbanism, barely 1 percent of the city of Los Angeles has gentrified, mostly around downtown.

L.A. gentrification has been driven by changes in zoning, public infrastructure including the rail system, laws promoting density and support for facilities such as the Convention Center as well as Staples Center. The city has lured large developers in some key areas, including Hollywood. The L.A. area ranked as the No. 1 choice in North America in a survey of global commercial real estate investors, who had a combined total of $1.7 trillion to spend on property in 2017.

Yet this investment has not created the kind of job growth we see in Chicago’s Loop, Manhattan or San Francisco. There may be more life and housing in downtown, but downtown’s share of total employment so far has not grown since 2010.

Good for a few, not for many

Neither downtown revitalization nor policies to boost density have made the city richer. New sports stadia have created many lower-wage jobs, but overall L.A. has lost jobs that pay more than $75,000 annually over the past decade. It may have enriched some luxury high-rise developers, but gentrification has not improved life for most. From 2000-12, median rents increased by 25 percent in L.A. County while income declined 9 percent.

It’s dubious there’s anything like a sustainable demand for expensive residences in downtown. Some landlords of luxury apartments offer free parking and periods of free rent. Savvy Chinese real estate website Mingtiandi is warning investors that DTLA is heading for “an imminent glut of luxury condos, amid a wave of up to 30,000 new residential units to hit the city’s market over the next three years.”

Other city-sanctioned high-density developments have had unintended results. Efforts to densify areas around transit stops have boosted prices and rents, but have replaced mostly poor transit riders, who are now compelled to purchase cars, with affluent residents who already drive, notes a recent University of California study.

The politics of gentrification

Perhaps the most controversial impact of gentrification lies with rising rents. This has sparked a grassroots rebellion in the Crenshaw district, Chinatown, south Los Angeles, and, most especially, east Los Angeles. In 2015, a real estate firm littered downtown L.A.’s Arts District with a “Why Rent Downtown When You Could Own in Boyle Heights?” flyer. Realtors promoted a bike tour through the “charming, historic, walkable and bikeable neighborhood.” After the realtor received messages such as “Stay outta my hood” and “I hope your 60-minute bike ride is a total disaster,” the event was canceled.

There is widespread concern about changes in local zoning ordinances, notes Koreatown attorney Grace Yoo, all for developers who built housing out of reach for local residents. Nor is this policy helping to keep L.A.’s beleaguered middle class. Nearly one in five LA census tracts have seen drops in home ownership since 2010, and the city continues to suffer mounting rates of out-migration. Nice restaurants, entertainment and sports venues may be considered cool, and win the plaudits of urban taste-makers, but can’t substitute for affordable housing, higher-wage jobs and better schools, the proven ways of making life better for residents.

If Garcetti wants to make a case for L.A.’s future, not to mention his, he needs to refocus urban policy away from real estate speculation and gentrification to one that serves the need of most middle- and working-class Angelenos. Ultimately the health of a city is not how many restaurants or high-rise towers are built, or how generously developers fill the coffers of accommodating politicians, but how the city serves as an incubator of social mobility.

This piece originally appeared on The Orange County Register.

Joel Kotkin is executive editor of NewGeography.com. He is the Roger Hobbs Distinguished Fellow in Urban Studies at Chapman University and executive director of the Houston-based Center for Opportunity Urbanism. His newest book is The Human City: Urbanism for the rest of us. He is also author of The New Class Conflict, The City: A Global History, and The Next Hundred Million: America in 2050. He lives in Orange County, CA.

Marshall Toplansky is Clinical Assistant Professor of Management Science at Chapman University. He is co-principal investigator, with Joel Kotkin on “The Orange County Model”, a demographic and econometric research project to identify growth strategies for that region. He is formerly Managing Director of KPMG’s national center of excellence in data and analytics, and is co-founder of Wise Window, a pioneer in sentiment analysis and the use of big data for predictive models. He lives in Orange, California.

Photo: Camiloarenivar [CC BY-SA 4.0], from Wikimedia Commons

Chicago: A Tale of Two Very Different Cities

$
0
0

A new report by the Center for Opportunity Urbanism, Beyond Gentrification: Towards More Equitable Growth, explores how unbalanced urban growth has exacerbated class divisions, particularly in the urban centers of our largest's metropolitan areas. To read or download the full report click here.

First up, Pete Saunders takes a deeper look into Chicago in his essay, "Chicago: A Tale of Two Very Different Cities," which begins on page 18 of the report. Read an excerpt of his piece below.

On its surface, the city of Chicago exhibits many of the characteristics associated with gentrification in the nation’s top global cities, like New York, Boston, and Washington, D.C. on the East Coast, and San Francisco and Seattle on the West Coast. It has a gleaming downtown booming with new construction; surrounding neighborhoods with large concentrations of young, educated and affluent urbanites; and dense, walkable areas adjacent to transit, retail, entertainment and institutional development that has sprouted to serve the rapidly rising demographic. The revitalization apparent in the nation’s ‘superstar’ cities is visible in Chicago.

A deeper look into Chicago, the Midwest’s largest city, as well as its economic and cultural capital, shows that it exhibits just as many traits commonly found in its surrounding area. It is at the forefront of revitalization in a region that still suffers from the loss of manufacturing employment and from rigid segregation patterns established during the Great Migration.

Chicago's Gentrification Catalysts

It is becoming clearer that gentrification in Chicago has benefited from a series of local policy actions, along with the implementation of state and federal policies. Those policies, listed roughly chronologically, are:

• Public housing development and placement

• Interstate highway development

• Urban renewal clearance

• Transit improvements on targeted Chicago Transit Authority lines

• City investment in targeted public facilities (parks, police and fire stations; selected schools)

• Widespread utilization of Tax Increment Financing (TIF) districts

• Magnet and charter schools development and expansion

• Deconstruction of Chicago Housing Authority public housing complexes

• School closures on a large scale by Chicago Public Schools

Sadly, however, the policy tools designed to create a better city have rarely been used in an equitable fashion. Chicago’s broader gentrification pattern has been influenced by its legacy of segregation established in the aftermath of the Great Migration that brought African-Americans north from rural, southern states over the first half of the twentieth century. Early on, Chicago adopted a segregation strategy facilitated by the real estate industry, which was enforced by police and even mob violence. Chicago became a bifurcated city. The areas where the legacy of segregation was minimal thrive, and the other areas, starved of the investment that fuels growth elsewhere, lag.

Read the full report here.

Pete Saunders is a writer and researcher whose work focuses on urbanism and public policy. Pete has been the editor/publisher of the Corner Side Yard, an urbanist blog, since 2012. Pete is also an urban affairs contributor to Forbes Magazine’s online platform. Pete’s writings have been published widely in traditional and internet media outlets, including the feature article in the December 2018 issue of Planning Magazine. Pete has more than twenty years’ experience in planning, economic development, and community development, with stops in the public, private and non-profit sectors. He lives in Chicago.

Photo: Chicago Skyline. Source: archdaily.com

Gentrification in Los Angeles

$
0
0

What role does gentrification play in Los Angeles? In their essay, "Gentrification in Los Angeles", Marshall Toplansky, Karla López del Río and Ken Murphy examine how gentrification has impacted the polycentric and dispersed city. Their piece is part of the latest report from the Center for Opportunity Urbanism, Beyond Gentrification: Towards More Equitable Growth, which explores how unbalanced urban growth has exacerbated class divisions, particularly in the urban centers of our largest's metropolitan areas. To read or download the full report click here.

Read an excerpt of their piece below.

Like Chicago, Los Angeles represents a distinct face of American urbanity. It has led the way toward the polycentric and dispersed form that now characterizes virtually all major metropolitan areas. Unlike traditional, monocentric cities, Los Angeles accommodated growth by expanding outwards. Only in recent years has LA experienced gentrification of its older, urban core.

The process of gentrification — repairing or rebuilding homes and businesses in a deteriorating neighborhood, accompanied by an influx of the middle-class or affluent — often results in the displacement of earlier, usually poorer residents. One criterion used to quantify gentrification is the movement of people from the 40th percentile (or below) of income to the 60th percentile (or above), a metric recommended by Governing Magazine.

The Trajectory of LA Gentrification

Los Angeles has a lack of access to affordable housing, goods, and services in low-income neighborhoods that is arguably worse than in the early 90s, the time of the riots. Many in the area, according to surveys, feel a repeat is entirely possible, if not inevitable. Since 1990, only a handful of LA neighborhoods have experienced gentrification. Within the Los Angeles-Anaheim Metropolitan Statistical Area (MSA), they represent between 1% and 2% of all census tracts.

Gentrification started later in LA than it did in Chicago or New York. Spurred by the city’s 1999 Adaptive Reuse Ordinance, massive investment accelerated in the long neglected core. Affected sectors included housing and transportation (notably the subway and light rail lines). In addition, the library was restored, the convention center was improved, and the Staples Center, which cost city taxpayers an estimated $71.1 million, was built.

Read the full report here (PDF).

Marshall Toplansky is Clinical Assistant Professor of Management Science at Chapman University’s Argyros School of Business and Economics, and Research Fellow at the university’s C. Larry Hoag Center for Real Estate. He is also Senior Advisor of The Cicero Group, based in Salt Lake City, Utah. A pioneer in the use of big data and sentiment analysis, Marshall is formerly Managing Director at KPMG, and co-founder of the firm’s Lighthouse Center of Excellence for Data & Analytics.

Karla López del Río is a community development executive committed to supporting low- and moderate-income families build wealth and thriving communities. Her work fosters public-private-grassroots partnerships resulting in innovative community-led projects, affordable housing solutions, homeownership opportunities, and small business development across Southern California. Karla contributes to the field her insight as a first-generation immigrant, a background in real estate, experience in social enterprise management, as well as a Bachelor’s in Development from the University of California, Berkeley. She has received awards from UC Berkeley’s Blum Center for Developing Economies and NeighborWorks America in the categories of poverty alleviation and community building.

Kenneth E. Murphy is the associate provost responsible for leading the academic operations of Chapman University. He is a leader in implementing business analytics at the University with the goal of applying data driven decision-making to academic, business and social challenges. He is the business leader of the university-wide business intelligence project, “Panther Analytics”, as well as a visionary for process improvement and technology implementation projects in academic operations. Additional duties include managing learning and office spaces, hiring of lecturers, scheduling of classes and allocating other academic resources to advance Chapman’s mission of delivering a personalized education of distinction.

Photo: In Santa Ana, makeshift rooms between single-family homes for construction workers that are not able to find affordable rooms for rent. Credit: Julie Leopo


Gentrification in Dallas

$
0
0

The Dallas-Fort Worth area has experienced stunning growth, however Dallas remains one of the most economically and segregated cities in America. Through eye-opening data and pointed solutions, Cullum Clark argues that Dallas can become a national leader in reviving upward mobility in his essay, "Gentrification in Dallas,".

Clark's essay is part of a new report by the Center for Opportunity Urbanism, Beyond Gentrification: Towards More Equitable Growth which explores how unbalanced urban growth has exacerbated class divisions, particularly in the urban centers of our largest's metropolitan areas. To read or download the full report click here.

Read an excerpt of Clark's piece below.

The Dallas region is a microcosm of America’s latest urban evolution. The Dallas-Fort Worth metro area is booming, fueled by a range of thriving industries and a tremendous influx of people and businesses. The city of Dallas — home to 1.3 million of the 7.4 million in the DFW metro — has experienced a stunning resurgence from the dark days of the 1980s oil and real estate crash.

Yet for all its heady growth, Dallas still faces many of the defining challenges bedeviling other major cities and the nation as a whole: a dwindling middle class, growing bifurcation into “have” and “have-not” neighborhoods, an emerging home affordability problem, and rising numbers of poor citizens for whom twenty-first century prosperity seems a sham. In certain respects, the city’s revival has compounded these challenges.

Dallas remains among the most economically and racially segregated cities in America, in part reflecting the heritage of Jim Crow. The poverty rate in the city of Dallas is nearly 23%, one of the highest among large American cities. At the same time, Dallas has a greater opportunity to address these challenges than most of its peers, in view of the DFW area’s economic vibrancy and the city’s comparatively abundant and inexpensive land. Unlike most big cities, Dallas has the potential to build its way out of its current challenges.

Dallas urgently needs to pursue three policy directions in order to shift to a more inclusive and sustainable pattern of urban growth. First, it needs to spark a new home building boom focused on middle and lower-income families, especially in depressed southern Dallas. Second, it should adopt a range of smart policies to preserve and rehabilitate as much of the existing housing and commercial real estate stock as possible in less advantaged areas. And third, it needs to get considerably more creative about bringing urban amenities — innovative schools, stores, restaurants, health clinics, greenspace and arts facilities, and the middle-skilled jobs that come with them — to historically underserved areas. If it gets these things right, Dallas can become a national leader in reviving upward mobility and the promise of the middleclass American Dream.

Read the full report here (PDF).

Cullum Clark is Director of the George W. Bush Institute-SMU Economic Growth Initiative and Adjunct Professor of Economics at SMU in Dallas. As Director, he leads the Bush Institute’s work on domestic economic policy, including programs focused on Opportunity and Ownership and on Fiscal Reform. Cullum worked for 25 years in the investment industry, at two Wall Street firms and then as founder and president of a Dallas family office. He has served on the board or investment committee of numerous non-profits and early-stage businesses. He earned his PhD in Economics at SMU in 2017. His research and policy interests include fiscal policy, monetary policy, economic geography and urban economics, and economic growth. He also earned his undergraduate degree at Yale and a Master’s degree at Harvard. Cullum and his wife Nita live in Dallas and have three daughters.

Photo: Robert Hensley [CC BY 2.0], via Wikimedia Commons

Looking Forward: A New Agenda

$
0
0

In their essay, "Looking Forward: A New Agenda," Joel Kotkin and Wendell Cox lay out five key principles for inclusive urban growth. Their piece is part of a new report by the Center for Opportunity Urbanism, Beyond Gentrification: Towards More Equitable Growth, which explores how unbalanced urban growth has exacerbated class divisions, particularly in the urban centers of our largest's metropolitan areas. To read or download the full report click here.

Read an excerpt of their piece below.

Life may have improved for many in our urban centers, but, as we have seen, many others are being left behind. Gentrification strategies, often focused on the downtown core, have done little for either the remaining middle or the largely impoverished working class, who together comprise the majority of urbanites. A recent Brookings analysis found that from 2010 to 2015, of the 30 US metros that increased their productivity, average wages, and standard of living, only 11 metros achieved inclusive economic outcomes.

Still, some urban writers embrace the idea of keeping poor neighborhoods as they are, with their low consumption rates and lack of cars, in part to reduce the area’s carbon foot-print. This seems a cruel and misplaced view. Rather than treating inner city residents as environmental lab rats, we should embrace the idea that cities, first and foremost, be places of opportunity, not only for the well-heeled and well-educated, but for all residents. The current approaches, as we have shown, lead to negative consequences in terms of higher rents and house prices, and even in reduced economic opportunity.

We believe it is time to move beyond the focus on gentrification led by the “creative class,” as Richard Florida, the term’s own author suggests.4 Overall, according to two recent Oregon studies, lower-income people in cities now experience less upward mobility than people from rural areas. The poorer people left in the urban core suffer from lack of opportunity, and seem to carry with them cultural and economic burdens that keep them from ascending to the middle class.

This situation is not sustainable. History shows us repeatedly that huge income gaps and a sense of diminished opportunity can lead to disorder, alienation and a breakdown of the civic order, as evidenced by the growth of moves for rent control, greater housing subsidies and low levels of labor participation.6 Ancient Rome, industrial-era London, Manchester, St. Petersburg and Shanghai, for example, all experienced revolts, and in some cases revolutions, led by the neglected classes. Substantial unemployment and economic insecurity can undermine social stability.

How do we meet this challenge? The current resources for this report were not sufficient to lay out a specific strategy. Instead, we provided a set of new principles that should shape urban policy. We do not oppose gentrification that occurs naturally, as people seek out the urban core. However, the massive funds that are spent to attract more of the creative class and appeal to the hyper-affluent have not, and will not, improve life for most urbanites. For many, this approach can only mean further impoverishment, largely due to higher rents, or lead to mass migration out of the cities that, for some, have been home for generations.

Read the full report here (PDF).

Wendell Cox is a senior fellow at the Center for Opportunity Urbanism in Houston and the Frontier Centre for Public Policy in Canada. He was appointed to three terms on the Los Angeles County Transportation Commission, served on the Amtrak Reform Council and served as a visiting professor at the Conservatoire National des Arts et Metiers, a Paris university.

Joel Kotkin is the RC Hobbs Presidential Fellow in urban futures at Chapman University and director of the Chapman Center for Demographics and Policy and executive director of the Center for Opportunity Urbanism in Houston, Texas. He is author of eight books and co-editor of the recently released Infinite Suburbia. He also serves as executive director of the widely read website www.newgeography.com and is a regular contributor to the Orange County Register, Forbes. com, Real Clear Politics, the Daily Beast and the City Journal.

Photo: Jubilee Park, Dallas

Birds of Passage: Quantifying Jacobs’ gloom

$
0
0

While the debate continues unabated on the impact of the physical and land use characteristics of a city on crime a critical aspect is left out – resident transience. Jacobs took notice and feared its negative influence: was she right?

In her book (1961), Jacobs issued a thoughtful warning about the influence of tenancy on crime:

“I [….] anticipate with gloom and foreboding the recent news that exactly this transformation [turning a private property into multiple tenancy] is scheduled for the rest of the block frontage […]. A city neighborhood can absorb and protect a substantial number of these birds of passage, as our neighborhood does. But if and when the neighborhood finally becomes them, they will gradually find the streets less secure, […..].” And so, inevitably, will all others. Was she right?

This quote spells an unsubstantiated observation, a warning and an implied but unhelpful remedy; no statistical assessment of safety pre-and-post conversion and not even a speculative tenant (“them”) ratio are cited. This amounts to an ominous and instructive message for neighbourhoods but without specifics. So perhaps it’s time to test Jacobs’ thesis against the facts. We looked at various factors --- ownership, length of residency --- against the incidence of crime. We also tried to explore the notion of a threshold, a tipping point of reasonable safety.

Ownership, Renting and crime

Figure 1. Relation of ownership rate and crime rate for 100 city neighbourhoods (Ottawa, ON)

Data: Ottawa Neighbourhood study

This strong correlation (R2=0.492, Fig 1) can be partly explained by the respective income levels of tenants and owners. Poverty has been indisputably correlated with crime. The average income of Ottawa renter households for 11 years (2006 – 2016) was 49% of those of owner households and a much higher percentage of renters households (32.3%) were in core need, those who pay more than 30 percent of their income on rent, than owner households (6.4%). Ownership, through demonstrable wealth, stands proxy also for education, a known factor in crime levels.

In this city, owners constitute 67.3 % of households and most cluster in identifiable districts. This concentration allows the data to highlight the differences in crime rates between homeowner districts to those with a varied mix of owners and tenants. If poverty is associated with crime and if tenants belong mostly to lower income quintiles, it stands to reason that the odds of crime increase with the tenant share. Figure 1 confirms that probability. Speculating on why or how relative wealth and education correlates with crime falls outside the focus of this piece. It suffices that it can now be shown with certainty that Jacob’s foreboding is borne out at least for this city: more tenants equals less safety. But what about the implied tenants’ relative transience?

Owners, renters and length of residency

Jacobs alluded to the high turnover and short stay of tenants in rental buildings on her street (“we don’t even recognise their faces”) as one contributing factor to decreased safety. What do we know about the length of residency among owners and tenants?


Figure 2. Length of Residency by tenure group

Data from: Final_Report_No209_Long-term-private-rental-in-a-changing-Australian-private-rental-sector.pdf -table 9

To paint a picture, we rely on US, British and Australian reported comprehensive statistics. Figure 2 shows that only 13.3% of private renters stayed in place in the last 5 years as opposed to five times that (68.9%) of other tenure types. Similarly, at the other end of move frequency, 7% of tenants moved five times in the same period as compared to about 1% percent of other tenures. Tenants’ relative mobility appears extraordinary. US statistics present a similar picture: Owners have been in their current location for 12 years versus tenants for only 2 years, only one sixth as long. An English housing survey shows very similar duration patterns: Owners have occupied their dwellings for an average of 16 years and tenants for just over 2 years (1/8). Statistics for Ottawa do not differentiate between tenants and owners’ residency length but it is reasonable to assume that they would closely follow the consistent pattern reported by these three OECD countries.

Figure 3. Residency length and crime rate (based on 100 neighbourhoods)

(Data from the Ottawa Neighbourhood Study)

Figure 3 displays a reliable correlation (R2 = 0.2865) between length of tenure and neighbourhood crime rate. It is commonly understood that short tenures undermine casual and, more so, frequent social interaction. They also diminish the likelihood that transient residents will partake in communal activities. Having determined the relative mobility ratio between owners and tenants – around 1/6 at least – we can reasonably surmise that the dominant vector in this correlation would be tenants’ mobility.

Once again, Jacobs’ fear about the “birds of passage” is borne out by the tenure duration statistics. Their move frequency can arguably be added to their income level (i.e. relative poverty) as a factor in neighbourhood crime events. With these two factors at play, we can now venture to quantify the “substantial number” (i.e. the threshold of tenant ratio) past which neighbourhood safety may deteriorate irrevocably. How many tenants are too many?

Tenant ratio threshold

All professional practices that ensure the well-being of city residents use thresholds as indispensable pointers. Codes and manuals are replete with thresholds – maxima, minima, critical and graduated. Such thresholds are normally based on fundamental theory and often verified by experiment. In this case, mainly a social outcome prediction, theory is non-existent and experimentation impossible. Under these constraints, we can only try to tease out a rudimentary threshold from available data (with no illusions about its validity and generality.) The intent of this experiment is simple: to demonstrate that intervention can only be justified on the basis of a quantified threshold.

To arrive at a speculative threshold, we took the average city crime rate as an indicator of acceptable safety; an arbitrary choice but reasonable, given the city’s comparatively high safety level among Canadian CMAs. Other choices, based on a different rationale, could be deemed equally valid, and, upon reflection, adopted.

Figure 4. Determining a renter ratio threshold, based on community crime statistics

(Data: Ottawa Neighbourhood Study -authors calculations)

After dividing the 100 communities into sets according to their percentage of owners, we calculated the crime ratio of each community in every set with respect to the city’s average. We then determined the average of each set. Figure 4 shows three sets, their average ownership rates and their average crime ratios to the city’s average rate. Group 2 displays an average ratio of 1.1, that is a crime rate roughly equal to the city’s average. Absent a more rigorous analysis, we can state, while acknowledging the limitations of this trial, that a minimum 60% ownership rate (i.e. a maximum of 40% renter) would be a likely threshold for reasonable safety in a given community, at least in this sample city. This result quantifies Jacobs’ vague “substantial number”. In this example, over half of the one hundred communities exceed that threshold.

Maintaining a tenant ratio: the challenge

Assuming that a threshold ratio has been established by thorough analysis, two issues arise automatically in existing neighbourhoods: the first is monitoring the ratio; the second, preventing excess rental units from being built - beyond the threshold. Currently, there exists no mandate or mechanism for monitoring such ratios or for enforcing them. How can a neighbourhood avoid an undesirable transformation?

Resisting unwelcome neighbourhood change (e.g. gentrification) inevitably falls in the hands of its existing residents. Jacobs opposed a highway and other “projects” in Manhattan in part because they created a situation “when the neighbourhood becomes them” (i.e. transient tenants) . At this time, any objections based on personal forebodings and opinions alone are automatically suspect, quickly branded NIMBY-ism, and looked upon as snobbish, discriminatory and anti-urban. Worse still, as objections to rental projects naturally stem from long time residents, who, as we saw, are predominately owners, they, as such, fuel disproportionate suspicion and intensify the incriminatory rhetoric.

Here we have the makings of a perfect urban dilemma: protecting one’s neighbourhood is held up as a personal civic duty, a laudable task, but also grounds for vilification and banishment. Jacobs showed a way out of it, but is it the only path?

Conclusion

In earlier posts we suggested that the social fabric of a neighbourhood is a far better predictor of its crime rate than its physical structure. Building on Jacobs’ casual discussion of tenancy in a neighbourhood, we uncovered the potential role of an additional socio-economic characteristic, as yet unrecognized – being a tenant. Jacobs’s apprehension about exceeding an unspecified threshold of tenant ratio in a neighbourhood turns out to be justified. Going beyond this assertion, we calculated such a threshold tentatively only for a given city, while emphasizing the need for developing a reliable method for defining it. This new indicator could help us to assess neighbourhood change on rational grounds and add some new elements to the policy debate.

Fanis Grammenos is the director Urban Pattern Associates in Ottawa, Ontario and the author of Remaking the City Grid: A Model for Urban and Suburban Development. Reach him by email at fanis.grammenos@gmail.com with questions or comments.

Photo: Rebecca Kennison [CC BY-SA 3.0], from Wikimedia Commons

Party of the People? Or the Oligarchs?

$
0
0

The Trump uprising, with a renegade capitalist serving as the tribune of the forgotten working class, appears headed toward an inevitable denouement. Trump’s intemperance, jingoism and lack of political skills have undermined the GOP’s ability to reach beyond its base in the South, the exurbs and parts of middle America.

The Democrats should be able to easily overcome this collapsing regime, much as has occurred in California when the GOP managed to alienate immigrants in an ever more diverse state. An entire generation of young people, minorities and immigrants have been lost, and, almost by default, the Democrats are positioned to consolidate their power on a national basis.

Yet Democrats’ identity is uncertain beyond being anti-Trump. Yes, they may be somewhat united pro forma on gender, race and cultural issues, but need to address their looming internal contradictions on key issues including class and geography.

Ruling class or working class?

In the past Democrats attracted large numbers of middle- and working-class voters seeking their fair share of the national cornucopia. But over the past 20 years they have become increasingly dominated by what historian Fred Siegel has called “an upstairs, downstairs” coalition, bringing together the most destitute with the most privileged parts of our society.

Nancy Pelosi, the mega multi-millionaire from San Francisco, epitomizes “upstairs downstairs” politics of the party. Neither she nor President Obama threatened the ascendency of the tech oligarchs, in fact saving them from strong anti-trust action while raking in their generous political contributions. Some putatively left-wing candidates including Kamala Harris also seem anxious and willing to serve as their chosen tool. The oligarchs, after all, do “not have to rule,” notes historian Jeffrey Winters, but they likely will draw the line at such things as regulation, anti-trust and capital-gains rates that threaten their hegemony.

In contrast, the new progressive heartthrobs, such as Alexandria Ocasio Cortez, openly regard tech and Wall Street billionaires, much as Bernie Sanders did in 2016, as class enemies. They seem certain to reject nominally “woke” and self-financing oligarchal candidates such as Michael Bloomberg — we have apparently been spared a Tom Steyer candidacy — as they regard billionaires as inherently “immoral.”

Cobbling together a coalition will be difficult

Perhaps the Democrats will manage, as Franklin Roosevelt managed with white Southerners and northern liberals, to maintain this motley alignment. But as more Democrats favor socialism over capitalism, according to Gallup, there’s pressure for an ever more extensive program of “free” stuff. Higher taxes will be needed to fund the socialist agenda and this cannot be raised entirely from the super-rich, who are adept at avoiding them. As Tyler Cowen has pointed out, the big money will come from the same wealthy suburbanites — some of whom voted blue due to GOP policies taking away write-offs for local taxes — who now represent a larger proportion of their political base.

Similarly, attempts to recover working-class voters, many of whom supported Trump in 2016, may prove difficult. The party’s increasingly aggressive green agenda almost certainly will hit hardest the manufacturing, energy and agricultural economies that have benefited under Trump’s economic policies. The quixotic ”green New Deal” to end fossil fuels by 2030, a goal widely discredited even by the likes of Bill Gates and Google engineers, could help Trump and the GOP maintain their primacy in a vast swath of the country.

Attempts to build a fossil- and nuclear energy-free grid seems likely to raise the price of energy and force more basic industry elsewhere, as has already occurred in green hotbeds such as California and Germany. One has to wonder how the “green new deal” will play in the rustbelt of the Midwest and the manufacturing centers in the South, not to mention the oil patch that extends from Texas to the Dakotas. These areas, unlike California, cannot rely on tech oligarchs for cash if they de-industrialize.

How to bury Trump

If Democrats are serious about deposing Trump, and the GOP, they should focus on pragmatic candidates such as Joe Biden, Colorado’s John Hickenlooper, Minnesota’s Amy Klobuchar or even Texas’ Beto O’Rourke. Moderation, even civility, no doubt will offend the intersectional PC crowd, but such well-positioned candidates could turn the GOP 2020 campaign into a modern version of Pickett’s charge.

Sadly, pragmatism seems increasingly out of fashion among Democrats. Most of the leading candidates — Elizabeth Warren, Kamala Harris, Cory Booker — have been embracing a program of massive tax increases, ever more environmental regulation, the elimination of the fossil fuel industry, imposed high density and large income r-distribution. None of these are likely to appeal to suburban or small town voters.

To be sure, most any candidate could defeat the consistently unpopular Trump, but long-term Democratic pre-eminence can only be assured by appealing to more than true believers. Successful Democrats, from Roosevelt and Truman to Bill Clinton, learned this lesson, and the party, and the nation, were better off for it.

This piece originally appeared on The Orange County Register.

Joel Kotkin is the Presidential Fellow in Urban Futures at Chapman University, director of the Chapman Center for Demographics and Policy and executive director of the Center for Opportunity Urbanism in Houston, Texas. He is author of eight books and co-editor of the recently released Infinite Suburbia. He also serves as executive director of the widely read website www.newgeography.com and is a regular contributor to Forbes. com, Real Clear Politics, the Daily Beast, City Journal and Southern California News Group.

Photo credit: U.S. Air Force Staff Sgt. Marianique Santos [Public domain], via Wikimedia Commons

Transit: The Long Commute

$
0
0

The headline trumpeted “Report: 98 Percent Of U.S. Commuters Favor Public Transportation For Others,” in a 2000 edition of The Onion, the leading national satirical newspaper. The spoof suggested a national transit promotional campaign with the slogan “Take The Bus… I'll Be Glad You Did,” and quoted a Los Angeles 80 mile daily commuter “Expanding mass transit isn't just a good idea, it's a necessity… My drive to work is unbelievable. I spend more than two hours stuck in 12 lanes of traffic. It's about time somebody did something to get some of these other cars off the road."

The Onion“Disconnect”: Transit’s Disproportionate Share of Long Commutes

The reality is that transit often polls well, being perceived as a means to reduce traffic congestion. Many billions have been spent on new rail systems to attract drivers from their cars to transit, often financed with tax money paid principally by households who predominantly use cars, not transit. Yet, 17 years after The Onion article, transit’s market share is stuck and in 2017, for the first time, the number of people working at home every day exceeded the number commuting on transit.

There is a substantial disconnect between public attitudes The Onion implies and how people actually commute. In fact, there are many 80 mile commuters and all of them spend more than one-hour commuting one way to work. And, they are disproportionately on transit.

This article describes 60 minute and longer commutes (referred to as “long commutes”) to transit destinations at the national level and by major metropolitan area (over 1,000,000 population) as reported for 2017 in the American Community Survey.

In 2017, 9.3 percent of US commuters spent 60 or more minutes each way traveling to work. Surprisingly, workers who drive alone are the least likely to have long commutes (7.4 percent). Those commuting by car pools are somewhat more likely to have long commutes (10.9 percent). But transit commuters are by far the most likely to have long commutes (39.0 percent). Thus, transit commuters are five times as likely to travel 60 or more minutes than those who drive alone (Figure 1).

Long Commutes in the 10 Strongest Transit Cities

Contrary to conventional wisdom, transit simply does not result in shorter commutes. Figure 2 portrays longer commute data for the 10 metropolitan areas with the largest transit work trip destination market share. This includes the overall percentage as well as the percentage for driving alone, car pools and transit. In each of the 10 cities, driving alone has the smallest share of long commutes. Additionally, in each city, car pools have a somewhat larger percentage of long commutes, while transit has the longest commute, by far.

Solo drivers are most likely to have long commutes in San Francisco (16.9 percent) and Washington (16.4) percent. In much larger New York only 13.4 percent of drivers have a long commute, slightly better than Boston (13.5 percent). The smallest long commute percentages are in Portland (7.1 percent) and Pittsburgh (7.5 percent), which also have the smallest populations among the 10 strongest transit metropolitan areas. Philadelphia, a strong transit city, has a comparatively low 9.7 percent share of solo drivers have a long commute.

The largest percentages of car pools with long commutes is also in San Francisco (22.0 percent) and Washington (21.7 percent). Portland (10.2 percent) and Philadelphia (10.7 percent) and Pittsburgh have the smallest share of car pool workers with long commutes.

New York has by far the largest share of long commutes by transit, at 44.9 percent of transit commuters. San Francisco, Washington, Chicago, Boston and Baltimore have between 35 percent and 40 percent of transit commuters travel 60 or more minutes each way to work. Again, the smallest share of long commutes by transit are in Pittsburgh (26.8 percent) and Portland (28.4 percent).

The larger percentage of long commutes by transit is compared to those of solo drivers in Figure 3. There is considerable variation. In San Francisco, the share of long commutes among transit riders is 2.2 times that of solo drivers, and 2.3 times in Washington. In Boston transit riders are 2.7 times as likely to have long commutes as solo drivers. In Chicago and New York, transit riders are 3.3 times as likely to have long commutes as solo drivers. Portland has the largest share of transit riders with a long commute compared to solo drivers, at 4.0.

All Major Metropolitan Areas and Los Angeles

The table below provides the long commute data for all 53 major metropolitan areas. Overall, New York has the largest long commute share, while Rochester has the smallest. Among solo drivers as well as those commuting by car pool, San Francisco has the largest long commute share, while Las Vegas has the smallest. San Jose has the largest share of transit long commutes, which at 54 percent is the result of Silicon Valley’s draw of commuters from well outside the metropolitan area, in adjacent San Francisco (and Stockton, not a major metropolitan area). The smallest share of long commutes in transit is in Hartford.

Perhaps surprisingly, the nation’s second largest metropolitan area, Los Angeles, ranks 12th in transit work trip market share. Long fabled for its intense traffic congestion, 15.4 percent of solo drivers in Los Angeles have long commutes, a lower proportion than in New York, San Francisco, Washington, Boston and San Jose. About 2.8 times as many transit commuters proportionally have long commutes than solo drivers. This is despite having spent nearly $20 billion (not inflation adjusted) on urban rail and busway construction through 2016, according to former SCRTD (now MTA) transit system Comptroller Thomas A. Rubin, with ridership reduced by more than one-fifth since 1985, just a few years before the first rail line opened (Figure 5, Courtesy of Thomas A. Rubin). The actual decline is doubtlessly greater because the addition of the rail system increased the number of transfers (see: “Just how much has Los Angeles transit ridership fallen,” particularly Figure 1).

Explaining the Disconnect

The longer travel times on transit do much to explain the “disconnect” that The Onion article seems to imply. Yes, people like transit, but avoid it largely because of its slow travel time. There are, of course, exceptions, where transit competes very well with solo driving, such as to the cores of the legacy cities, New York, Chicago, Philadelphia, San Francisco, Boston and Washington. But overall far fewer people can reach work in 30 minutes by transit as by driving. Access is the real barrier. On average workers in the major metropolitan areas can reach more than 55 times as many jobs by car as by transit in 30 minutes. Even in New York, with its world-class transit system, autos provide access to six times as many jobs as by transit. The Onion got it right.

Wendell Cox is principal of Demographia, an international public policy and demographics firm. He is a Senior Fellow of the Center for Opportunity Urbanism (US), Senior Fellow for Housing Affordability and Municipal Policy for the Frontier Centre for Public Policy (Canada), and a member of the Board of Advisors of the Center for Demographics and Policy at Chapman University (California). He was appointed to three terms on the Los Angeles County Transportation Commission, where he served with the leading city and county leadership as the only non-elected member. During that time, he authored the amendment that created the Proposition A 35% set aside that established the first local funding for the rail system. His involvement on the Commission is detailed in Transit in Los Angeles.

Photograph: Katy Freeway (Interstate 10), Houston
https://en.wikipedia.org/wiki/Interstate_10_in_Texas#/media/File:RF_-_Ho...

Viewing all 3793 articles
Browse latest View live


Latest Images