Quantcast
Channel: Newgeography.com - Economic, demographic, and political commentary about places
Viewing all 3789 articles
Browse latest View live

The American Heartland’s Position In the Innovation Economy

$
0
0

The following excerpt is from The American Heartland’s Position In the Innovation Economy, a newly released report written by Ross DeVol, Jonas Crews, and Shelly Wisecarver. Their report highlights the strengths and weaknesses of the American Heartland's position in the 21st century economy. Read the full report (PDF) here.

"The innovation capacities of places are a key driver of long-term economic performance in the United States, other advanced nations, and emerging nations. The states and regions who invest in and nurture innovative activities and build human capital will establish ecosystems that create high-paying jobs for their citizens and attract migrants from other states and nations, boosting economic growth further. This paper evaluates the American Heartland’s position in the innovation economy relative to the rest of the country. We identify key strengths, but also identify gaps that should be narrowed through the development and implementation of thoughtful, well-articulated public policy.

This analysis demonstrates that there are unrevealed or unrecognized innovation strengths in the American Heartland. However, many opportunities currently exist to improve its economic position. In order to close the divergence in performance between the Coasts and the American Heartland; it must participate more fully in the innovation-driven economy of the 21st Century.

In developing an evaluation of the 19 states included in the American Heartland (see Figure ES1), we utilized the Milken Institute’s State Technology and Science Index (STSI), supported by the State New Economy Index published by the Information Technology & Innovation Foundation. The two indices are the most widely used measures showing how states are positioned for participation in an environment of innovation-driven economic growth. The lead author of this report, with support from his former colleagues at the Milken Institute, developed the STSI in 2002. The efficacy of the STSI is demonstrated in its ability to explain 75 percent of the difference in real technology-related GDP per capita and two-thirds of income per capita of the working-age population between the 50 states.

The STSI includes 107 individual metrics that segment into five subcategories to benchmark where states are positioned on innovative activities. All metrics are normalized relative to some benchmark such as population, gross state product (GSP) or other measures to adjust for the size of each state’s economy. The five composites include 1) Research and Development Inputs, 2) Risk Capital and Entrepreneurial Infrastructure, 3) Human Capital Investment, 4) Technology and Science Workforce and 5) Technology Concentration and Dynamism (please see the Introduction section for a more thorough description)."
Read the full report (PDF) here.

Ross DeVol is a Walton Fellow at the Walton Family Foundation and is based in Bentonville, Arkansas, focusing on research on policies related to economic vitality in Northwest Arkansas and the American heartland. Ross is the former chief research officer at the Milken Institute, where he was responsible for overseeing research on international, national and subnational growth performance; access to capital and its role in economic growth and job creation; and health-related topics. He was ranked among the “Superstars of Think Tank Scholars” by International Economy magazine.

Jonas Crews is a Research Associate in economics, supporting Walton Family Foundation Fellow Ross DeVol. Prior to joining the foundation, Jonas was a senior research associate for the Federal Reserve Bank of St. Louis, where he conducted spatial analysis, created surveys and coauthored journal articles and blog posts on trade and the macroeconomy. Jonas holds a Bachelor of Science in economics with a focus in the quantitative track from Auburn University.

Shelly Wisecarver is a Program Support Associate in economics, supporting Walton Family Foundation Fellow Ross DeVol. Prior to joining the foundation, Shelly was a multifaceted entrepreneur who has begun more than a dozen business start-ups across the Heartland. Shelly’s business background includes restaurateur, dental manufacturer, dental wholesale supply, and clothing, jewelry, and furniture retail. She graduated from the University of Arkansas Summa Cum Laude with a Bachelor of Arts in nonprofit business communication. Shelly is located in Bentonville, Arkansas.


The Evolving Urban Form: Lisbon

$
0
0

Lisbon, Portugal’s capital is located on the wide estuary of the Tagus River, with a bridge modeled after San Francisco’s Golden Gate Bridge connecting the core city to the suburbs to the south. Lisbon also resembles San Francisco in being picturesque, with the urbanization mixed with the complex geography of the coastal waters, dominated by hills.

Lisbon is Portugal’s capital, and has a built-up urban area estimated at 2.7 million residents, covering a land area of 960 square kilometers (370 square miles). Its urban population density of 2,800 per square kilometer (7,300 per square mile) is nearly identical to that of larger European Union urban areas (those over 500,000), slightly less dense than the metropolitan areas of Toronto and 20 percent denser than Los Angeles and more than one-half denser than New York (Note 1).

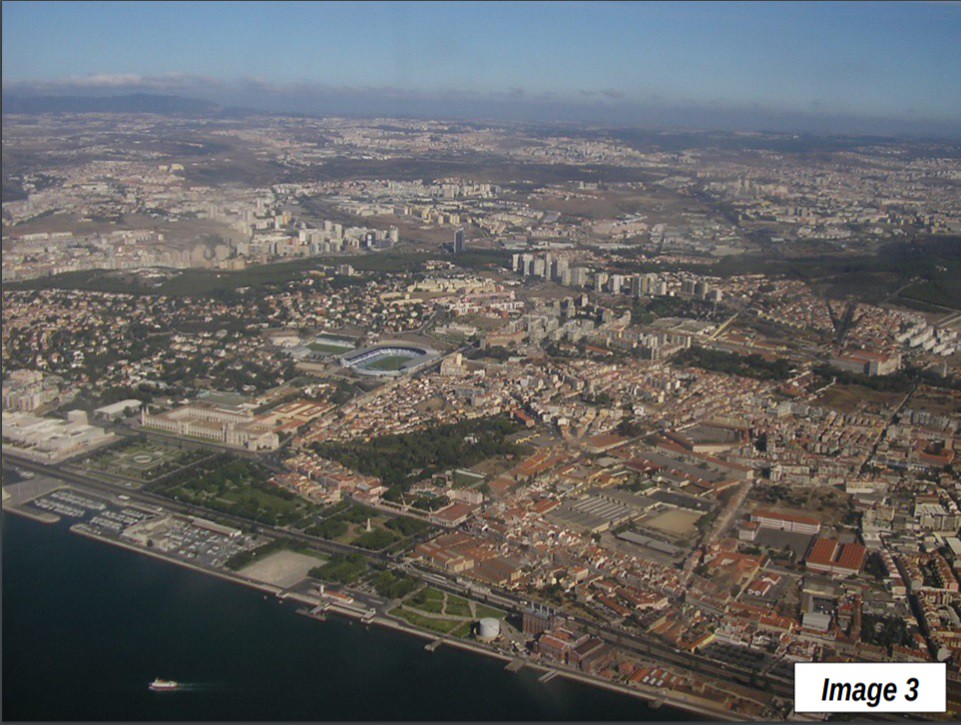
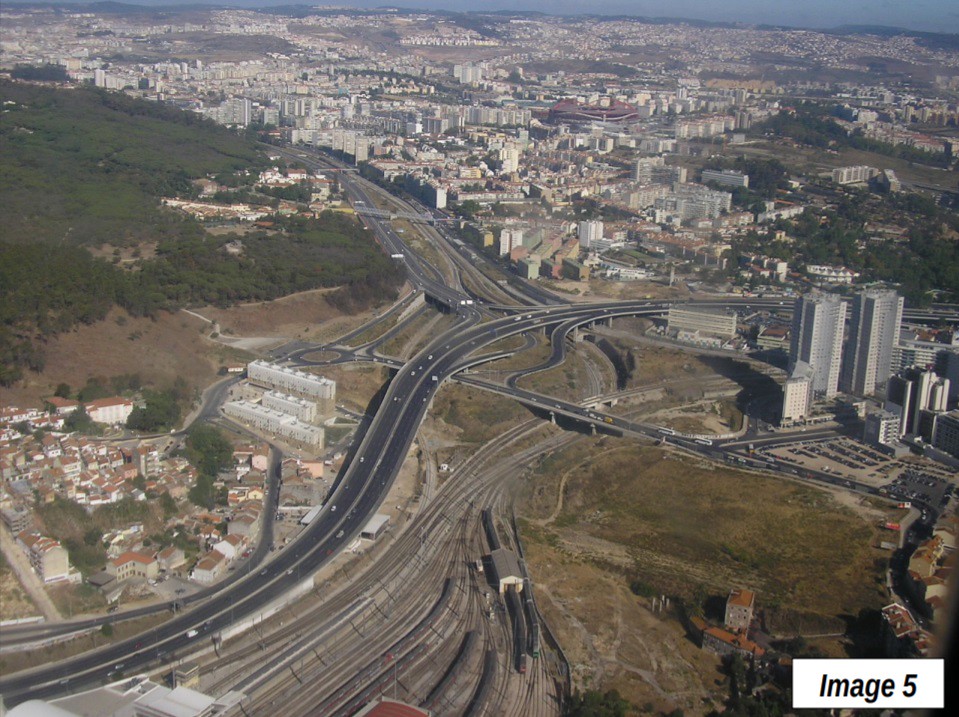
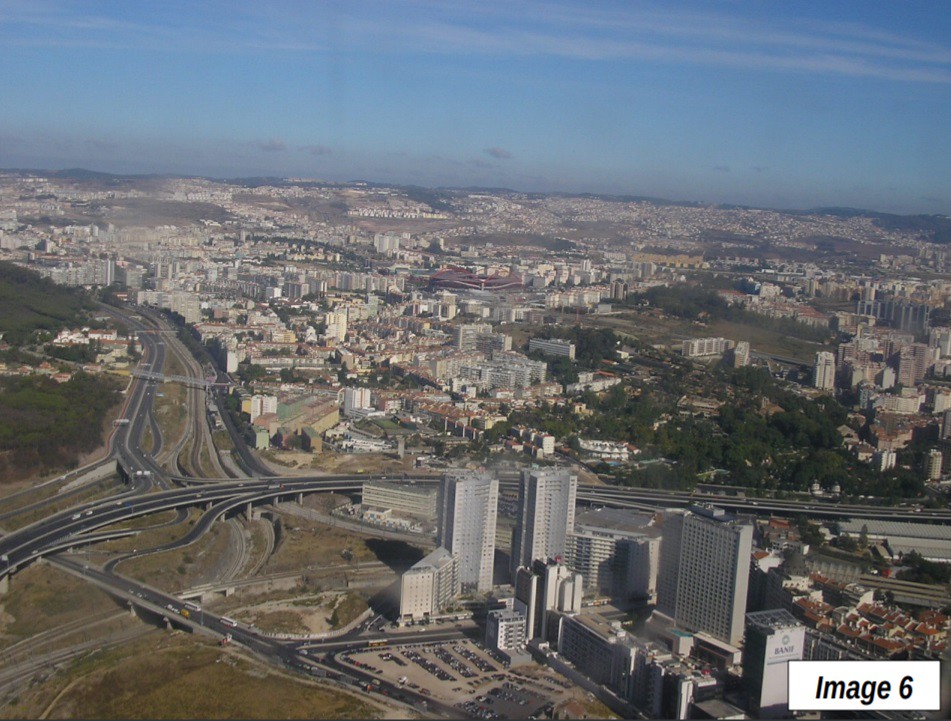
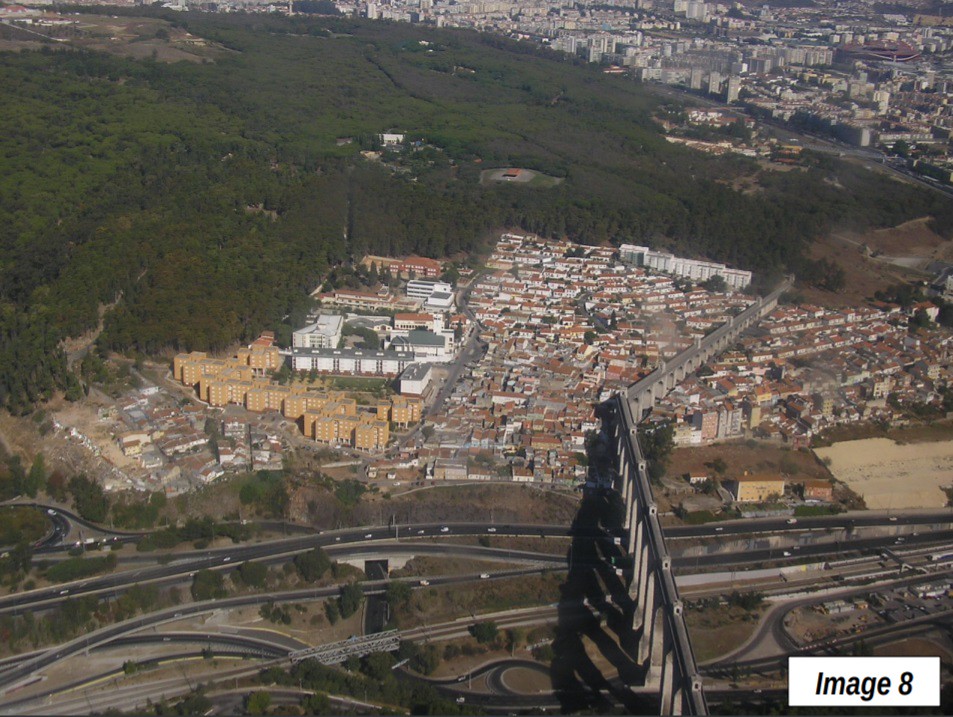
Images 2 and 3 show the aerial approach to Lisbon, with the Atlantic Coast and the southern suburbs, with the estuary of the Tagus River in the top third of the picture. The Ponte 25 de Abril (25th of April Bridge), which connects the southern suburbs (below the Tagus River) and the city of Lisbon (above) is faintly visible toward the upper right of the photograph. The Images 3 through 8 are additional aerial views and show the Águas Livres Aqueduct, which is also shown at ground level from the IP-7 motorway in Lisbon (Image 9).

Population Growth Exclusively in the Suburbs

Consistent with trends around the world, all of the urban area’s population growth has been outside the historic core municipality for decades. Lisbon’s population peaked at nearly 810,000 around 1980. Since that time, there has been a steady decline. The most recent estimate indicates a population of just over 500,000 (2017). In 1980, Lisbon’s population density was about 8,000 per square kilometer (21,000 per square mile), approximately equal to the present density of the city of San Francisco. Now, the municipality of Lisbon’s population density is approximately 5,000 per square kilometer (13,000 per square mile), little more than that of Los Angeles suburb Santa Ana in Orange County.

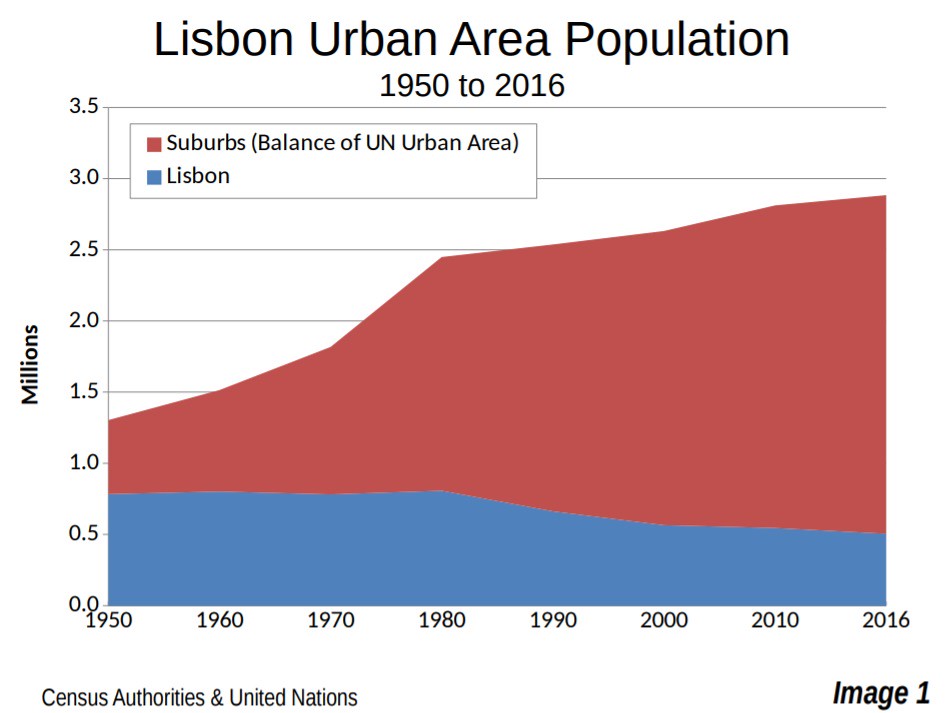
During the 1960s, the suburbs passed Lisbon in population and are now home to more than 80 percent of the population (Image 1). Suburban population has increased by more than 1,600,000, while the municipality has lost 300,000. Much of the suburban population growth was in Sintra, located to the extreme northwest of the urban area, along the Atlantic coast and north of Cabo Roca (below), While Lisbon was losing at least 260,000 residents over the last three decades, Sintra was gaining 150,000 and is the second largest municipality in the area with 385,000. Lisbon, however, remains the largest municipality in the urban area. Lisbon has thus been spared the ignominy of the nation’s second largest urban core municipality, Porto, which has seen its population fall to about 25 percent lower than that of suburban Vila Nova.

Commercial Centers

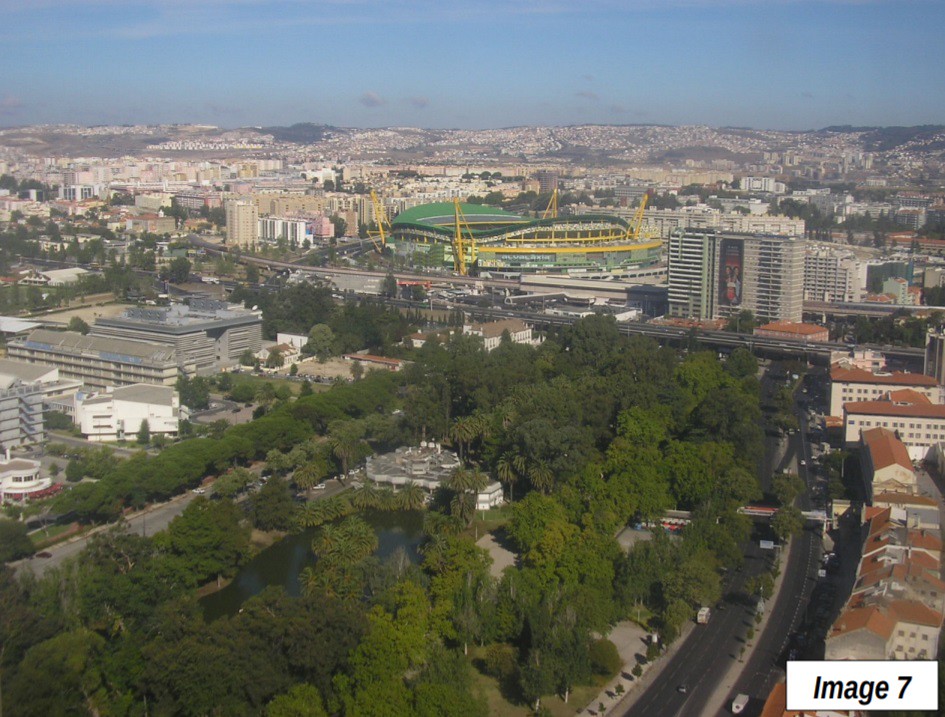
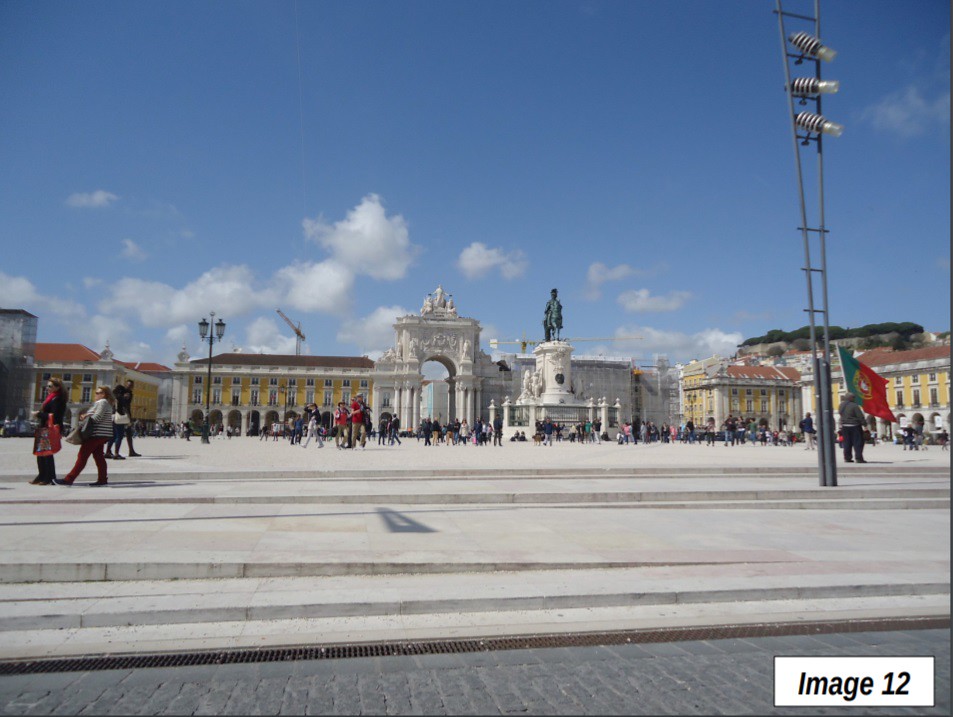
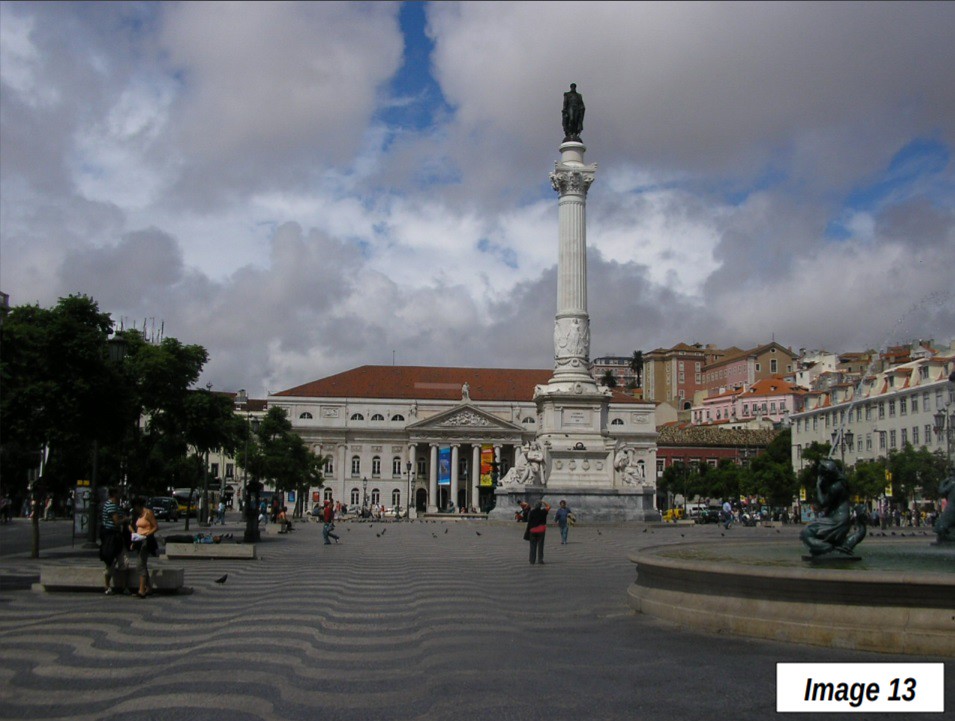
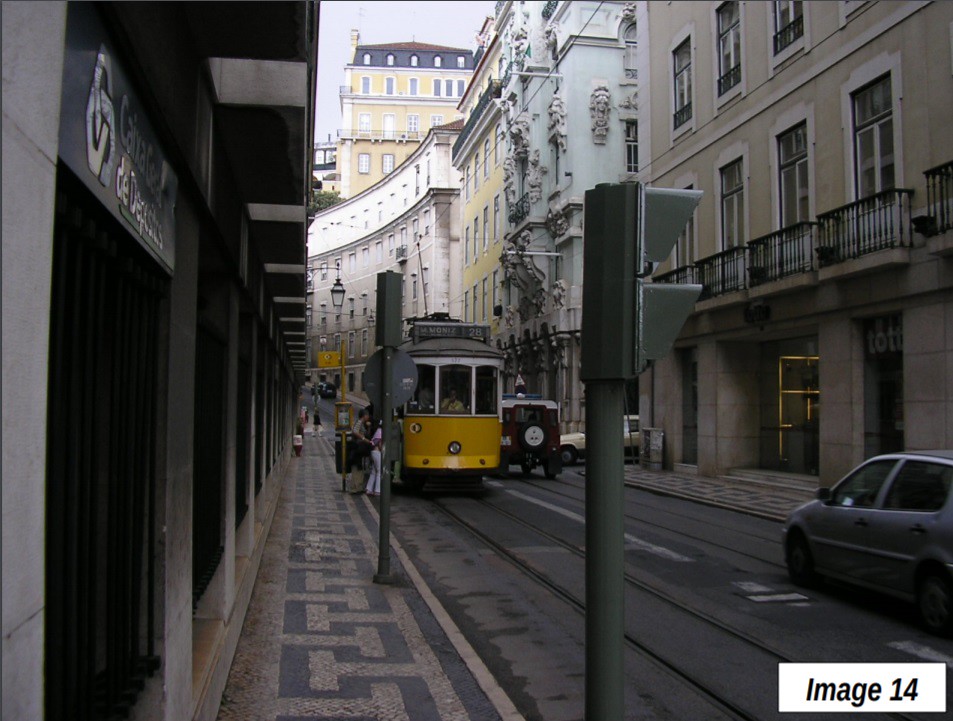
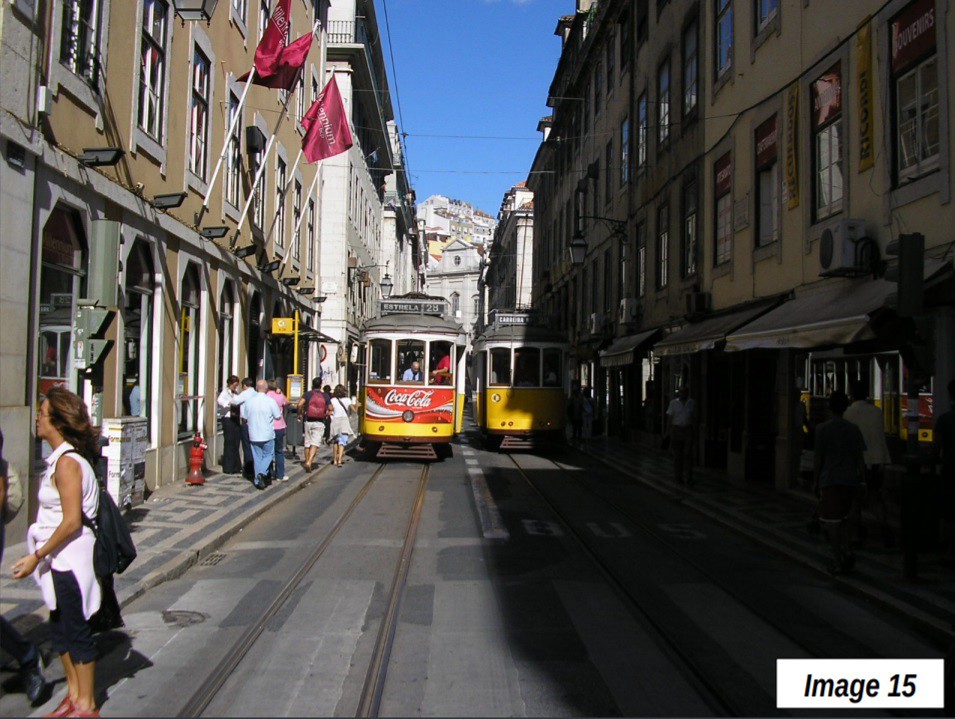
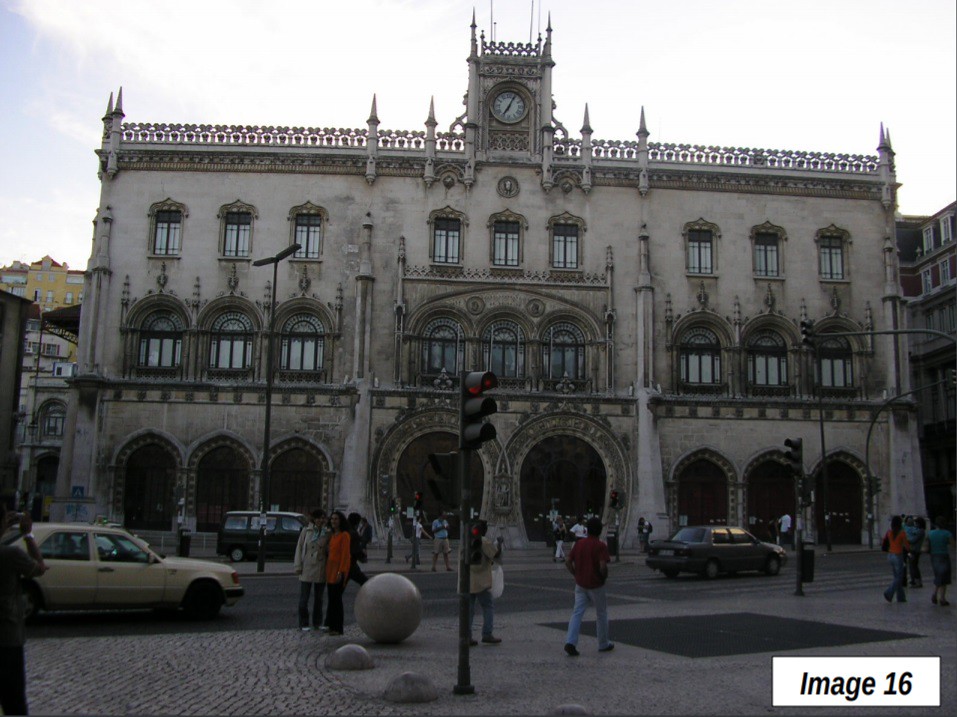
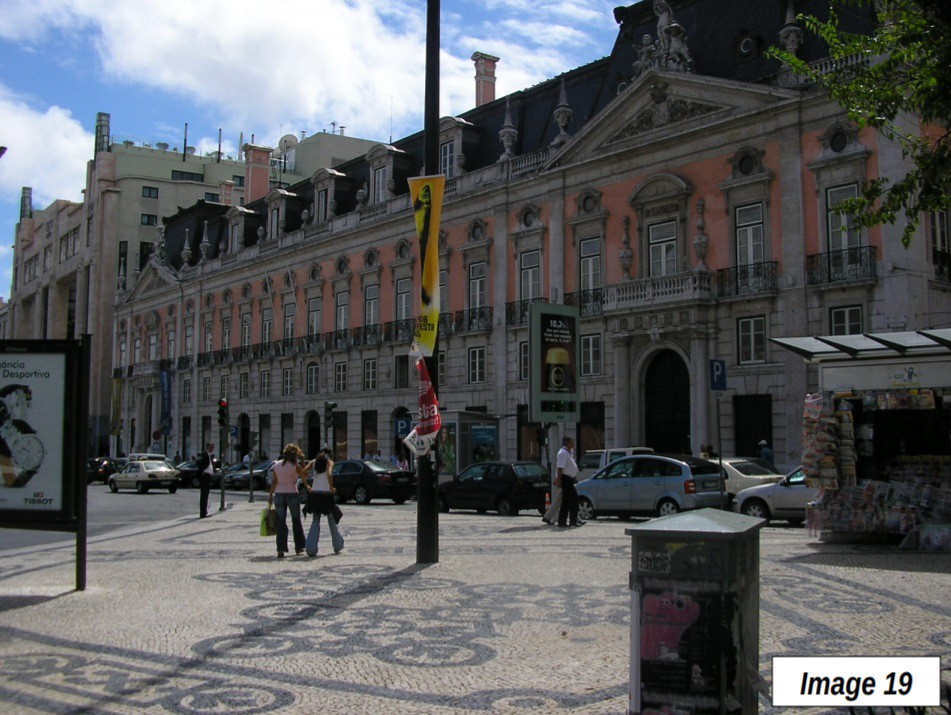
The municipality of Lisbon continues to have the dominant commercial (and tourist) center of the area. There are few tall buildings in Lisbon, which is typical for many urban cores in Europe. The municipality is built on a hill, with narrow streets and dominated by mid-rise buildings (Images 9-20).

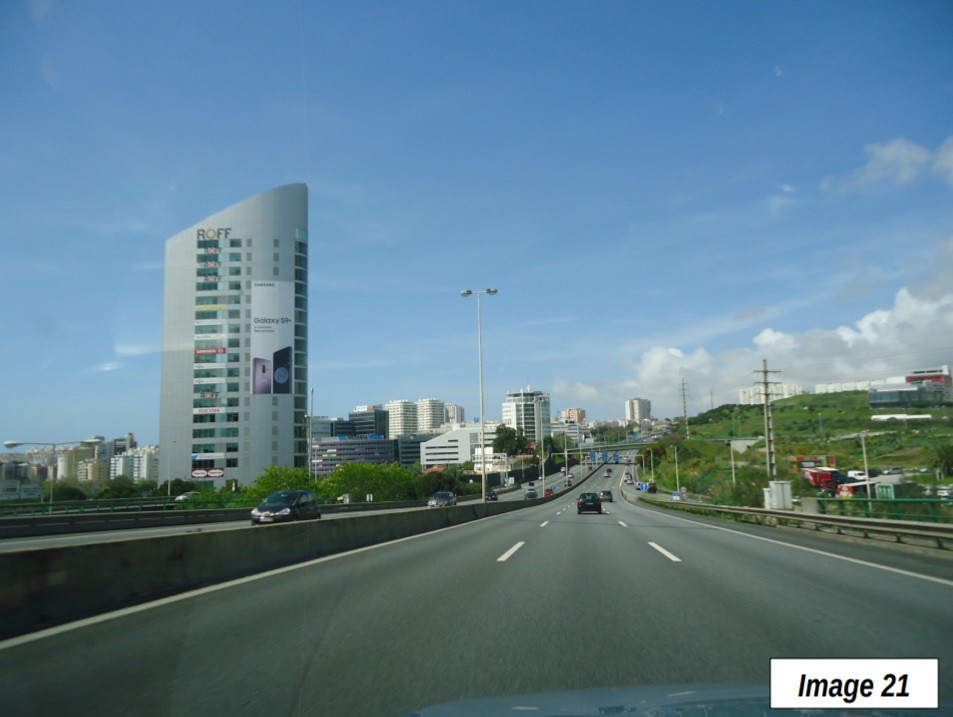
A large “edge city” type commercial center has developed along the I-5 motorway in Oeiras, west of Lisbon (Image 21). Joel Garreau coined the term “edge cities” to characterize the new urban centers, outside the old downtowns (central business district) that “contain all the function a city ever has, albeit in a spread-out form” where “little save villages or farmland lay only 30 years before.” (Edge City, Page 4). Garreau provides a detailed definition (See Note 2) and it seems likely that Oeiras meets the criteria. Some of the largest office buildings in the Lisbon area are located here, as well as large shopping centers.

Urban Motorways and Bridges

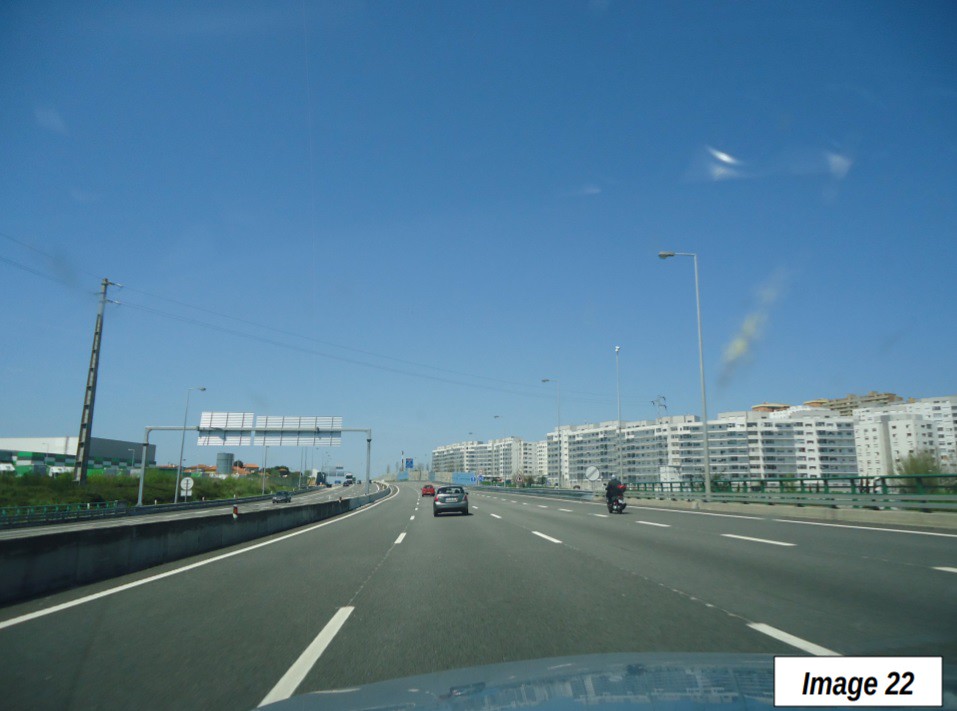
Lisbon has one of Europe’s better urban motorway (freeway) systems. Most of the roads in the Lisbon area are free, though there are tolls between the outer suburbs (such as Sintra and Setubal) and the inner suburbs (Images 22-24). With all of the water bodies in the area, the bridges are key. The first major bridge, the Ponte 25 de Abril (25th of April Bridge), opened in 1966 between the city of Lisbon and the suburbs to the south of the Tagus estuary (see photograph at the top). The bridge is named for the date of “Freedom Day,” which commemorates the overthrow of the authoritarian regime that governed Portugal from 1932 to 1974. When built, the Ponte 25 de Abril was the world's fifth longest suspension bridge. Until 1974, it was called the Salazar Bridge, after Antonio Salazar, who was the leader from 1932 to 1968 of the authoritarian government, which was overthrown by the "Carnation Revolution" in 1974.

The second major crossing was the Vasco de Gama bridge, opened in 1998, which connects the inner suburbs north of Lisbon to the western suburbs (Image 25). The Vasco de Gama (named for the first European to reach India by around the Cape of Good Hope in Africa) is one of Europe’s longer bridges, spanning 12 kilometers (7 miles).

The Suburbs and Beyond

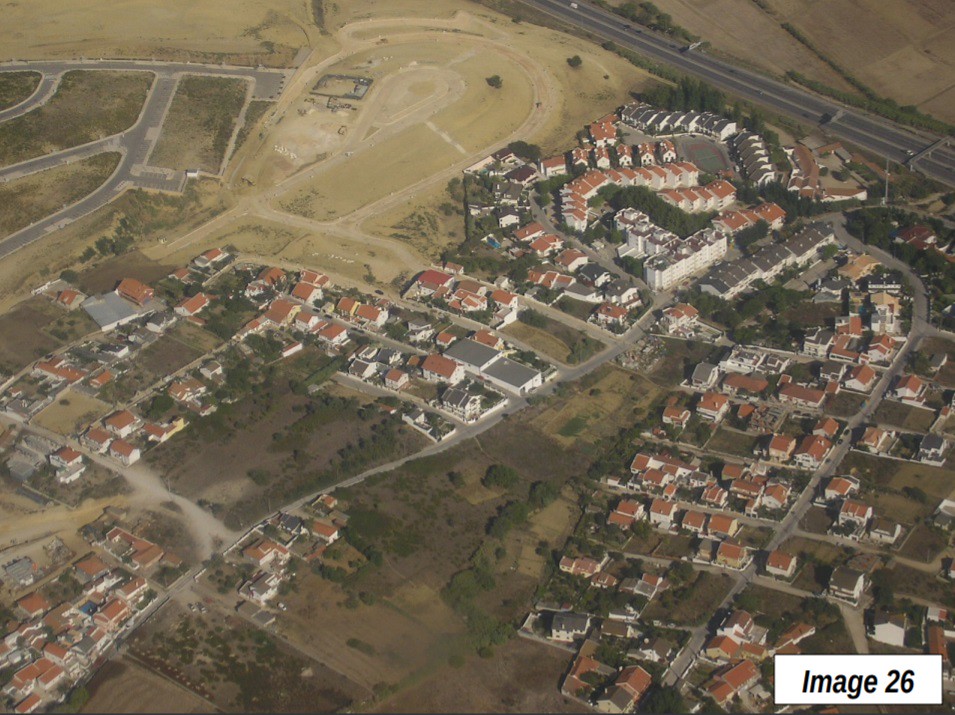
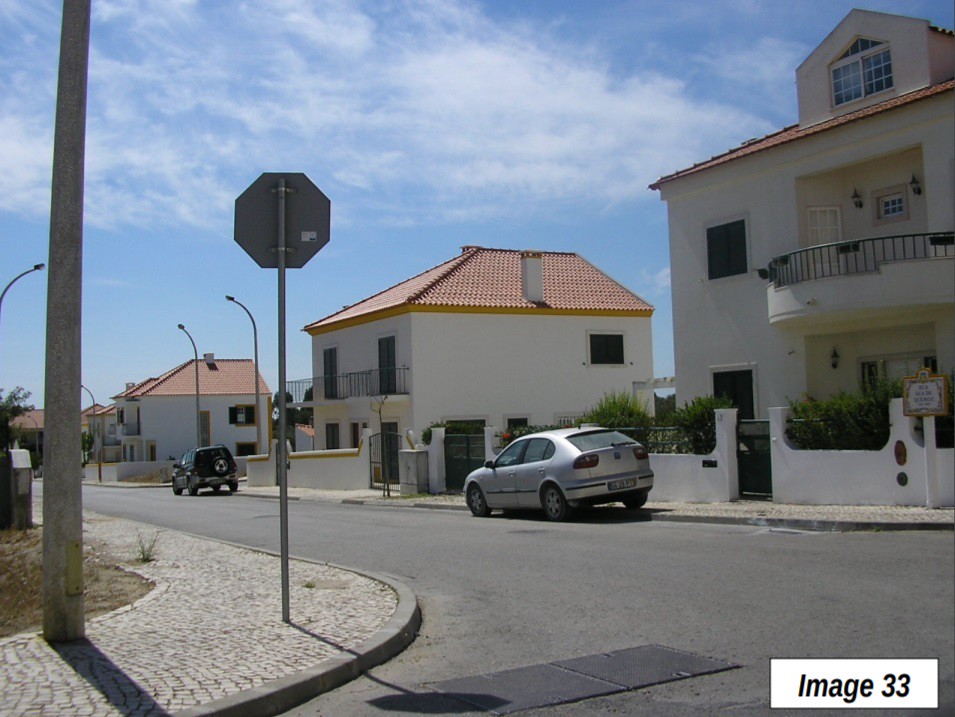
The suburbs of Lisbon contain a mix of detached, semi-detached (townhouse) and apartments. The pastel colors typical of single family houses gives Lisbon a distinctive look (Images 26-39).

Further, it is not necessary to travel very far to see stunning natural beauty. No more than three kilometers (two miles) beyond the western edge of the urban area (Cascais) on the north side of the Tagus estuary, there is a rugged Atlantic coastline with spectacular wave action (Images 40-42). Somewhat farther to the north and requiring a drive inland and over picturesque hills (Image 43) is Cabo de Roca, the westernmost extension of continental Europe into the Atlantic.

One of the World’s Picturesque Seacoast Cities

For some (including me), some of the most picturesque urban areas are located on the seacoasts, especially those where the water and the urbanization mix with one-another such as with bays, inlets and irregular coast lines. Rio de Janiero, Qingdao, Hong Kong, Seattle, Sydney, and Auckland are prime examples. Among such urban areas, San Francisco is one of the best examples, but so is Lisbon.

Note 1: Continuous urbanization in the Greater Toronto Area, the Los Angeles combined statistical area and the New York combined statistical area.

Note 2 (Edge Cities): Writing in the early 1990s, Garreau defines Edge Cities has having (1) More than 5 million square feet (465,000 square meters) of leasable space, (2) More than 600,000 square feet (56,000 square meters) of leasable retail space, has more jobs than bedrooms, (4) “is perceived by the population as one place” and (5) “was nothing like “city” as recently as 30 years ago.” Garreau further notes that each Edge City is larger than downtown Portland, Oregon or Tampa. His four principal examples were (1) the Route 128 corridor (now Interstate 95) in metropolitan Boston, (2) Schaumburg in metropolitan Chicago, (3) Perimeter Center in metropolitan Atlanta, and (4) Orange County’s Irvine in metropolitan Los Angeles (Page 5, Edge Cities).

Wendell Cox is principal of Demographia, an international public policy and demographics firm. He is a Senior Fellow of the Center for Opportunity Urbanism (US), Senior Fellow for Housing Affordability and Municipal Policy for the Frontier Centre for Public Policy (Canada), and a member of the Board of Advisors of the Center for Demographics and Policy at Chapman University (California). He is co-author of the "Demographia International Housing Affordability Survey" and author of "Demographia World Urban Areas" and "War on the Dream: How Anti-Sprawl Policy Threatens the Quality of Life." He was appointed to three terms on the Los Angeles County Transportation Commission, where he served with the leading city and county leadership as the only non-elected member. He served as a visiting professor at the Conservatoire National des Arts et Metiers, a national university in Paris.

Photograph: Ponte 25 de Abril (25th of April Bridge) from Monsanto (Lisbon) toward the southern suburbs, by author.

The New-McCarthyism Of Our Censorious Age

$
0
0

“If my thought dreams could be seen

They’d probably put my head in a guillotine” — Bob Dylan, “It’s All Right Ma”, 1965

We live in a newly censorious age, where old crudities are never forgotten. To be sure, there are some clear malefactors, like Harvey Weinstein and many others, who should be punished to the extent of the law, but there’s clearly a distinct danger to free expression as the emboldened thought police steadily expand their domain.

Often when people are young, they do stupid things, and say even stupider ones. Who reading this article has never said something off base, which has led to numerous dethronings among corporate executives, writers and editors? Time seems to heal no wounds anymore. “Guardians of the Galaxy” director James Gunn was fired for “off color jokes” made a decade ago; a recently removed judicial candidate was let go for somewhat intemperate things he said in college.

In the past we forgave former Klansmen — like Supreme Court Justice Hugo Black or West Virginia Senator Robert Byrd — allowing them to repent as racial progressives. Former socialists and Marxists reinvented themselves as neo-conservatives, often explaining their youthful views reflected past immaturity. Such forgiveness is not on the current media menu.

The new old-time religion

In the past the drive for censorship came largely from the right, led by the Catholic Church, which labored hard to impose their morality on films. Now, increasingly, the thought control comes largely from the left, whose allies control virtually all the institutions — media, universities, mainline churches, culture — that establish social norms.

We’ve gone a long way from the summer of love or the Berkeley “free speech” movement. The rules governing new Netflix productions forbid looking at anyone for more than five seconds, or asking for a phone number. As late night comedy tends to be homogeneous and preachy, you won’t likely see a Lenny Bruce or Rodney Dangerfield. Today if someone, like actor Mark Duplass, even suggests that conservatives might be something other than evil, they are forced to recant and grovel for forgiveness.

The left-McCarthyism on the campuses plays a critical role. The American Association of University Professors, once defenders of academic freedom, now rank among the most passionate defenders of “speech codes,” which now exist in at least half of all campuses. University Pennsylvania law professor Amy Wax was removed from her first year teaching duties, and asked to take a leave of absence for daring to assert the importance of “bourgeois culture” in making for successful lives.

This censorious mood is likely to gain in the coming years. Taking their cue from their teachers, a 2018 survey by Gallup and the Knight Foundation revealed a majority of students think protecting diversity is more important than free speech. Most, according to a 2017 Brookings Institution study, did not understand that the Constitution protects even hateful speech.

Social media makes things worse

The authoritarian trend has been exacerbated by the decline of journalism. As the distinction between opinion and reporting has blurred, the progressive take on news takes on the character of holy writ. On some issues, such as climate change, even mild skepticism is intentionally banished. Some greens actually see the state-controlled Chinese media, where climate skepticism of any kind does not exist, as an aspirational model.

Sadly, the internet — despite its initial low cost of entry — has not done much to broaden discussion. A handful of firms, mostly in Silicon Valley, have gained almost total control of both digital news and advertising cash. News on the internet, notes the BBC, is increasingly shaped by “confirmation bias,” increasingly on the left, appealing to ideologically outraged clickers.

Under pressure from “woke” progressive advocacy groups, reports Vice, the internet grandees — Google, Amazon, Apple, Microsoft, Twitter and Facebook — increasingly “shadow ban” conservative sources. Youtube, for example, recently banned the obnoxious and marginally truthful Infowars, but allows access to the ravings of Antifa militants or the hideous racist, anti-Semite Louis Farrakhan.

An issue beyond politics

Some conservatives see such censorious behavior revealing the hidden fascism of the progressive left, but what the right would do if they, not their political enemies, dominated the means of communication? The real issue is not politics but declining literacy and civility that gets in the way of serious analysis and debate.

At a time that even the ACLU seems to have lost interest in protecting politically incorrect speech, the prospects for free thought seem less than encouraging. With leading opinion-shaping institutions turning themselves into a modern day Star Chambers, people may be well-advised to not express opinions that could cost their reputation or their job.

Writing in 1913 the historian J. B. Bury described the Middle Ages as a place where “a large field … covered by beliefs which authority claimed to impose as true, and reason was warned off the ground.” The current censorious mood, despite its attempt to portray itself as progressive, seems more akin to an unwelcome regression to an ugly, and dogma-plagued, past.

This piece originally appeared in The Orange County Register.

Joel Kotkin is executive editor of NewGeography.com. He is the Roger Hobbs Distinguished Fellow in Urban Studies at Chapman University and executive director of the Houston-based Center for Opportunity Urbanism. His newest book is The Human City: Urbanism for the rest of us. He is also author of The New Class ConflictThe City: A Global History, and The Next Hundred Million: America in 2050. He lives in Orange County, CA.

Photo: Gage Skidmore [CC BY-SA 3.0 ], from Wikimedia Commons

If New Zealand is to crack the problems of unaffordable housing, government here must look seriously at how the better parts of

$
0
0

This seems about the worst possible month to be suggesting that anybody should try to emulate anything going on in America. The place seems to be going mad in ways no longer funny to laugh at from very far away.

So it’s a bit of a shame that the best lessons on infrastructure financing and affordable housing come from a few places in the United States that have really figured things out. If the exact same lessons had come from Canada, or the UK, or Estonia, Infrastructure New Zealand would have an easier time marketing its latest report.

If New Zealand is going to crack the problems of unaffordable housing, government here is going to have to look seriously at how the better parts of America finance infrastructure. Within the same country, you can find major urban areas like San Francisco that are as unaffordable as Auckland, others like Atlanta, or Houston, where housing remains very affordable – and plenty in-between.

In April, an Infrastructure New Zealand delegation visited Portland, Denver, Dallas-Fort Worth, Houston and San Francisco. Their report, “Enabling City Growth: Lessons from the USA”, was released last week.

America provides a wonderful policy laboratory for state-level and city-level innovation. Where fifty different states can each try different things, and cities within those states also can experiment, the rest of us can learn what works.

There are two kinds of affordable cities in America. The first are places where population has been declining. Houses can last for a long time after an industry has left, and so it is easy to live like a king in Detroit – with all that entails. Mediaeval kings could afford expansive estates but also needed strong security forces.

It’s the second kind of affordable city from which New Zealand really can learn – the cities that have managed to get things right when population grows.

When a city’s population grows, there are three potential outcomes – or a mix of those three. The city can grow upwards with increased density, it can grow outwards with more subdivisions, or it can see rising house prices. The best combination allows cities to grow both up and out, allowing for stable and affordable housing.

America has cities exemplifying all of these options.

And America’s growing but affordable cities are the ones that have got the incentives right. When Councils see population growth as a source of new revenue, and where the costs of new infrastructure can be apportioned correctly, Councils allow growth.

Infrastructure New Zealand points to the use of special tax districts and revenue bonds as key to unlocking better urban growth.

In addition to the guaranteed-by-ratepayers Council debt used in New Zealand, America finances urban growth through debt that is not guaranteed by general ratepayers. The latter ironically enables far more finance because it is free of interference by politicians.

Think about a council like Auckland or Hamilton, where debt-to-revenue limits of 250% are close to binding. Under those limits, a Council wanting to fund a new infrastructure project cannot borrow more than 2.5 times the annual revenue expected from the project. But Infrastructure lasts for decades.

Revenue bonds and special tax districts enable borrowing that is not guaranteed by the general ratings base and can then fall outside of the Council’s debt limit. American revenue bonds enable borrowing of five or six times the annual revenue associated with an infrastructure project.

When a developer wants to build a new subdivision or co-fund a mass transit project to service a new brownfield terraced housing development, the trunk infrastructure can be funded through levies on the future residents of the development to repay the revenue bond.

America has established a strong track record with revenue bonds. They can work where everyone expects that Councils will never bail out a bond that goes into default. In Florida during the Global Financial Crisis, some $4 billion in special district bonds defaulted yet not one government jurisdiction bailed them out nor suffered credit downgrades. If ratings agencies expect that revenue bond holders have moral or legal recourse to a council in the event of default, the bond is counted as the Council’s guaranteed debt. If there’s a sniff of this tipping the council over its tight debt-to-revenue limits, it will be blocked. Auckland’s Watercare suffers this fate.

When the infrastructure costs of growth mostly fall on new residents, rather than on the city as a whole, cities have fewer reasons to block growth. And where cities see a growing population as a growing revenue base for a better city, rather than as a burden, they start competing for residents.

Infrastructure New Zealand also correctly points out how restrictions on suburban growth drive up land prices for the city as a whole. Policies that dribble land out in phased releases encourage land banking. And the price of development at the city’s fringes are what constrain the price of housing in the inner suburbs. Fixing infrastructure financing and the incentives facing councils can allow cities to grow both up and out, restoring housing affordability.

The prior National government took the first tiny steps towards unlocking urban growth with central infrastructure funding vehicles to get infrastructure debt off of council books, but that cannot be a long term solution. Revenue bonds allow infrastructure to be rolled out when it’s needed, rather than having to wait until a decade-long crisis forces central government to act.

But it will take some work to get there.

I earlier wrote about how charge-over rates mean that Council debt is a lot like a mortgage on your house. If Council doesn’t meet its debt obligations, then a charge can be levied against your property to cover the bill – and your house sold, if need be. This gold-plated guarantee benefits lenders by reducing risk and borrowers by reducing interest costs. But it costs property owners – it is a bit like forcing them to guarantee other people’s kids’ mortgages. It exacerbates the insider/outsider problem and voters’ antipathy to growth.

Establishing the credibility to not guarantee project debts is difficult. Local government needs to change its self-defeating mindset around debt. By guaranteeing debt to lower borrowing costs, it paradoxically prevents borrowing. Not guaranteeing project debt may mean higher cost of borrowing, but it unblocks investment to projects that create value. It’s yet another example of Infrastructure NZ’s claim local government is biased to cost-minimising rather than value-maximising. Central government could consider banning local government from bailing out failed revenue bonds, if it wanted to help out.

We might also consider an even more localist turn. Instead of amalgamating cities into ever larger monopolies, why not reverse things while encouraging towns to cooperate in delivering shared services? If a failed revenue bond is small relative to a Council’s overall revenues in a large city, we might expect bailouts. Smaller councils would be less likely to be able to afford bailouts.

America is getting a lot of things wrong. But parts of America provide important lessons in improving housing affordability. It’s time we start applying those lessons here.

This piece originally appeared on www.interest.co.nz.

Eric Crampton is chief economist at The New Zealand Initiative, which provides a fortnightly column for interest.co.nz.

Photo: Jon Sullivan, via Flickr, using CC License.

Midwest Cities Are Not on the Radar for Migrants

$
0
0

The Midwest is simply not in the picture when it comes to migration nationally. Even its best performing regions are often migration losers with the rest of the country.

Columbus, Indianapolis, and Minneapolis-St. Paul all have growing populations, and basically healthy economies. Yet all of them are have net migration losses with the country when you look only at migration from out of state.

The chart above is metro area migration as reported by the IRS county to county data, aggregated to the appropriate levels.

All of these cities are actually doing worse in net out of state migration than they were during the 1990s. Indy had traditionally had a modest draw from out of state, but that’s turned negative recently. By contrast, Columbus has started climbing out of a hole. This may be one factor underlying overall demographic trends in those cities. Minneapolis-St. Paul is frequently touted nationally for hits high end economy and progressive policies, but is a loser here. (For MSP, I define out of state as non-Minnesota)

This could be driven by changes in in-migration or out-migration or both. So I pulled a quick analysis of out-of-state in-migration only for Indy and Columbus (which are comparable in size). Here’s that chart:

The IRS changed their methodology in 2014 such that they report fewer records (for privacy purposes I believe). So the post-2013 period is not comparable. What we see here is a pretty stable level of in-migration with an actual peak up around 2011-2013. If I were looking for good news, that it where it would be. Interestingly, Columbus slightly out draws Indy from out of state on a pure in-migration basis. (Both cities draw as many or more in-migrants from in-state as they do from all other states combined).

One case I find particularly of interest is California. California has significant net out-migration and many cities, including places Portland and Nashville have been feasting off the California exodus. (California is actually the #2 net exporter of people to Nashville after the rest of Tennessee). Here are how our three cities fare with California net migration.

Again, all three are presently losers. And again they did better in the 90s (when Southern California in particular got slammed by the peace dividend). With California’s sky high housing prices and large scale net out-migration, the fact that these Midwest regions are actually losing people to California, even if a small number in Indy, is quite a feat.

Now, migration loss to California is not necessarily bad. Depending on what’s going on, it could even be a good thing in the long run. If people are heading West to work in the tech industry, for example, that’s a form of up-skilling local residents, and even if they never return can build critical networks to Silicon Valley. Still, with the conditions so favorable for attracting California migrants and places like Austin and Nashville sucking in lots of them, I consider these Midwest city figures a negative indicator.

I consider these numbers sobering news for these Midwest regions, and probably all the rest of them I didn’t look at as well, except possibly Chicago.

In case you are wondering about in-state migration, here’s a chart of Indy and Columbus. You can see both have been feasting off in-state migration, and they have nearly identical charts.

Minneapolis actually gets more of its in-migration from Wisconsin and Illinois than from Minnesota, probably because it has such a high percentage of the state’s population already and also is on a border and includes some Wisconsin counties in its metro area. So I exclude it from this chart. But this is also a good reminder that for all of these places, “out of state” includes next door neighbors, which account for a large share of out of state in-migration.

This is only a blog post and looks mostly at the net migration. To get a more actionable sense of what’s going on, these regions should look at both in and out migration by origin and destination to see what’s happening at a granular level.

This piece originally appeared on Urbanophile.

Aaron M. Renn is a senior fellow at the Manhattan Institute, a contributing editor of City Journal, and an economic development columnist for Governing magazine. He focuses on ways to help America’s cities thrive in an ever more complex, competitive, globalized, and diverse twenty-first century. During Renn’s 15-year career in management and technology consulting, he was a partner at Accenture and held several technology strategy roles and directed multimillion-dollar global technology implementations. He has contributed to The Guardian, Forbes.com, and numerous other publications. Renn holds a B.S. from Indiana University, where he coauthored an early social-networking platform in 1991.

Photo: Postdlf (Digital photo by Postdlf) [CC BY-SA 3.0 ], via Wikimedia Commons

The Dispersed City

$
0
0

Planners and journalists are often uneasy about suburban development, wondering how people will get to work in the center from more distant locations. They needn’t worry. Only a relatively small percentage of people work in the center (generally less than 10 percent). Indeed the residential employment dispersion in American metropolitan areas has been a major factor in keeping work trip travel times among the shortest in the world.

In a ground breaking 2007 research paper, economists Bumsoo Lee and Peter Gordon cited William T. Bogart, now president of Maryville College (Tennessee), to dismiss the pervasive idea in planning, media and academic circles that American metropolitan areas (cities in their economic or functional form) still exhibit the monocentric form that ceased to be long ago.

“A fundamental misunderstanding of how metropolitan areas work has hampered the current debate on the causes and consequences of urban sprawl. This misunderstanding is analogous to the pre-Copernican fallacy that the earth is the center of the universe, and everything revolves around the earth. In the discussion of urban sprawl, the downtown or central city takes the place of the earth in the Ptolemaic cosmology, and the rest of the metropolitan area is defined only in relation to the downtown.”

In their research, Lee and Gordon showed that as early as 2000, no major metropolitan area (over 1 million population) in the United States had a monocentric employment pattern. Indeed, they showed that US metropolitan areas were already more polycentric than monocentric. That includes New York, where more than 75 percent of employment was outside the monocentric core (the central business district or CBD) and other major subcenters.

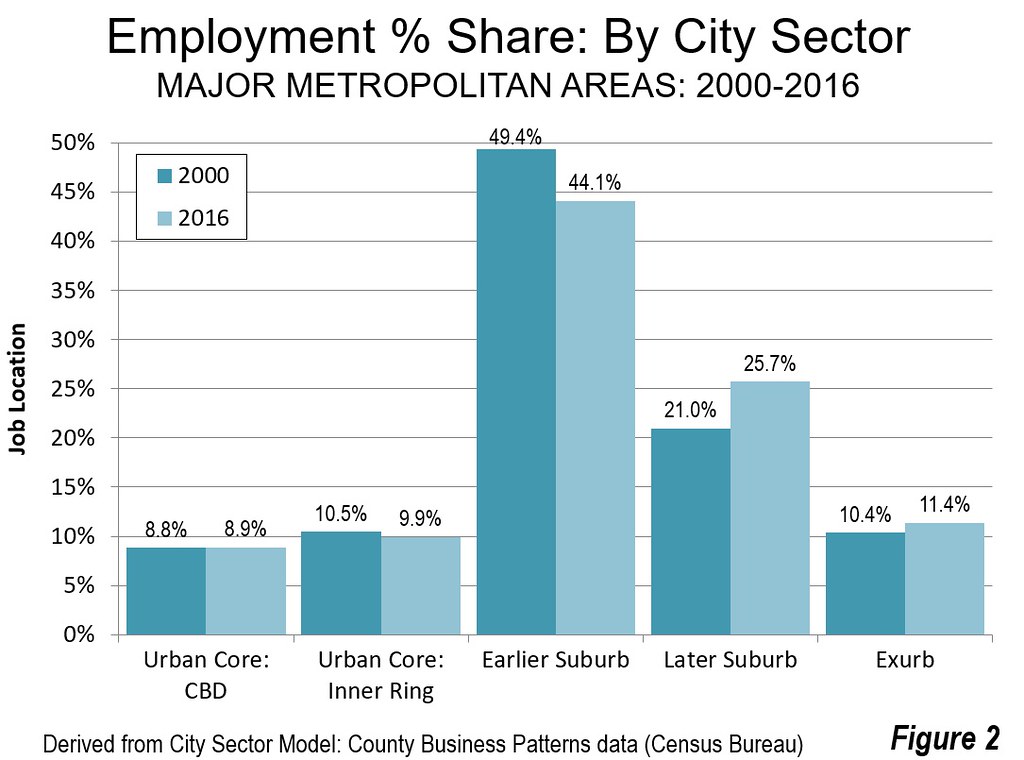
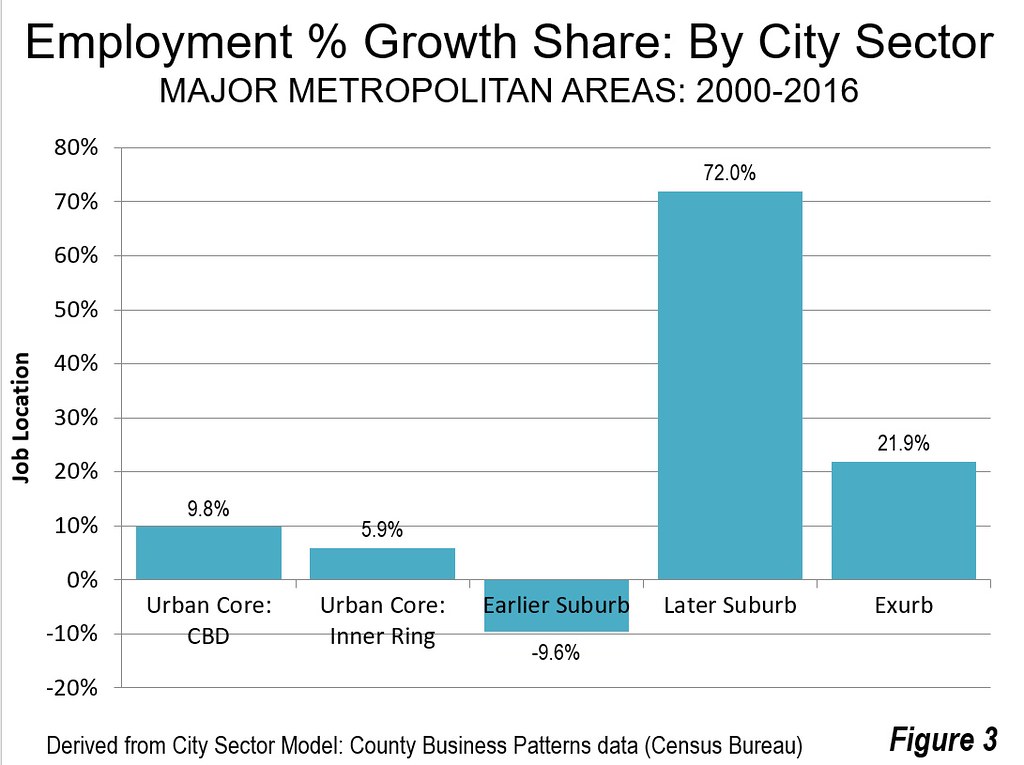
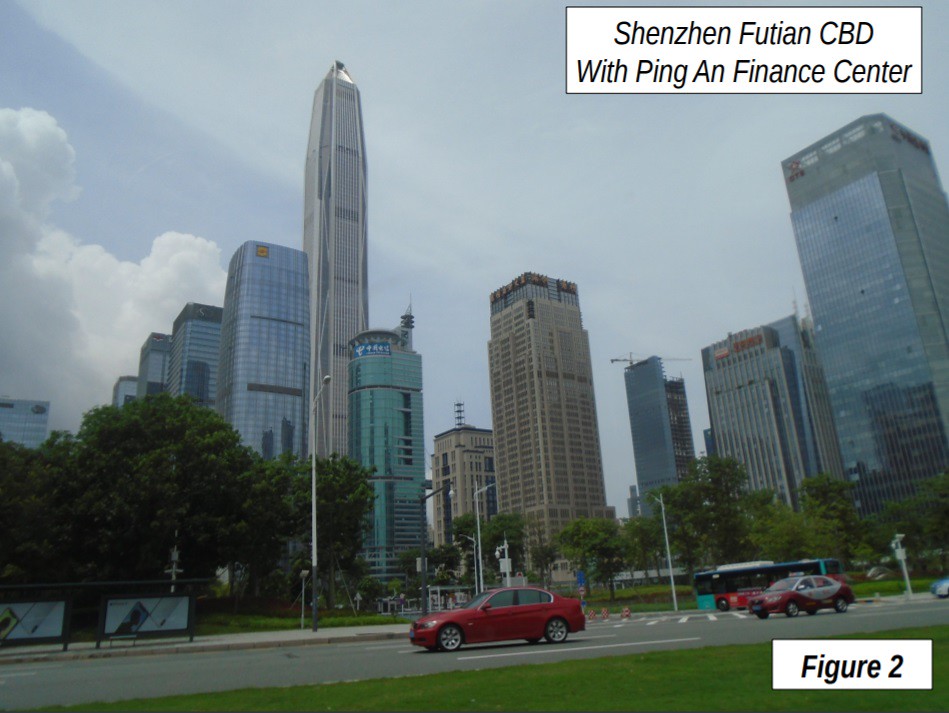
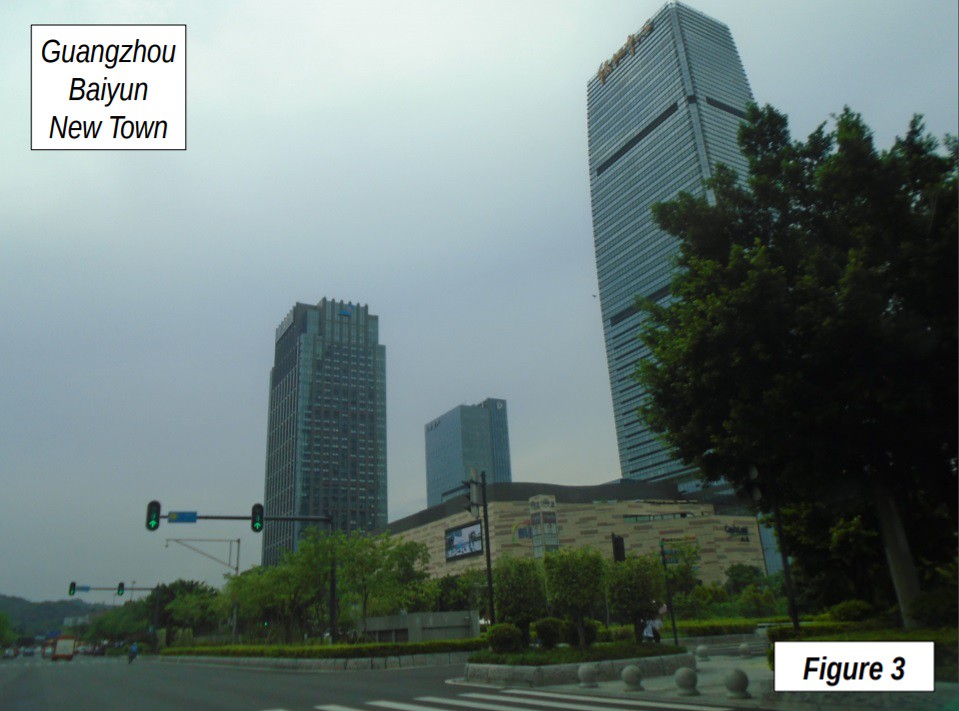
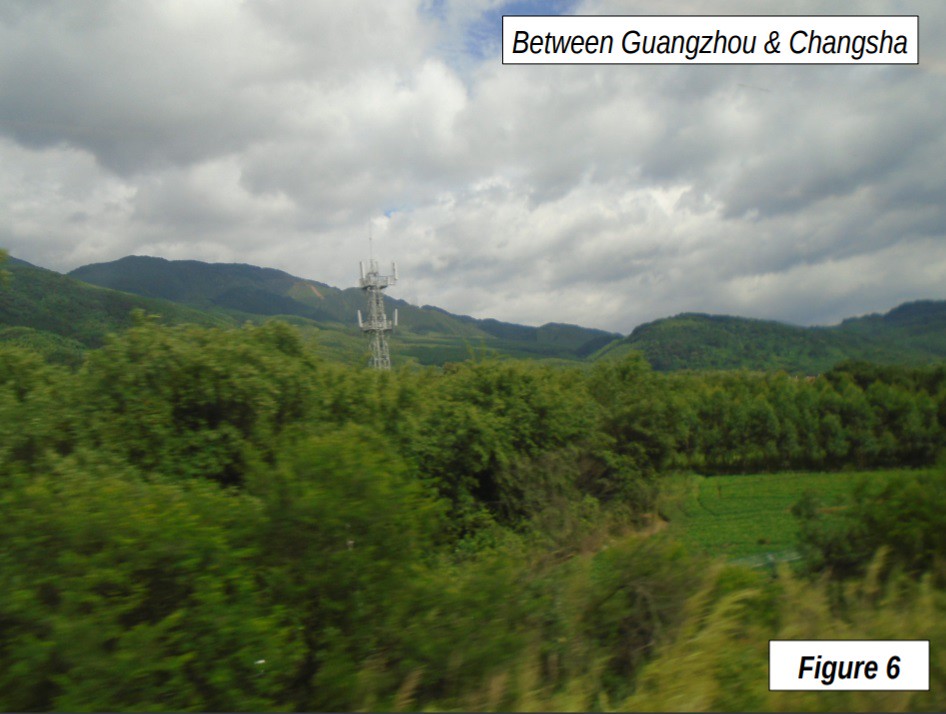
But the real momentum is beyond polycentrism, to dispersal outside of even suburban business centers. (Figure 1). Earlier, Gordon and Harry Richardson showed that Los Angeles had left polycentricity behind for a dispersed urban form by 1990. Although the Lee and Gordon research has not been updated, the most recent Census Bureau County Business Patterns data shows that 94 percent of new employment has been located in two outer sectors (Later Suburbs & Exurbs) since 2000 (Figures 2 & 3).

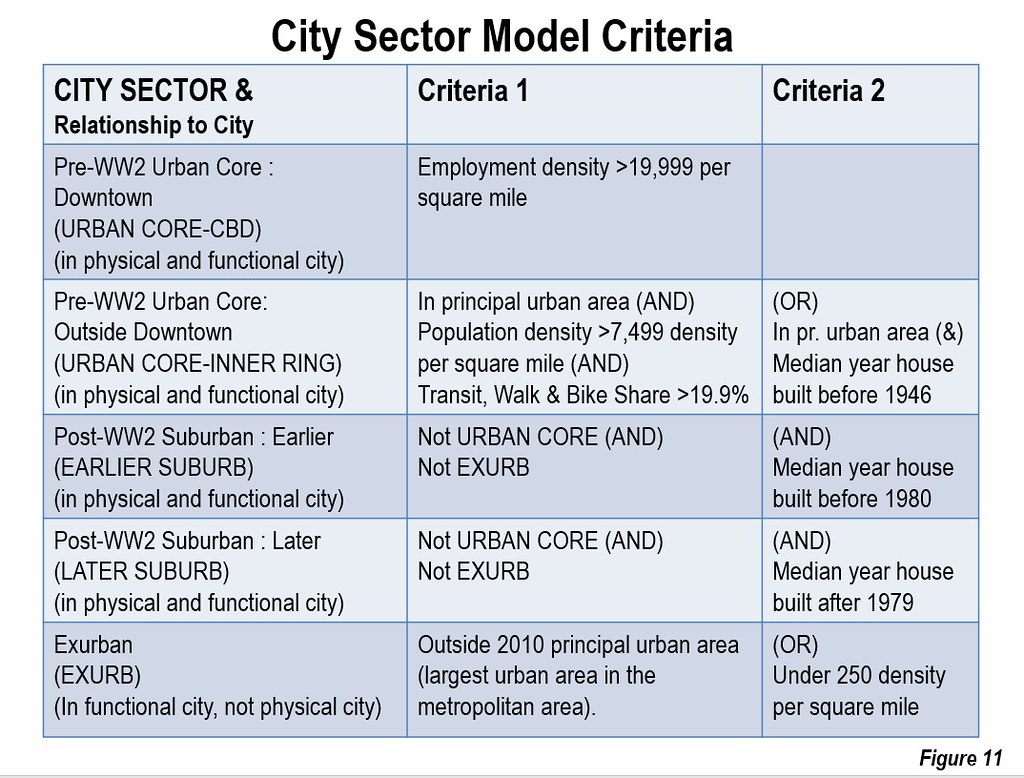
This analysis uses the City Sector Model and American Community Survey (2012-2016) to estimate average work trip travel times for 2016 for sectors within major metropolitan areas (See Note and Figure 11). This demonstrates that across the entire US metropolitan area, average one-way work trip travel times are around 30 minutes or less.

Evenly Dispersed Residences & Employment

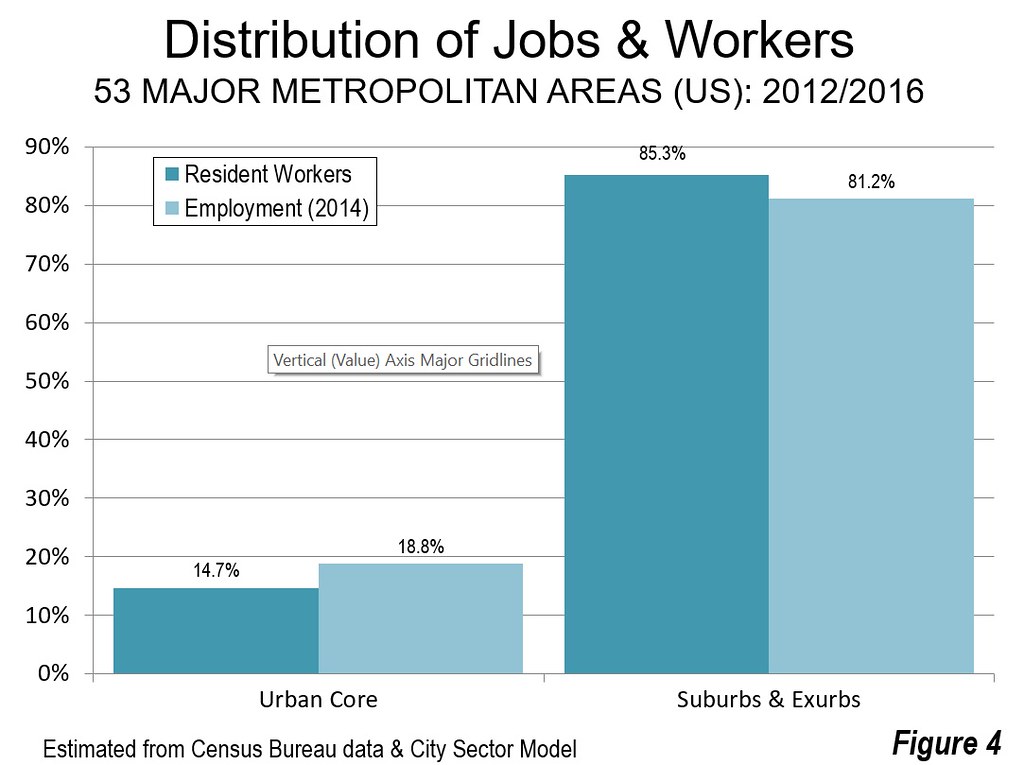
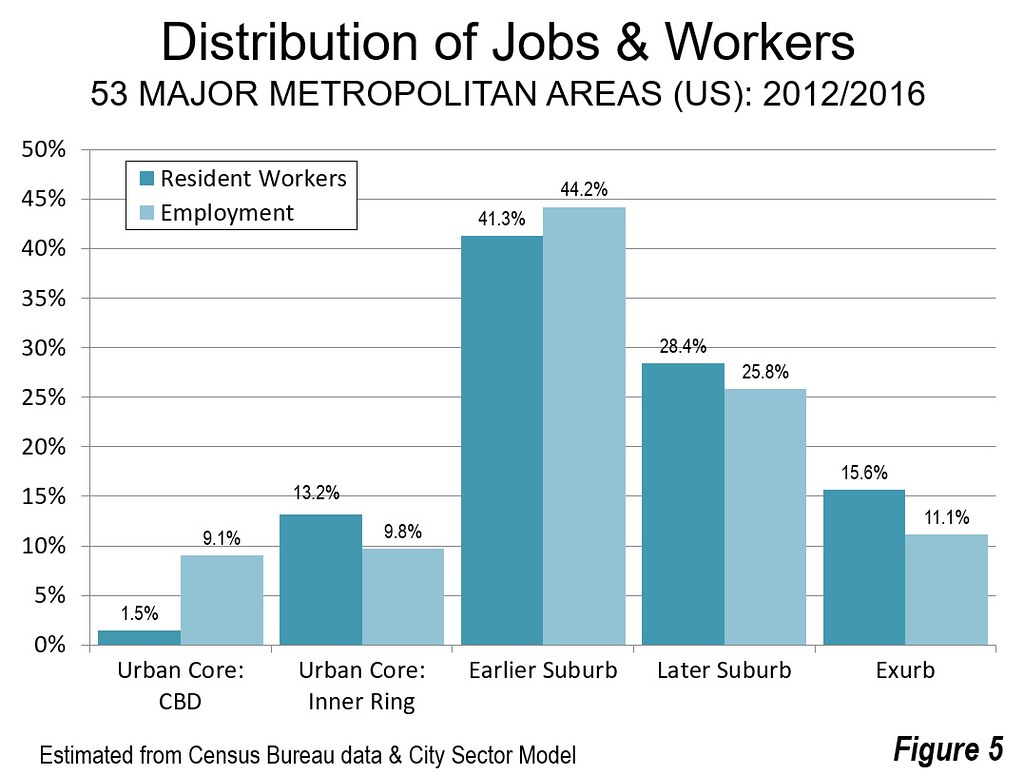
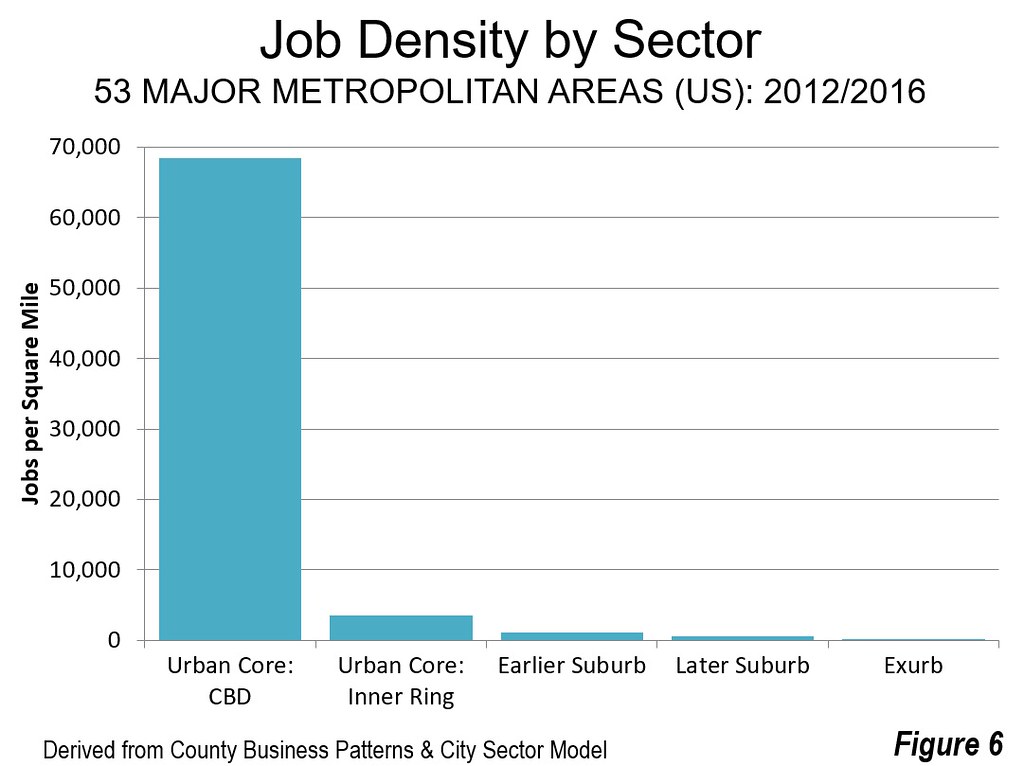
Jobs and resident workers are relatively balanced in US metropolitan areas. In the suburbs and exurbs, there are 0.95 jobs per resident worker, and 1.28 resident jobs per resident workers in the Urban Core (Figure 4). This figure, however, masks the distorted ratio in the Urban Core CBD, which has by far the highest employment density of any sector, nearly 20 times that of the second densest sector (Urban Core: Inner Ring) and 60 times that of the Earlier Suburbs, which have nearly five times as many jobs (Figure 6). Yet despite its extreme concentration of employment, the Urban Core: CBD still only represents less than 10 percent of overall employment.

Travel Times

This dispersion works to the advantage of commuters, whose travel times are remarkably similar throughout metropolitan areas.

Overall, suburban and exurban commuters have faster travel times (28.1 minutes) on average to work than those living (Figure 7) in the urban cores (32.7 minutes). The greatest disparities are in the largest metropolitan areas, such as in New York, Los Angeles, Chicago, and Philadelphia where urban core commuters travel for much longer to get to work, (Table). Nonetheless, in many other metropolitan areas, urban ore residents have quicker work trip travel time than those in the suburbs and exurbs. Overwhelmingly, these are where there is greater auto use (cars have quicker work trips, see below), together with low enough densities to limit traffic congestion.

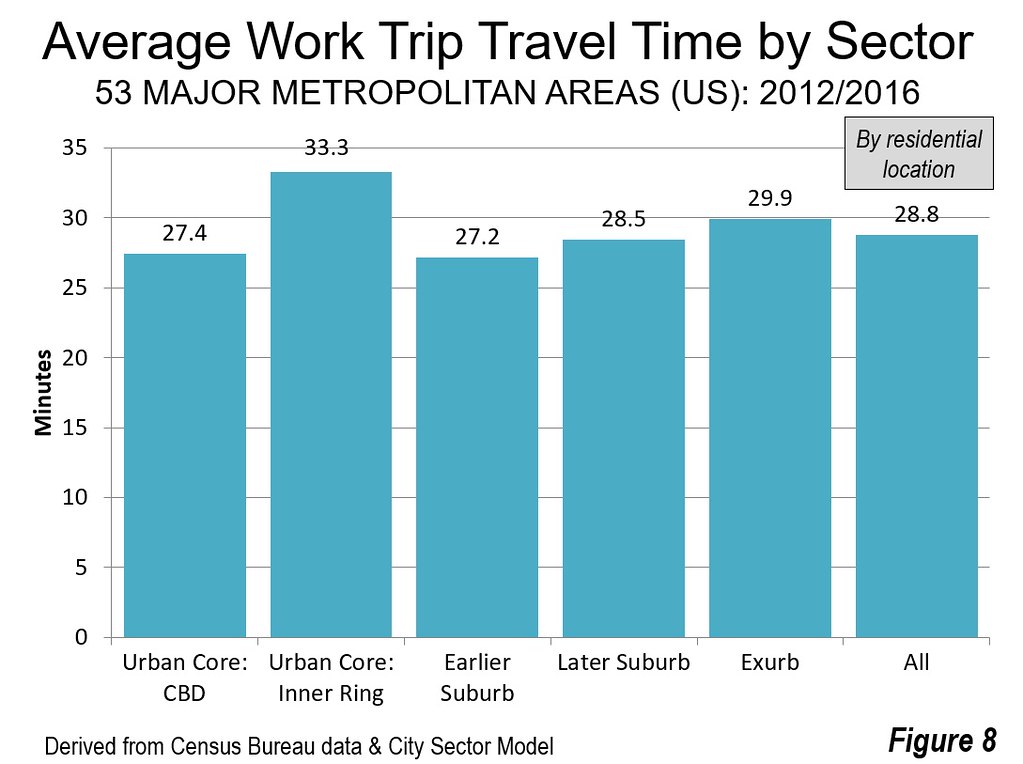
The finer grained sectoral analysis shows that workers living in the Earlier Suburbs have the shortest commutes, at 27.2 minutes. Those living in the Urban Core: CBD have the second shortest travel times, at 27.4 minutes (Figure 8). Neither of these results are surprising. The Earlier suburbs are more accessible to the rest of the city, since they are closer to the four other sectors and they have the most jobs. The shorter travel times of the Urban Core: CBD make the chances of finding suitable employment that can be reached more quickly, with six times as many jobs as workers. Obviously, this cannot be replicated throughout the metropolitan area, since by definition, labor markets have about the same number of jobs and employed workers.

The longest travel time among the five sectors is in the Urban Core: Inner Ring, at 33.3 minutes. The outer two sectors, the Later Suburbs and the Exurbs have travel times of 28.5 minutes and 29.9 minutes, close to the average of 28.8 minutes. This demonstrates the effectiveness of automobile oriented residential and employment density in keeping travel times down. It is worth noting that more dense international cities, that are the most dependent on transit, tend to suffer longer commuting times, such as Hong Kong and Tokyo.

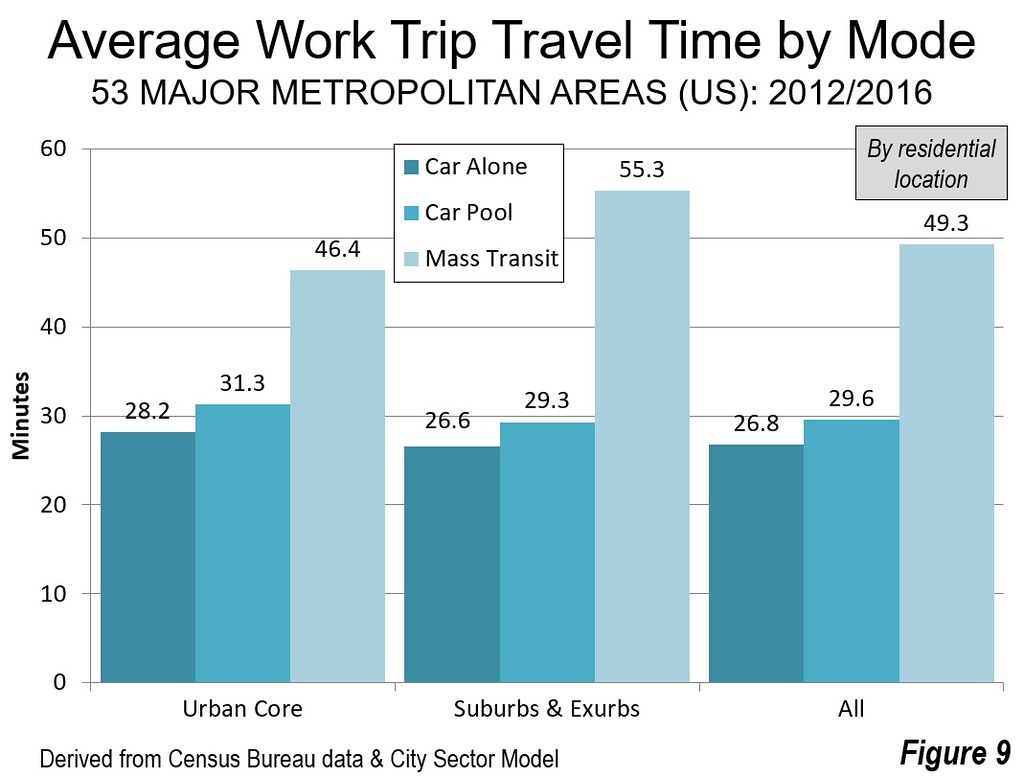
Among the largest commuting modes (excluding working at home with its commute time of zero), driving alone takes the least time, averaging 28.2 minutes for urban core residents and 26.6 minutes for suburban and exurban residents. In both cases, car pools travel about three minutes longer. Transit takes much longer, 46.4 minutes for urban core residents and 55.3 minutes for suburban and exurban residents (Figure 9). Among the five sectors, there is little difference in commuting times for those who drive along or are in car pools.

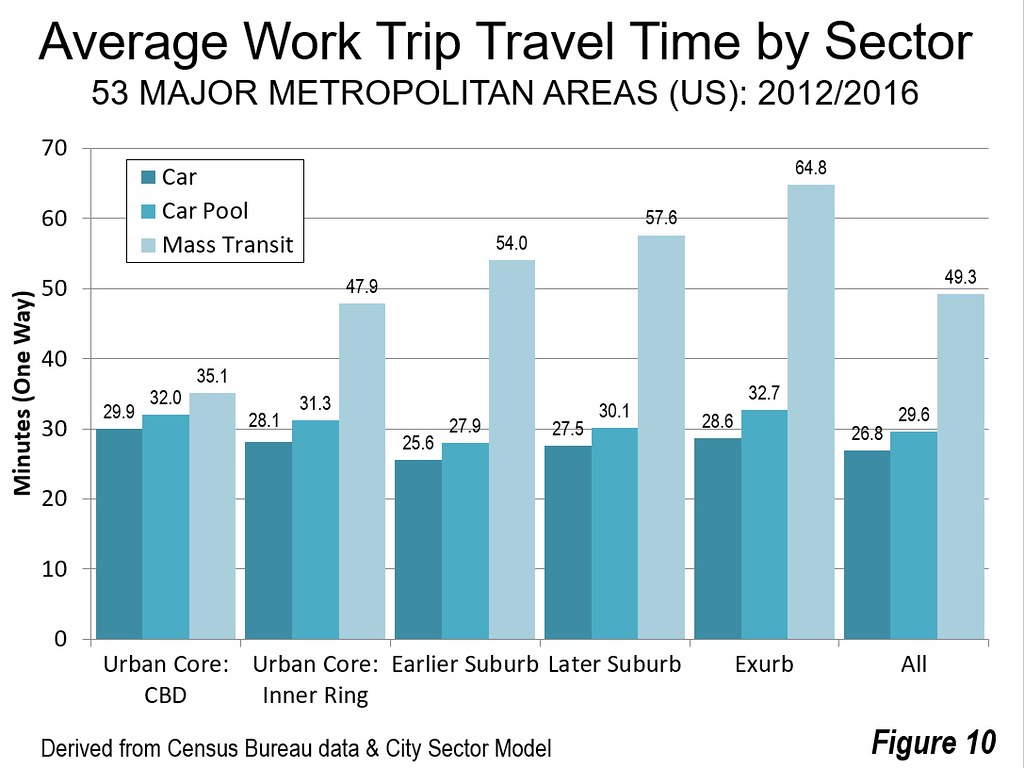
Transit travel times rise rapidly as distances increase from the CBD (Figure 10). This is to be expected, since transit systems are necessarily designed principally to serve the CBDs, where employment densities are high enough to justify frequent service, despite massive subsidies. Elsewhere in the metropolitan area, that is simply not the case, with automobiles providing access to more than 60 times as many jobs in 30 minutes as transit in the major metropolitan areas (see: “Focusing on Mobility, Not Travel Mode for Better Economic Growth”). With this kind of disparity, it is not hard to understand why automobiles dominate travel in the modern city.

Maintaining Quicker Travel Times

Yet, for decades, transit promoters have claimed that much more transit spending would reduce traffic congestion. This just has not happened. Perhaps the starkest example is Los Angeles County, which has seen driving and working at home capture 99 percent of the nearly 350,000 new daily commutes over the last decade (according to American Community Survey data), and an overall drop in transit commuting, despite a Herculean pace of new rail and busway openings. Yet, quick work trip travel times remain integral to improved economic performance. Continuing dedication and efforts to provide sufficient roadway capacity are needed to “keep the traffic moving”, perhaps with the aid of new technologies such as ride-hailing and, down the road, autonomous vehicles.

Note: The City Sector Model classifies small areas based upon their urban characteristics, with two urban core sectors (Urban Core: CBD and Urban Core: Inner Ring) having higher population densities, and greater dependence on transit, walking and cycling. The three other sectors, Earlier Suburbs, Later Suburbs and Exurbs are more automobile oriented and tend to have the suburban forms that have dominated development since World War II. City Sector Model analysis provides results that are far more accurate in measuring urban cores versus suburban and exurban development than using municipal boundaries, since the most of the core municipalities have the majority of their population in areas with suburban and exurban characteristics and none is 100 percent urban core. For example, even in the city of New York, much of Staten Island is at least as suburban as the adjacent New Jersey suburbs).

Photograph: Los Angeles Urban Area Freeway (densest large urban area in the United States), by author


AVERAGE WORK TRIIP TRAVEL TIMES: 2016
US Major Metropolitan Areas
Major Metropolitan AreaUrban CoreSuburbs & ExurbsEntire MSA
 Atlanta, GA 21.831.0        31.0
 Austin, TX 17.126.6        26.4
 Baltimore, MD 29.830.6        30.5
 Birmingham, AL 26.0        26.0
 Boston, MA-NH 29.831.1        30.6
 Buffalo, NY 20.421.6        21.3
 Charlotte, NC-SC 26.3        26.3
 Chicago, IL-IN-WI 33.530.6        31.3
 Cincinnati, OH-KY-IN 20.925.0        24.6
 Cleveland, OH 24.024.8        24.6
 Columbus, OH 19.023.7        23.5
 Dallas-Fort Worth, TX 23.127.8        27.8
 Denver, CO 22.927.5        27.3
 Detroit,  MI 26.426.7        26.7
 Grand Rapids, MI 19.922.0        21.9
 Hartford, CT 22.124.0        23.8
 Houston, TX 19.929.5        29.4
 Indianapolis. IN 22.624.9        24.8
 Jacksonville, FL 26.3        26.3
 Kansas City, MO-KS 19.923.1        22.9
 Las Vegas, NV 26.324.3        24.4
 Los Angeles, CA 31.029.5        29.6
 Louisville, KY-IN 21.623.9        23.7
 Memphis, TN-MS-AR 19.524.1        24.0
 Miami, FL 26.628.6        28.5
 Milwaukee,WI 21.923.5        23.2
 Minneapolis-St. Paul, MN-WI 22.525.6        25.2
 Nashville, TN 14.627.1        27.1
 New Orleans. LA 20.526.4        25.7
 New York, NY-NJ-PA 38.932.6        35.9
 Oklahoma City, OK 16.422.6        22.4
 Orlando, FL 27.9        27.9
 Philadelphia, PA-NJ-DE-MD 32.228.3        29.2
 Phoenix, AZ 26.0        26.0
 Pittsburgh, PA 24.726.9        26.5
 Portland, OR-WA 24.026.4        26.1
 Providence, RI-MA 23.426.3        25.6
 Raleigh, NC 25.3        25.3
 Richmond, VA 19.225.4        25.1
 Riverside-San Bernardino, CA 31.8        31.8
 Rochester, NY 19.721.4        21.2
 Sacramento, CA 21.826.4        26.3
 St. Louis,, MO-IL 23.125.8        25.5
 Salt Lake City, UT 18.822.7        22.5
 San Antonio, TX 17.125.7        25.6
 San Diego, CA 22.325.4        25.3
 San Francisco-Oakland, CA 31.732.4        32.2
 San Jose, CA 21.127.3        27.3
 Seattle, WA 25.430.2        29.6
 Tampa-St. Petersburg, FL 26.7        26.7
 Tucson, AZ 24.3        24.3
 Virginia Beach-Norfolk, VA-NC 18.924.2        24.1
 Washington, DC-VA-MD-WV 30.635.3        34.4
 TOTAL 32.728.1        28.8
Derived from American Community Survey, 2016.


Wendell Cox is principal of Demographia, an international public policy and demographics firm. He is a Senior Fellow of the Center for Opportunity Urbanism (US), Senior Fellow for Housing Affordability and Municipal Policy for the Frontier Centre for Public Policy (Canada), and a member of the Board of Advisors of the Center for Demographics and Policy at Chapman University (California). He is co-author of the "Demographia International Housing Affordability Survey" and author of "Demographia World Urban Areas" and "War on the Dream: How Anti-Sprawl Policy Threatens the Quality of Life." He was appointed to three terms on the Los Angeles County Transportation Commission, where he served with the leading city and county leadership as the only non-elected member. He served as a visiting professor at the Conservatoire National des Arts et Metiers, a national university in Paris.

Rooting for Scooters

$
0
0

Expect to hear about folks in the Los Angeles area taking stands on the app-based, pay-by-the-mile electric scooters that seem to be scattered about the City of Angels in greater numbers by the day. Tough to tell how many, since scooter brands such as Bird are on a fast track that involves dropping scooters off on street corners, where customers take over, dispersing the two-wheelers without any set route or distribution plan involved.

Suffice to say that it’s increasingly common to see riders zipping along on the scooters – or the vehicles themselves standing idle in the public domain, waiting for the next rider to get aboard.

Don’t sweat it if you haven’t considered this phenomenon – the market is ready to handle the job even as the public sector does some preliminary work to various effects.

Santa Monica and other municipalities have been pressing the companies behind the scooters to get them properly registered. West Hollywood has moved to ban them, with officials there citing risks they see in the vehicles being left willy-nilly on sidewalks between rides.

Still others likely see different reasons to dislike the scooters –some elected officials might have their own reasons to favor established providers of transportation over newcomers in any case. Some disruptors haven’t been around long enough to become big campaign donors, after all.

Not all city governments in the Greater L.A. area are against the scooters, though. Some welcome them as a cheap solution to the “last mile” – the fabled link from home to public transit stop.

And it’s nearly time, in any case, for the market to take a greater hand in the situation. It’s well equipped to sort out the matter of the scooters without any of the sorts of cruelly sharp edges that can come with unchecked capitalism. What’s the worst-case scenario, anyway? A busted unicorn and life without pay-by-the-mile scooters? Not exactly an existential threat.

The question of the scooters and their place in daily life occurred to me on a recent jog along Pico Boulevard in the Mid-City area of Los Angeles I had to stop at a red light at Pico and San Vincente, and a young woman pulled up alongside me on a pay-as-you-go scooter. She wasn’t traversing her last mile. She told me she was headed to the Grove shopping center, and the one-way trip on the scooter would cost her $2.60 – about half the minimum fare for popular ride-sharing services.

That level of service at that price is going to win a customer base.
A customer base means the lawyers will come – and we then will see if the scooters will have to be redesigned to carry helmets, and whether the helmets will have to be equipped with sanitary spray, and so on. That will mean more expenses for production, not to mention liability insurance.

The price of a ride will go up, and we’ll have to see how much the young lady on her way to the Grove is willing to shell out before she opts for a bus or ride-share service.

Then will come the unfortunate reality of crime. Folks will figure out ways to game whatever digital wonder keeps the scooters from rolling unless someone’s paying. And someone will figure out there’s some value in the materials or component parts that might – when commodity markets are right – tempt them to drive about tossing the vehicles into the back of pickup trucks for transport to a recycler, salvage yard or smelter.

None of this is fun, but it all might serve a good purpose. These scooter outfits deserve a place on our streets if they can deal with the lawyers, manage their risks, overcome the same potential for crime that so many other businesses face and still keep their prices low enough to keep their customers.

That’s the market – and the scooters present a fine opportunity to watch it work.

Who figured the politically “progressive” bastion of L.A. might be the place where the market could make the call on the latest digital disruption.

Jerry Sullivan is the editor of the Los Angeles Business Journal.

Photo: Via www.bird.co/instagram

Partners in Transit: Agencies team up with Lyft, Uber

$
0
0

Many public transit agencies are struggling to sustain lightly-used routes as passenger traffic dips in response to relatively cheap automobile fill-ups, a rise in work-from-home lifestyles, and the growing popularity of transportation network companies (TNCs), such as Lyft and Uber. The brunt of the decline has been sharpest in small and mid-size communities, where some bus services are infrequent, follow meandering routes, and stop running after peak hours.

Facing growing pressure to try new things, many transit agencies and municipal governments are experimenting with strategies that involve ridesharing. Our new study, Partners in Transit: A Review of Partnerships between Transportation Network Companies and Public Agencies, describes more than two dozen partnerships around the country designed to allow transit operators and TNCs (predominately Lyft and Uber) to concentrate on what they do best. TNCs fill gaps, offer “first- and last-mile” solutions, and augment service to those with mobility challenges, while transit providers direct resources to modernizing top-performing routes, serving commuters, and other core strengths.

The idea behind many partnerships is that a properly designed program can be less expensive than buying buses and paying for labor, fuel, and maintenance on lightly used routes. They also give public bodies experience with emerging technologies and can boost the public image of transit, not to mention get travelers to their destination faster. The pace at which partnerships are emerging across the country deserves far more attention than it has received.

Several of the most intriguing partnerships provide all travelers free or discounted ridesharing trips within a community. Monrovia, CA’s partnership subsidizes Lyft rides so that travelers can go between any two points within its boundaries cost just $0.50. Since the program’s introduction in March, more than 53,000 trips have been taken at this ultra-low rate, which city officials believe boosts mobility, alleviates parking shortages, and enhances economic development.

Dublin, CA offers across-the-board 50% discounts of up to $5 on all Uber and Lyft trips within its boundaries, including those shuttling to its Bay Area Rapid Transit station. Across the Canadian border, Innsifil, Ontario—reportedly Uber’s first program in that country—boasts a similar discount program and has generated an outsized amount of publicity.

But more narrowly focused programs, such Dayton, OH’s and San Clemente, CA’s, which limit most rideshare discounts to areas affected by service cuts, are especially “hot”. Austin, TX’s program offers free trips provided by RideAustin within its Exposition Area, which has many technology jobs, as well as trips to/from nearby bus stops. Charlotte, NC, Summit, NJ, and Marin County, CA have improved access to new rail-transit lines and have mitigated parking shortages by offering discounted rides to certain stations. In Detroit, MI and the St. Petersburg, FL area, there are special discounts for night-shift workers.

The process is simple: customers usually enter a discount code into an app to receive the fare reduction, and government agencies pay the difference, which is often $4 - $8 per ride—well below the cost of moving the same customers on buses or trains. Nevertheless, making these programs permanent can be tricky: if programs are too generous, they can become victims of their own success, outstripping the budget; if too stingy, they generate little “buzz” and go largely unused.

Still, both large and small agencies are testing the waters: 11 of the 50 largest transit agencies in the United States have experimented with some form of partnership. If more major players make the plunge, there will likely be “strings attached” for users, due to the obvious problem that a poorly designed program could cannibalize bus and train ridership. Agencies in Boston and Las Vegas, for example, have created programs limited primarily to paratransit-eligible users to manage that risk. Boston’s program appears to involve the greatest ridership of any partnership created to date.

What comes next? Being able to pay for both rideshares and transit – and connections between the two – on a single app. Up until now, customers must buy pay two fares when making ridesharing/transit connections. This inconvenience will end once sensitive issues such as protecting private information and technological hurdles can be crossed.

Considering the speed at which ridesharing is growing, more agencies will likely reach out to Lyft, Uber and other providers to test out new strategies in the next couple years.

Joseph Schwieterman, Ph.D., is professor of Public Services and director of the Chaddick Institute for Metropolitan Development at DePaul University in Chicago. His co-authored study Partners in Transit was released last week.

Top photo: A Miamisburg, Ohio bus stop, part of the Dayton area’s free Lyft-ride program for areas affected by service cuts. Photo source: J. Schwieterman


‘Chinafornia’ And Global Trade In Age Of Trump

$
0
0

One of the last regions settled en masse by Europeans, California’s trajectory long has been linked to its partners across the Pacific. Yet these ties could be deeply impacted by President Trump’s immigration and trade policies, as well as resulting blowback by the authoritarian regime in Beijing.

In recent decades, California has become something of a China junkie. With China on the route to what some predict will be hegemonic power, there’s a set who eagerly wish to promote the idea of “Chinafornia.” The pattern of dependency can be seen in how our industries depend on China for their production. For some companies, like Apple, China provided the capacity to produce products cheaply without suffering heavy GHG impacts in state. China’s coal-based pollution allowed these congenitally “virtue signaling” firms to retain their “green” street cred.

Yet as a trade war looms, California could find itself without key markets, investment capital and sources of supply for its increasingly de-industrialized economy. Any reduction in immigration, and related investment flows, could dent real estate values, particularly in such speculator-driven markets as Irvine, downtown Los Angeles and Koreatown. There could be political ramifications as well given the close ties between China and California officials, including an alleged spy working as a driver for Sen. Dianne Feinstein.

California’s historic ties

Asia has always been a kind of ace in the hole for California. The state’s economic emergence in the early 1900s was tied directly to rising trade with Japan, China and the country’s new imperial outpost, the Philippines. These connections, wrote the Los Angeles-based journalist Harry Carr, changed our region from “a hick town” and turned it “into a city.”

Of course, some of our early entanglement with the Pacific was profoundly oppositional. Deep-seated fears of Asian immigrants engendered harsh racial restrictions, including bans on property ownership. The massive buildup against Japan during the Second World War sent tens of thousands of Japanese residents, including citizens, to concentration camps, but also initiated the region’s first great wave of industrialization.

Since the war California has benefited from its Asia ties in generally more positive ways. Asian importers, such as car companies, tended to use the Port of Los Angeles and set up their local headquarters here. Investors, particularly from Japan in the 1980s, buoyed the state property market. New immigrants from China, Korea, south Asia and Vietnam brought a tremendous work and entrepreneurial ethos to the state, helping to revitalize communities from the San Fernando and San Gabriel valleys to wide swaths of Orange County.

The challenge of Trump

Over the past half century, both parties have tended to be friendly both to globalization. Yet now the state’s establishment is being rocked by Trump’s assault on both generous immigration policies and China’s unfair trading practices. China’s mercantilism alone has been linked by labor-aligned groups with the loss of millions of jobs. There’s a stark class division here; the upper classes have largely benefited while many higher-wage job opportunities for middle- and working-class Californians have disappeared.

The current Trumpian policies could change this, forcing companies to rely more on citizen workers and local capital. Silicon Valley tech firms, now dependent for 40 percent of its workforce on largely Asian imports, will have to compete for domestic labor with regions and companies that operate in more reasonably priced markets. This could benefit local workers and sub-contracting firms.

To be sure, some California exporters — notably in the Central Valley, Hollywood and Silicon Valley — could find some markets shut off to them. Yet, in the longer run, China will likely suffer more in a trade war, given its almost four times larger volume of exports than come from the U.S., weaker domestic markets and massive indebtedness. Trump’s approach could force it to compromise on key trade issues in ways that benefit our exporters.

Can we benefit from the new reality?

Given the extraordinary anti-Trump mood in the state, it may seem discordant to see any good in Washington’s trade stance. California is home to nearly 40 percent of all Chinese home purchases in the U.S. These investors are one primary cause for the insane property-price inflation that has effectively chased young American families from the state. Would it be a tragic loss to lose the capital expended by non-resident foreigners who buy property largely as a kind of safe deposit box? Some two-fifths of these investors, according to a one real estate study, do not intend to live in their homes.

Policies discouraging shifts of work to China also could help reorient our business from just originating ideas to making products. This could prove a potential boon to the state’s suffering working class and for the environment, by shifting production to relatively clean California from coal-dependent China.

We are right to be offended by the xenophobia associated with the Trump policies. But if a crisis in Chinafornia spurs the state to think about decreasing our dependence on China, perhaps we can begin to promote development that helps not just speculators, investors and oligarchs, but ordinary Californians.

This piece originally appeared in The Orange County Register.

Joel Kotkin is executive editor of NewGeography.com. He is the Roger Hobbs Distinguished Fellow in Urban Studies at Chapman University and executive director of the Houston-based Center for Opportunity Urbanism. His newest book is The Human City: Urbanism for the rest of us. He is also author of The New Class ConflictThe City: A Global History, and The Next Hundred Million: America in 2050. He lives in Orange County, CA.

Photo: 禁书 网, via Flickr, using CC License.

Louisville’s Urban Bourbon Movement

$
0
0

As a spirt, bourbon is heavily associated with the state of Kentucky. But while major spirits firm Brown-Forman is located in Louisville, traditionally bourbon was distilled in rural – and ironically, dry – counties like, say, Bourbon County.

But Louisville has managed to stake out a position for itself as the basecamp for Kentucky’s bourbon trail. Also, there’s been a major move of distillers into the city. There are micro-distilleries everywhere these days, but what distinguishes Louisville here is the big money that’s been poured into in-city facilities.

I was in Louisville a few weeks ago and noticed what appeared to be a sizable new mixed use development of some type in the NuLu neighborhood, but I couldn’t quite figure out what it was. So I walked around to the front of it and saw that it was actually a distillery called Rabbit Hole.

I said to myself, “That thing clearly cost millions. Where did it come from?” When I got home I looked it up and indeed it cost $14.7 million. (By contrast, Cardinal Spirits in Bloomington, Indiana, which I’ve written about before, got started with $850,000 in crowdfunding).

Where did the money come from? As it happens, as with Cardinal Spirits, this is an example of brain drain rebounding to urban benefit. The guy who founded Rabbit Hole married a woman from Louisville while they were both living in Chicago. They moved back to Louisville and he started the distillery with what appears to be financial backing from his wife’s family.

An even bigger $27 million was invested in nearby Angel’s Envy, which is backed by spirits giant Bacardi. The Evan Williams Experience was $9.5 million. That brand is owned by Heaven Hill, which is an established local spirits company, albeit not one of the world’s largest. (They distribute Hpnotiq among other brands).

There may be more like this but these I know offhand. There’s big corporate and local family money that’s been poured into first class facilities for urban bourbon in Louisville. And it appears to be working as I believe bourbon-related tourism is way up in the city.

This piece originally appeared on Urbanophile.

Aaron M. Renn is a senior fellow at the Manhattan Institute, a contributing editor of City Journal, and an economic development columnist for Governing magazine. He focuses on ways to help America’s cities thrive in an ever more complex, competitive, globalized, and diverse twenty-first century. During Renn’s 15-year career in management and technology consulting, he was a partner at Accenture and held several technology strategy roles and directed multimillion-dollar global technology implementations. He has contributed to The Guardian, Forbes.com, and numerous other publications. Renn holds a B.S. from Indiana University, where he coauthored an early social-networking platform in 1991.

European Commission Exaggerates Urbanization

$
0
0

Urban planners long have been concerned about “urban sprawl,” despite never having settled on a term that excludes any urbanization, even the densest in the world. But the European Commission (EC) has taken exaggerating about urban sprawl to a new level. This is best illustrated by the treatment of Beijing in its Atlas of the Human Planet – 2016. The EC estimates that the Beijing urban area now covers more than 50,000 square kilometers, which is more than 10 times previous continuous urbanization estimates (see: Demographia World Urban Areas). Their approach tends to make cities seem bigger than they are in reality. The EC’s overall 84% world urbanization estimate is well above the United Nations’ 55%.

The photograph above shows the urban sprawl of the EC’s Beijing urban area (Note). It was taken just south of Beijing, in the municipality of Baoding, Hebei province. EC researchers broadened the definition of “urban” by adopting a population density threshold so low that much of eastern China’s agricultural land could be designated as “urban.” The questionable urban definition includes adjacent square kilometer grid cells with more than 300 persons per square kilometer that combined have more than 5,000 residents. At Chinese densities, it is not difficult to agglomerate adjacent grid cells to reach 5,000 residents.

This has allowed the EC to declare Beijing to be the world’s first gigacity, with more than 100 million residents --- a figure that is five times the population within the actual built-up area. My view is that, with respect, the EC has made a serious mistake, here and elsewhere.

For example, according to the EC, the Cairo urban area covers more than 20,000 square kilometers, with a population of more than 40 million. In fact, the Cairo urban area covers less than one-sixth the EU figure, while the population is exaggerated by at least 20 million. Cairo is surrounded on three sides by largely uninhabited desert and extensive agriculture.

Response from Atlas of Urban Expansion Authors

Some of the world’s leading urban researchers have expressed similar concerns. New York University Professor Shlomo Angel and his colleagues Patrick Lamson-Hall, Bibiana Guerra, Yang Liu, Nicolás Galarza, and Alejandro M. Blei minced no words in protesting the conclusions of the European Commission research, charging “that the European Commission’s number is implausible if the word ‘urban’ is to retain any familiar meaning at all.” Angel and some of the others above are also authors of the ground-breaking Atlas of Urban Expansion, published by the NYU Urban Expansion Program at New York University, UN-Habitat, and the Lincoln Institute of Land Policy.

In their paper, Our Not-So-Urban World, Angel, et al. blast the whole EC approach as exceedingly high. They continue: “We must conclude, therefore, that the urban density threshold adopted by the European Commission is simply too low, and that this low threshold leads to counting households that are not urban—either because they make a living in agriculture or because they live at non-urban densities; and that including these households results in massive over counting of the urban population of the world.”

The Need for Contiguity Between and Within Grid Cells

Part of the problem lies here: High population densities in agricultural areas are common in some parts of China and Indonesia, where small, dense villages are completely surrounded and separated from one another by farmland. An urban planning colleague sent along an email attachment illustrating the point that some rural land in China (between Luoyang and Zhengzhou, in Henan) has as high a population density as the Los Angeles built-up urban area. Los Angeles is the densest built-up large urban area in the United States.

Density thresholds do not, in and of themselves define urbanization. This requires contiguity of urbanization between and within the grid cells.

As Angel et al. note: “Without contiguity, agricultural regions with small plots tended by farmers living in villages and hamlets are lumped together with large metropolitan areas and labeled urban. As a result, a far too large share of the world’s population and a far too large share of the global land mass is classified as urban.”

China’s High Agricultural Densities

In China’s leading agricultural producing province, Shandong, more than 90% of the rural counties (Note 2) exceeded 300 per square kilometer in the 2010 census. In the second leading agricultural province, Henan, more than 80% of the rural counties had densities of 300 or more per square kilometer.

Further, these high rural densities are not new. In Baoding, site of the photograph above, thirteen of the 14 rural counties with densities at least 300 per square kilometer had reached that level by the 1982 census. It is significant that this was at the beginning of the reform era, before China’s massive urbanization, now nearly 60%, but only little more than 20% in 1982.

Two Google Earth illustrations demonstrate the problem with the EC urban definition. Figure 1 shows approximately 3,000 square kilometer part of northwestern Shandong, with numerous tan dots that are villages in the midst of the green background of agriculture. Each of the villages is surrounded by farmland. They do not represent contiguous urbanization because they are adjacent to agriculture, not urbanization.

Figure 2 shows a four square kilometer area at a larger scale from Figure 1. Each of the villages is circled to illustrate its surrounding farmland. This illustration shows how a rural area can have a high density, without being counted as part of contiguous urbanization.

The Need for Accuracy and Clarity

Having become accustomed to weak research conclusions being repeated in the press, Angel et al. caution that the EC numbers will likely be repeated ad nauseum by media outlets looking for scoops or by interested parties anxious to make use of this number to further their political agendas.”

Further, there is the threat that exaggerating urbanization could lead to stronger ill-advised urban containment policies, which would block the organic growth of cities and stifle aspiration. Angel et al. note that such containment “is the position adopted by many planners, environmentalists, and city officials that are appalled by urban ‘sprawl’ and have sought, unsuccessfully, to contain it for the past thirty years. Where containment has been successful—say, in Seoul or San Francisco—it has usually resulted in critical land supply bottlenecks and skyrocketing land and house prices.”

Angel, et al. “recommend that the 84% number proposed by the European Commission not be bandied about but be laid to rest, and we urge its competent researchers to go back to the drawing board and start afresh.” This is good advice from researchers who let the facts, and daily reality, not ideological aspirations, drive their conclusions.

Note 1: It is presumed that this is included in the EC’s Beijing urban area. Unfortunately, the Atlas of the Human Planet contains no map of sufficient resolution to guarantee it. However, any 50,000 square kilometer Beijing urban area would have an abundance of land as obviously rural as this.

Note 2: In Shandong, 56 of the rural 60 counties (“xian”) outside urban areas or county level cities had population densities above 300 per square kilometer. In Henan, 72 of the 88 rural counties had population densities above 300 per square kilometer.


Wendell Cox is principal of Demographia, an international public policy and demographics firm. He is a Senior Fellow of the Center for Opportunity Urbanism (US), Senior Fellow for Housing Affordability and Municipal Policy for the Frontier Centre for Public Policy (Canada), and a member of the Board of Advisors of the Center for Demographics and Policy at Chapman University (California). He is co-author of the "Demographia International Housing Affordability Survey" and author of "Demographia World Urban Areas" and "War on the Dream: How Anti-Sprawl Policy Threatens the Quality of Life." He was appointed to three terms on the Los Angeles County Transportation Commission, where he served with the leading city and county leadership as the only non-elected member. He served as a visiting professor at the Conservatoire National des Arts et Metiers, a national university in Paris.

Photograph: “Urban Sprawl” in the Beijing Area, according to EC criteria (by author).

How We Lit The Fuse On The Population Bomb

$
0
0

We’ve been here before – concerns about our capacity to house a large population are not new. But lately, hostility to rapid rates of population growth is gaining traction. There have been calls for a population inquiry and former PM Hon Tony Abbott has called for immigration (and hence population growth) to be slashed. He joins a chorus of other voices, from business to community groups. Voters are pushing back against growth and political leaders are feeling the pressure.

But these pressures are confined to mostly two cities: Melbourne and Sydney (and perhaps to a lesser extent Brisbane). There are other capitals and countless regional cities who covet growth but find it eludes them. Instead, stupidly (it has to be said) we continue to cram accelerating population numbers – mostly driven by immigration – into a couple of urban centres.

Melbourne was first settled by whites in 1835 and took 165 years to reach 2.5 million people (by the year 2000). Australian demographer Bernard Salt predicts the next 2.5 million will be added in just 21 years with the city reaching five million by 2021. He thinks it will sail past eight million by 2050. Sydney has a similar story.

According to the Productivity Commission’s 2016 Migrant Intake into Australia report, 86% of migrants settled in major capitals, compared with 65% of the Australian born population. More recent information suggests the trend has grown, with only 6% of recent migrants now settling in regions.

The Government has toyed with the idea of insisting that migrants settle regional areas plagued with genuine labour shortages but there seems little determination to back the threats with action, which in itself could be difficult (and possibly illegal) to carry out.

Outsiders observing Australia’s handling of growth must be incredulous to learn that much of the concentration of growth has not occurred by accident, but is widely endorsed policy. Higher urban densities have since the late 1990s been at the core of urban development policy to handle population growth in the very cities now feeling the most resistance to growth. The benefits promised as a result of increased density were many and the public were assured that they would share in an improved quality of life as a result of these policies. Take this example from the 2013 Draft Metropolitan Strategy for Sydney to 2031:

“A home I can afford. Great transport connections. More jobs closer to where I live. Shorter commutes. The right type of home for my family. A park for the kids. Local schools, shops and hospitals. Livable neighbourhoods.”

And the result? For Sydney and Melbourne especially, housing affordability is now ranked among the worst in the world according to the annual Demographia report and other surveys. An entire generation locked out of housing. Congestion is chronic. Private and public transport systems are under more pressure than ever. Commutes take longer and housing choice has been compromised. Is this livability? Talk about over promise and under deliver. If these promises had been borne out by the day to day experience of average Australians living in these cities, there wouldn’t be the push back politicians are feeling now.

Even more incredible, confronted with the political challenge of an increasingly hostile public, some suggest (from the comfort of their high priced inner urban enclaves no doubt) that what is needed is not change, but more of the same. The Planning Institute of Australia (PIA) recently suggested as much, responding to a challenge from ABC interviewer Ellen Fanning on the 7.30 am program on how to “stuff(ing) another three and a half million people into Melbourne and Sydney both”.

The PIA responded that “We’ve got a great challenge to ensure that we don’t end with megacities like Lagos or Manila. We want Tokyos, Parises, and New Yorks – and we can do that by planning well.” (emphasis added).

Really? Tokyo, Paris and New York might be on our bucket list of cities to visit, but how many average Melbourne or Sydney residents hope they’d one day see their own city turn into a version of Tokyo or New York? I can think of no public opinion poll where we Aussies have put up our hands to using Tokyo as a model for urban development. Any politician suggesting as much would last a nano second before being turfed out.

It serves to illustrate how wide the disconnect has become between public policy makers and the wider community. The “we” word is used when the “I” pronoun is what’s really meant.

Maybe it’s time for a genuine reality check? Australia has a landmass the size of the USA but with only 25 million people. Australia can readily support a larger population but in getting there, infrastructure standards need to keep up with growth, not continuously lag it. Housing and lifestyle choices don’t have to be further compromised to serve a model of urban development at odds with broader public opinion. The idea that much of this growth should continue to be concentrated in just a handful of cities, and particularly dense inner ring neighborhoods, is plain crazy.

The answer is not in forcing people to settle in density, no matter how degraded the quality of life, but making these cities and regions more attractive as places to settle. Jobs, industry and economic growth lie at the centre of this. Positive economic attraction strategies, reduced tax or red tape burdens, abundant and low cost utilities (power, gas, water), ‘special economic zones’ – all are elements capable of attracting employers and industries, and with them jobs for workers and their families. And if regional employment was further supported by the type of place making and related infrastructure support more typically only on offer in the centres of major capital cities, centres like Mackay, Armidale, Wagga Wagga, Orange, Casino, Bendigo and plenty of others can enjoy growth without the accompanying political pain.

Sadly, this rather obvious policy option isn’t being explored. According to a recent report in the Sydney Morning Herald: “Inner-city centres on the east coast have amassed the greatest share of Australia's new public service jobs under the Coalition government as outer suburbs, bush towns and Canberra took cuts to their ranks of bureaucrats.” So we not only concentrate our population into a few centres but government jobs as well. This is hardly spreading the load, sharing the benefits, or helping middle class families.

Stopping growth by rapidly closing down immigration would be disastrous for industries but at the same time, persisting with our current approach will only further aggravate hostile electorates in the major cities. If we want to grow, with immigration or not, we have to figure out what options people should have, not force them to live as they do not wish.

The fuse on the population debate has been lit, for good or ill. And maybe we are the ones that lit it.

Ross Elliott has more than twenty years experience in property and public policy. His past roles have included stints in urban economics, national and state roles with the Property Council, and in destination marketing. He has written extensively on a range of public policy issues centering around urban issues, and continues to maintain his recreational interest in public policy through ongoing contributions such as this or via his monthly blog, The Pulse.

Photo: Dion Hinchcliffe, via Flickr, using CC License.

What Happened After the Last HQ2 Competition

$
0
0

When I traveled to Oklahoma City for the first time a few years ago I was shocked to discover that in the civic narrative of the city’s transformation – it’s origin story if you will – the triggering event for change was losing a competition for a United Airlines maintenance facility in 1991 to Indianapolis.

This United Airlines maintenance base was like a Foxconn or HQ2 of its era. It was a big deal because the thousands of jobs would be very high paying union mechanics and there were going to be a lot of them. It was anticipated that many people would be moving from the San Francisco area, where UA’s main maintenance base was, to this new facility. Here’s how the Chicago Tribune described the deal back at the time.

Score another one for Indianapolis. United Airlines chose Indiana’s capital Wednesday for its $1 billion aircraft-maintenance center, ending a 21-month bidding war among several states for the economic plum.

It was the latest of several recent development coups establishing Indianapolis as the pre-eminent growth city of the Midwest.

Just two weeks ago the U.S. Postal Service chose Indianapolis over 30 other Midwestern cities for its Express Mail sorting facility, which is expected to create up to 700 jobs. Four years ago the city, which has become the national center for amateur sports since the construction of the enclosed Hoosier Dome stadium in 1984, hosted the Pan American games.

The United maintenance hub, however, is by far the largest economic development project captured by the central Indiana metropolis in several decades.

The 3 million-square-foot complex of airplane-maintenance hangars and other buildings, to be built on a 300-acre site at Indianapolis International Airport, will employ up to 7,000 workers paid an average of $45,000 a year.

It will be, in fact, one of the largest aircraft-maintenance facilities in the world.

In addition, the center, to open in late 1994 to service United`s growing fleet of Boeing 737 jet aircraft, is expected to generate another 5,000 jobs at Indianapolis firms that will provide supplies and services to the center and its employees.

Construction of the facility, scheduled to begin next August, also will provide jobs for about 5,000 construction workers and will funnel millions of dollars of additional revenues into the tax coffers of Indianapolis and Indiana.

At the time this competition was ongoing, Oklahoma City had been struggling during an energy bust. The city went all in to win it, putting $300 million in incentives on the table. They made it to the final two, only to be told they’d lost out to Indianapolis.

The city pressed UA to give them a post-mortem analysis on the loss, and the airline eventually told them that even though they had the best bid, their employees had given Oklahoma City the thumbs down. They were unwilling to move there.

Ron Norick, the mayor at the time, went to Indianapolis and saw the downtown developments there. I can assure you, downtown Indianapolis was not that great in 1991. Most downtowns weren’t. However, the level of activity they did have – the relatively new to town Colts, the Pan Am Games, the restored Union Station – was much better than many other places of that era.

Norick ended up proposing what became the first iteration of MAPS – Metropolitan Area Projects – in which city taxpayers agreed to a limited time sales tax increase to fund downtown improvement projects. It was only after MAPS passed that the 1995 bombing occurred, and completing the projects was part of the city’s healing process from that trauma.

What I find interesting about this is that an event which looms so large in the leadership consciousness of Oklahoma City is completely unknown in Indianapolis. I never even knew that it was OKC Indy had beaten to win the deal in the first place. Presumably almost no one in Indianapolis did. Nor did they know the transformative impact this loss had on OKC.

But there’s a reverse side to that. The people I talked to in OKC also had no idea what had become of that maintenance facility in Indianapolis. As it turns out, that United base never achieved its promise. In fact, United closed it only a decade after it opened in 2003. According to the New York times from that era:

A huge, light-gray building, trimmed jauntily in blue, rises from the rolling, grassy fields on the far side of the runways at Indianapolis International Airport. From the approach road, the building seems active. But the parking lots are empty and, inside, the 12 elaborately equipped hangar bays are silent and dark. It is as if the owner of a lavishly furnished mansion had suddenly walked away, leaving everything in place.

That is what happened. United Airlines got $320 million in taxpayer money to build what is by all accounts the most technologically advanced aircraft maintenance center in America. But six months ago, the company walked away, leaving the city and state governments out all that money, and no new tenant in sight.

The shuttered maintenance center is a stark, and unusually vivid, reminder of the risk inherent in gambling public money on corporate ventures. Yet the city and state are stepping up subsidies to other companies that offer, as United once did, to bring high-paying jobs and sophisticated operations to Indiana. Many municipal and state governments are doing the same, escalating a bidding war for a shrunken pool of jobs in America despite the worst squeeze in years on their budgets.

The buildings have subsequently be re-leased, but last I checked the city was still paying off the bonds it issues for the gigantic subsidies it had doled out to win the deal. From the Indianapolis perspective, the deal was a big underperformer and arguably a money loser.

It’s very interesting to me that a shared event of that nature can have such an impact yet produce no shared consciousness.

This piece originally appeared on Urbanophile.

Aaron M. Renn is a senior fellow at the Manhattan Institute, a contributing editor of City Journal, and an economic development columnist for Governing magazine. He focuses on ways to help America’s cities thrive in an ever more complex, competitive, globalized, and diverse twenty-first century. During Renn’s 15-year career in management and technology consulting, he was a partner at Accenture and held several technology strategy roles and directed multimillion-dollar global technology implementations. He has contributed to The Guardian, Forbes.com, and numerous other publications. Renn holds a B.S. from Indiana University, where he coauthored an early social-networking platform in 1991.

Photo: “Automobile Alley in Oklahoma City” by katsrcool/Flickr. Licensed under CC BY 2.0

Food Porn

$
0
0

What’s this now? A few acres of suburban gardens? Yes. And no. It’s the mini farm adjacent to The French Laundry in California’s Napa Valley. Local. Organic. Seasonal. It’s the full expression of a particular trend in foodie culture. It’s strange to see so ordinary a thing – veggies growing in a suburban plot – elevated to near monastic tidiness. It’s illegal to grow food on the front lawn in many places these days, either by municipal regulation or private home owners association bylaws. Even where it is legal, most people simply don’t do it. Food is cheap. Gardening is a lot of work. Why bother?

An old friend turned fifty and decided to celebrate her birthday by inviting her nearest and dearest to a fine meal at her expense. Lucky us. She’s an Australian expat. With makeup and a nice frock she looks like an English lady who writes mystery novels. If you saw her at the supermarket reaching for lactose free milk in sweat pants with just a hint of cat fur on her bosom you won’t think twice. But she’s smart. The kind of smart that tech companies throw money at to solve their problems. Gobs of money. No. She isn’t part of the “1%.” Instead she’s their well compensated handmaid. In a previous era she’d be a school nurse or a librarian back in suburban Melbourne. But Silicon Valley called.

One way to jump the queue and get a reservation a mere three months in advance is to reserve a private room and pay up front. Friends flew in from various continents for the occasion.

The service, food, and wine were exquisite. I doubt any of us will ever have another meal that comes close. Extravagant? Yes. I was hyper aware of the excess. This isn’t my natural habitat. It was one of those things I never expected to experience in life. Like having health insurance. But life is funny that way. There I was, an anthropologist on Mars. And it was lovely. The highlight? For pure taste, the cold melon soup amuse bouche as we sipped champagne overlooking the garden.

Years ago I was brought to a Lakers game in Los Angeles by a prominent individual. I know exactly nothing about basketball. But we had front row seats. My feet were on the court. Before and after the game we ate and drank in the room reserved for players and special members of certain circles. It was all lost on me. But I did enjoy a glimpse into a world I would never inhabit. The kitchen at The French Laundry gave me the same feeling.

The birthday girl was far too well mannered to speak of money. “Let’s just enjoy each other’s company and savor this unique experience.” But back at the hotel I shamelessly peaked at the bill when she stepped out for a moment. All in, the four hour meal came to just shy of $16,000.

This piece first appeared on Granola Shotgun.

John Sanphillippo lives in San Francisco and blogs about urbanism, adaptation, and resilience at granolashotgun.com. He's a member of the Congress for New Urbanism, films videos for faircompanies.com, and is a regular contributor to Strongtowns.org. He earns his living by buying, renovating, and renting undervalued properties in places that have good long term prospects. He is a graduate of Rutgers University.

California Takes The Prize For Environmental Virtue Signaling — But Not Much Else

$
0
0

If there’s an award for environmental virtue signaling, California would win the prize. Yet for all the constant self-promotion, shameless grandstanding and endless moralizing, perhaps it’s time to reconsider the impact, and failures, of our current green obsessions.

Take the recent fires that Gov. Jerry Brown, predictably and with little evidence, blamed squarely on climate change. If he wanted to find the immediate culprit, he might be better off looking in a mirror. Earlier this year the Little Hoover Commission placed primary blame for increasing ferocity of fires on poor forest management practices, largely at the behest of the powerful green lobby. Saying that this echoes Donald Trump is true, and guaranteed a Pavlovian reaction from the progressive press, but even the blusterer in chief is occasionally right.

Even before the most recent fires, estimates indicated that the magnitude of greenhouse gas emissions from the state’s poorly managed forests — the forest lands that cover 33 percent of our territory — greatly increased the state’s emissions. For years, green lobbying has pushed policies creating vast areas with dense underbrush and stunted tree growth, just perfect to incubate catastrophic wildfires. California could use this wood for building materials or sustainable energy instead of buying virtually all its building material wood products from China, Canada or other states.

The limits of good intentions

Overall, California’s drive for environmental perfection — requiring reductions roughly twice that required by the Paris accords — has not been notably successful, notes a recent Chapman University report. Since 2006, the state’s reductions in GHG rank a mere 35th among the states and 41st when adjusted for population growth. Even Texas, that bogeyman of fossil-fuel excess, has been reducing its per-capita emissions more rapidly.

Worst still, this posturing has made California, and other similarly minded jurisdictions, less congenial places for middle-class homeownership or employment. Meanwhile the goodies, such as giving tax breaks from cap-and-trade funds for electric cars — we spend 10 times as much on those subsidies than on forest clearance — or solar rebates that go to generally affluent wealthy homeowners and well-connected corporations.

Even though California’s green policies will contribute almost microscopically to global GHG reduction, the state seem determined to keep bolstering its enviro-cred on the backs of its vulnerable citizens. This is done through ever more stringent land-use controls, spending billions on boneheaded schemes like high-speed rail, and ever greater regulation of the basic services of water and power. Green-oriented policy shops, including from former Clinton Chief of Staff John Podesta, have other clever ideas such as depressing already low birthrates or even repealing basic property rights.

Is there an alternative?

For all its scientific pretension, the green movement is increasingly theocratic in nature, with a powerful preference for dictatorial approaches associated with hierarchical regimes like China. It regards any debate relating to climate or even mitigating steps unnecessary while dissidents and fossil-fuel firms are threatened with prosecution.

Since human beings created global warming, it appears, the green theologians believe the species should be punished by consistently ratcheting down our quality of life. This fits well with Brown, a onetime Jesuit and scion of a well-heeled, and powerful, family for whom austerity has been a constant theme, going back at least to his Jesuit seminary days. Who, after all, needs single-family houses or the flexibility of a car? Other green grandees, including Prince Charles and Stewart Brand, have even praised slum life for conserving resources. Our future: goodbye Lakewood, hello Mumbai.

Perhaps this is a future we don’t want, particularly to pursue supposed Paris-decreed policies embraced by the leading hectoring countries, like Germany — are failing to meet. Rising GHG emissions, linked to greater coal burning, have challenged Merkel’s legacy as the “Climate Chancellor” of Europe. As for China, whose fossil fuel emissions are greater than the U.S. and the EU combined, we can expect more GHG on the horizon even as the supposedly unenlightened U.S. continues to drive down emissions.

A better approach, particularly at a time when the state’s economic growth is slowing, would be to prioritize resilience over faux puritanism. If we are indeed to face more droughts or rising temperatures, let’s adopt people-friendly GHG reducing policies. These could include encouraging home-based and dispersed work to get people closer to employment, fighting desertification through building better storage capacity for wet years, updating the state’s increasingly decrepit dams, boosting, as well as investing in, new energy-saving technologies.

For millennia, great cities, and countries, have dealt with major environmental challenges. Ancient cities in the Middle East as well as Rome built aqueducts to bring water from the high mountains for their citizens — much like California did in the last century. Others, like the Netherlands, have engineered their environment to keep water out. Better than donning a hair shirt to fight climate change, maybe we should be putting our engineers and planners to work finding the best way to adapt to looming environmental challenges, as regions have done since the earliest times.

This piece originally appeared in The Orange County Register.

Joel Kotkin is executive editor of NewGeography.com. He is the Roger Hobbs Distinguished Fellow in Urban Studies at Chapman University and executive director of the Houston-based Center for Opportunity Urbanism. His newest book is The Human City: Urbanism for the rest of us. He is also author of The New Class ConflictThe City: A Global History, and The Next Hundred Million: America in 2050. He lives in Orange County, CA.

Photo by Mendocino California Sheriff's Department [Public domain], via Wikimedia Commons


America’s Rising Startup Communities

$
0
0

Ian Hathaway at the Center for American Entrepreneurship recently took at look at startup financing to see whether tech was dispersing or concentrating. He found that first financings remain heavily concentrated in the top five markets:

Among his findings:

• After a stellar five-year period of expansion, a sharp contraction in the number of startups raising a first round of venture capital has occurred the last three years—falling to 2,496 first financings in 2017 from a peak of 3,465 such deals in 2014, for a decline of 28 percent. It previously rose 155 percent over the five years between 2009 and 2014, up from 1,360 deals.

• This contraction has been geographically widespread. Fewer metro areas had a startup that raised a first round of venture funding and those that did had a smaller number of them. More than three-quarters of U.S. metropolitan areas had either no activity or declining activity in first financings between 2013-14 and 2016-17 (for the metro-level analysis, data are pooled into two-year periods to reduce year-to-year noisiness).

• First financings are still highly concentrated among a small number of cities. In 2016-17, five metros captured 54 percent of all U.S. first financings and ten metro areas accounted for 68 percent. That represents a slight expansion from 2009-10, when those same figures were, respectively, 52 percent and 65 percent.

• But, a number of startup communities continue to expand—including Boulder, Columbus, Indianapolis, Charlotte, Denver, and Durham-Chapel Hill. Key metros with relative rises (stable or slight declines during the period of sharp contraction overall) include Madison, San Diego, Pittsburgh, Raleigh, Houston, Baltimore, Seattle, Ann Arbor, Honolulu, Philadelphia, and Santa Barbara, among others.

Click over to read the whole thing.

This piece originally appeared on Urbanophile.

Aaron M. Renn is a senior fellow at the Manhattan Institute, a contributing editor of City Journal, and an economic development columnist for Governing magazine. He focuses on ways to help America’s cities thrive in an ever more complex, competitive, globalized, and diverse twenty-first century. During Renn’s 15-year career in management and technology consulting, he was a partner at Accenture and held several technology strategy roles and directed multimillion-dollar global technology implementations. He has contributed to The Guardian, Forbes.com, and numerous other publications. Renn holds a B.S. from Indiana University, where he coauthored an early social-networking platform in 1991.

Photo by David Shankbone [CC BY 3.0 ], from Wikimedia Commons

The Battle for Houston

$
0
0

Over the last half-century, Houston has developed an alternative model of urbanism. As the New Urbanist punditry mounts an assault on both suburban growth and single-family homes, Houston has embraced a light regulatory approach that reflects market forces more than ideology. But last year’s Hurricane Harvey floods severely tested the Houston model. An unprecedented four feet of rain in four days—a year’s worth, the greatest rainfall event in recorded U.S. history—overflowed the banks of every channel in Harris County, flooded nearly 100,000 homes (7 percent of the housing stock), and created an estimated $81.5 billion in damage, the nation’s second-largest natural disaster after Hurricane Katrina. Coupled with a downturn in the energy industry, which saw the loss of some 86,000 jobs last year, Harvey’s aftermath suggested that the region’s growth period had come to an end, with stagnant job growth and domestic migration.

Read the entire piece at City Journal.

Joel Kotkin is executive editor of NewGeography.com. He is the Roger Hobbs Distinguished Fellow in Urban Studies at Chapman University and executive director of the Houston-based Center for Opportunity Urbanism. His newest book is The Human City: Urbanism for the rest of us. He is also author of The New Class ConflictThe City: A Global History, and The Next Hundred Million: America in 2050. He lives in Orange County, CA.

Photo: Wally Gobetz, via Flickr, using CC License.

The Boom in Urban Housing Prices is Holding Back Economic Growth

$
0
0

Last year the New York Times ran a story on Ms. Sheila James, a 62-year-old woman who commutes two hours and 50 minutes each way between her home in Stockton, California, and her $81,000-a-year government job in San Francisco. 

The number of Americans like Ms. James with extreme commutes is growing, but their stories represent unusual exceptions that illustrate a larger pattern. More and more Americans are moving to less expensive regions of the country, or, more commonly, settling for the limited opportunities available in struggling communities like Stockton. These changes in the economic geography of American cities have far-reaching implications for upward mobility and economic growth.

Underlying the dilemmas many Americans face about where to live and work are two long-term reversals in the economy. First, for much of the 20th century, Americans were more willing to move in pursuit of economic betterment than people in any other advanced country, and the dominant flow of people was from poorer to wealthier locations. The best known migratory patterns were from farms and small towns to regional cities, from Southern agriculture to Northern manufacturing, and from poorer heartland areas to booming cities on the West Coast. 

This pattern has now reversed.  Mobility across state lines has fallen almost by half since the 1980s. In addition, virtually all the highest-income metro areas have experienced net domestic population outflows.

Second, the decades between the 1920s and 1980s saw a pronounced tendency towards economic convergence across geographies, as household income levels in lower-income states and cities grew faster than in high-income locations. This trend, too, has reversed, with the richest places growing richer at a faster pace than elsewhere and leaving less fortunate places behind. 

The emergence of these seismic shifts at the same time seems counter-intuitive at first glance. If the wealthiest cities are pulling ahead in terms of opportunities, why aren’t more people moving to them? For instance, why hasn’t the technology boom from Silicon Valley to Seattle induced more millennials to follow the legendary advice of the journalist Horace Greeley, to “Go West, young man”?

A growing number of economists offer a simple answer: most people can’t afford to live where the best opportunities are. Housing prices are just too high. Unless reversed with thoughtful policies, four trends are likely to keep driving the role “place” plays in America’s struggle with economic inequality.

Star cities and neighborhoods

Economists have long recognized the benefits an industry gains from geographic concentration. For a new firm, locating alongside existing firms in the same industry brings a deep pool of experienced workers, networks of specialized service providers, and knowledge “spillovers” from nearby competitors. This is why banking has concentrated in New York and film-making in Los Angeles, and why there are hundreds of lesser known industry concentrations across the country, such as musical instrument production in Elkhart, Indiana.

Enrico Moretti, a University of California at Berkeley economist, argues that the burgeoning role of “knowledge” industries is increasingly reinforcing these “agglomeration” benefits. Highly- educated graduates have powerful incentives to head for the major “brain hubs,” where up-and-coming employees can learn specialized skills by working with top experts in their fields. And local success begets more success. Star cities enjoy superior schools, higher civic participation, and healthier residents, compared to lower-income cities.

The result is widening gaps in the productivity of individual workers across metro areas, and thus growing income disparities as well. Harvard’s Ed Glaeser has calculated that productivity levels are more than five times higher in leading star metros like the San Jose-Palo Alto area than in relatively poor metros like McAllen, Texas.

Productivity is higher in star cities even after controlling for workforce composition, which means that, say, clerical and construction workers earn more by locating in knowledge hubs. Moreover, wages have grown much faster in the leading “high-skill” cities than in other cities since the 1980s, including for lower-skilled people in blue-collar and service jobs.  

Agglomeration benefits also play out within metro areas. They explain why it makes sense to locate a new corporate back-office campus in the Dallas area’s booming northern suburbs rather than in struggling southern Dallas. They also help to account for the stark polarization between “have” and “have-not” neighborhoods in most U.S. metro areas.

Land-use policies and housing prices

Historically, local economic booms led to housing booms. New construction would address the needs of arriving workers, and competition would keep house prices close to the cost of building new homes. Local housing markets have continued to work this way in thriving middle-income Sunbelt cities like Atlanta, Charlotte, and San Antonio.

But in today’s high-income “star” metros – above all the Bay Area and New York but also Boston, Seattle, and Southern California – this pattern has broken down. New construction in these cities is running as much as 80 percent below the peak levels reached in the 1960s.

This anemic pace of construction is not driven by building costs. In 11 star metros accounting for almost 20 percent of America’s population, house prices have spent the past dozen years comfortably higher than the minimum profitable construction cost for the local market, offering a fat margin that would ordinarily prove attractive to developers.  

The premise that these places are too dense to allow much construction also turns out to be a myth. Even in metros with densely-populated urban cores, the wider metro areas contain abundant low-density neighborhoods and indeed vacant space. Glaeser notes that the county containing his home in Cambridge, Massachusetts, has lower population density than Houston. 

Rather, the evidence suggests the main factor constraining housing supply in today’s star cities is increasingly burdensome land-use regulation. Critics point to a variety of rules, including minimum lot sizes (as in Boston’s suburbs), urban boundaries (as in Portland), stringent environment rules (especially in California), long building permit times, and caps on the number of permits. 

Cities also impose seemingly well-intended policies with predictable side effects. California, for instance, is considering repealing its law limiting rent control, which would drive up rents on ever-scarcer non-controlled units and present enormous disincentives for new construction.  

Several studies confirm that land-use rules have grown considerably stricter in the big coastal metros since the 1980s, and that the cities imposing the toughest regulations have experienced slower growth in supply and far more severe price appreciation than other U.S. cities.

The effect on housing prices has been especially pronounced for working-class housing, as regulatory constraints tend to bite harder in this segment than in more affluent neighborhoods. Prices have increased faster in middle-class Williamsburg in Brooklyn than on the Upper West Side since 2011, and more in Stockton’s San Joaquin Valley than in California as a whole.

Prices have now reached extraordinary levels. According to the data firm Demographia, median house prices in the top star cities are some 9 to 10 times median household income, or three times what is typically viewed as financially sustainable for a family. 

Booming prices and declining mobility

Even though wages for lower-skilled people have grown faster in the star metros than elsewhere, net returns after housing costs have generally deteriorated for these workers since early in the last decade. This helps explain why the net flow of lower-skilled people has been out of these cities, and why fewer people are moving to pursue economic opportunities at all.

Once again, the same dynamic is at work within metro areas. In geographically dispersed places like Houston and Dallas, neighborhoods with attainable housing for lower-skilled people are increasingly separated from good career opportunities by vast distances. Only an intrepid few sign up for extreme commutes like Ms. James’s.

Geographic mobility and growth

When the number of people who settle for living in low-opportunity locations is sufficiently large, poor matching of workers’ talents with available opportunities holds back growth for the whole economy. 

And there’s an additional effect: each high-skill job at companies like Apple requires as many as five middle- to low-skill jobs.  If there aren’t enough of these people available, companies don’t create as many high-skill jobs as they otherwise would, imposing further constraints on growth.

Moretti and his collaborator Chang-Tai Hsieh estimate that, if the New York and San Francisco Bay metro areas loosened their land-use restrictions to the average level of other cities, the tremendous influx of people and resulting increase in average productivity levels would lead to a 9 percent increase in the U.S. economy. Another study finds that a change by all states to the relatively loose rules of Texas would raise California’s population by 6 million, and the U.S. economy by almost 12 percent.

Bring the people to where the opportunities are

Urban revitalization policies centered on attracting businesses to areas with concentrations of lower-skilled people should have a place in America’s growth strategy. But the forces favoring agglomeration are powerful, especially in knowledge-based industries. Today’s star cities and neighborhoods will likely keep outpacing the rest of the country in productivity growth and wages.

This premise points to a clear conclusion: Smart policy should focus on bringing more people to where the opportunities are. Doing so will require:

• Relaxing many of the excessive land-use rules constricting the housing supply in thriving cities and neighborhoods;
• Large changes in tax and other policies, since so many policies are essentially designed to drive up housing values;
• Greater use of innovative transportation strategies, starting with multi-rider Lyft and Uber networks; and 
• A technological revolution in housing to reduce construction costs in dense areas. Helpfully, Google, Amazon, and various startups are starting to experiment in this area.

The thorniest challenge in addressing this issue is that local governments in star cities have little incentive to look after the interests of people who would benefit from moving there but can’t afford to do so. Moreover, they have little incentive to pursue policies that would maximize economic growth and opportunity but would impose unwanted changes on current residents.

This challenge raises a larger point. It’s common to think about how “the economy” affects particular geographic locations. But “the economy” is an add-up of many local economies. It’s time to focus attention on how local policies influence the national economy, as the essays in this issue of The Catalyst aim to do.

This piece originally appeared in The Catalyst, a journal of ideas from the Bush Institute.

J.H. Cullum Clark is Director, Bush Institute-SMU Economic Growth Initiative and an Adjunct Professor of Economics at SMU.

Photo: Travis Wise, via Flickr, using CC License.

Restoring Localism

$
0
0

Americans are increasingly prisoners of ideology, and our society is paying the price. We are divided along partisan lines to an extent that some are calling it a “soft civil war.” In the end, this benefits only ideological warriors and their funders.

One key source of this deepening division is the relentless centralization that has overtaken both our economy and our politics. Leaders of both parties have sat by while the forces of capital and government have centralized power and authority in ever fewer hands. When the federal executive branch changes hands, it’s not a political shift in the constitutional order but something closer to the kind of regime change associated with unstable countries. Increasingly, progressives favor ever more government control over people’s lives while conservatives see no limits to the power of the market.

Fortunately, there is a way out of this dilemma: a shift to local control. In a country that is ever more diverse culturally, racially, and economically, the best option is, within limits, to allow localities to determine their own fate, congruent with their own values and aspirations.

The issue here is not the irrelevance or intrinsic evil of government itself, but rather how to best address society’s primary challenges. Does the concentration of power make government more effective in addressing problems, or less so? Former Defense Secretary Robert Gates notes that the country needs to return to “the system of government bequeathed to us by the Founders,” saying that the expansion of government should be restrained “when so much of what we have works so poorly.”

Central authority is useful in such things as waging war, but a more expansive government has not, for example, improved education or seen more poor students attending college. A half century after the Great Society legislation, poverty remains higher than it was before it began. Leviathan has grown immense, but it has also failed.

Listening to the Founders

When the Founders crafted the Constitution, they understood the need for a strong federal government, but were profoundly aware of the dangers posed by the concentration of power. They had studied the successful growth of the Roman Republic, with its intricate system of checks and balances, followed by its devolution into a centralized state under one ruler.

The American Republic itself emerged in large part against monarchical control and the political oppression dealt to the colonies by the central government in London.[1] In Federalist 47, James Madison wrote: “The accumulation of powers legislative, executive, and judiciary in the same hands . . . may justly be pronounced the very definition of tyranny.”[2] The Constitution divided power in two ways: between the executive, legislative, and judicial branches of the federal government, and between the powers of the federal government and those “reserved to the states.”

The federal Constitution was enacted to ensure stability and security, but with limited powers. Madison believed a successful republic would require “checks and balances” between society’s “factions” to prevent them from gaining too much power and subverting the republican system, as occurred in Rome.[3]

Since then, localism has been a critical source of America’s dynamism. Participation in politics at the neighborhood and community level was one of the “habits of the heart” of which Alexis de Tocqueville spoke—one of the essentials in forming the American character, and sustaining free institutions.

In the ensuing nearly two centuries, this local spirit has decreased, in part due to the linkage between local control, or state’s rights, with the pure evil of slavery. Later, the challenges of the Depression, the Second World War, and the ensuing battle against communism favored the concentration of power in Washington, and increasingly in the executive.

The Rise of Leviathan

The view of the federal role as preeminent has deep roots in progressive thought. Herbert Croly’s 1909 book, The Promise of American Life, helped define progressivism beyond the ideas of the old Jacksonians and populists. It would fundamentally reshape American life; and the reshaping would be guided, promised Croly, not by the “monarchism” of the Constitution but by the disinterested ministering of “poet-leaders,” experts and social scientists.[4]

This notion of leading from the center accompanied a massive expansion of the federal bureaucracy. There were about 3,000 federal bureaucrats at the end of the Federal Period (approximately 1789 to 1823), and 95,000 when Grover Cleveland took office in 1881.[5] Since 1929, the federal government’s share of total public spending has risen from 39 percent to 53 percent. The federal bureaucracy has grown from a mere 600,000[6] employees to 2.7 million (a 2014 estimate).[7]

This role has expanded, fairly consistently, under both parties. For his part, George W. Bush increased the regulatory apparatus by 90,000 workers. Bush also expanded the federal role in education and health, and generally did little to reverse the inexorable concentration of power in Washington that already reached beyond the traditional federal role in fielding and deploying the U.S. military.

Federal power is increasingly based on the power of the purse and regulation. While the number of federal employees has not grown rapidly in recent years, the share of government spending controlled by the federal government—but often distributed through states and localities—has risen from 3 percent of GDP in 1900 to almost 22 percent in 2016. Every decade has brought more regulations, more agencies and departments, and more expansions of federal authority.

But perhaps no leader did more to expand federal power in peacetime than President Barack Obama. Under his “pen and phone” regime, the federal government issued more and more regulations, vastly expanding the power of the executive branch. The Heritage Foundation estimated that, as of 2015, the Obama administration had passed at least 184 “major rules” (regulations with at least a $100 million economic impact) and thousands of smaller rules. During its first six years, the Obama administration promulgated more than twice as many major rules as the first six years of the predecessor Bush administration.[8]

President Obama’s directives—particularly those dealing with the environment, housing, labor, race and gender—were implemented without legislative approval or even consideration, a marked shift from earlier eras of legislative-executive cooperation.[9] All of this has threatened the federalist vision, note authors Richard A. Epstein and Mario Loyola, turning local governments into “mere field offices of the federal government.”[10]

Can We Mount a Decentralist Rebellion?

President Trump, woefully ignorant of constitutional issues, is not likely to lead us away from centralization, although he may, for his own reasons, curb some of Obama’s worst excesses. More important may be public attitudes. By a wide margin—64 percent to 26 percent, according to a 2015 poll—Americans say that they believe that “more progress” comes from the local level than the federal level. Majorities of all political affiliations and all demographic groups hold this same opinion. Local governments, according to another 2015 survey, are thought to be particularly better at economic development, and at improving neighborhoods and education.

The tilt toward localism also extends to attitudes toward state governments, many of which have grown more powerful and intrusive in recent years, notably in California. Some 72 percent of Americans, according to Gallup, trust their local more than their state governmental institutions. Even in California, far more people prefer local control than being ruled from Sacramento. Strong majorities (70 percent of adults) prefer local government over state government.

Millennials, largely liberal on issues such as immigration and gay marriage, also are strongly in favor of community-based, local solutions to key problems. They might be, as one commentator suggests, more “socially conscious,” but they do not necessarily favor the top-down structure embraced by earlier generations; they prefer small units to larger ones. “Millennials are on a completely different page than most politicians in Washington, D.C.,” notes pollster John Della Volpe. “This is a more cynical generation when it comes to political institutions.”

Toward an Ideological Consensus

President Trump may have little interest in decreasing power, now that he holds it, but his presidency has increased support for a decentralizing strategy among some progressives. This includes such figures as the Brookings Institution’s Bruce Katz and urbanist Richard Florida, left-leaning pundits who now embrace the idea of freeing cities and regions from the grip of federal control.

Democrats, as liberal thinker Ross K. Baker suggests, may “own the D.C. swamp” but they are beginning to change their tune in the age of Trump. Even dutiful cheerleaders for Barack Obama’s imperial presidency, such as the New Yorker, are now embracing states’ rights.

Perhaps the most coherent case for left-of-center decentralization comes from a recent book by three prominent Democrats: former Al Gore aide Morley Winograd, pollster Mike Hais, and longtime Michigan political leader Doug Ross. In Healing American Democracy: Going Local, they make the case for decentralizing decision-making as one way to reduce polarization and the growing disillusionment with representative government as practiced in the United States today.

Within basic constitutional limits, the authors suggest a system which prefers that decision-making be as close to the citizens as possible. “That is where consensus and effective solutions are most likely to emerge,” they suggest. There’s little point, short of preserving basic constitutional protections, in forcing a common ground between, say, citizens in Portland, Oregon and those in the conservative eastern part of that state, or in making California harmonize with Mississippi.

Of course, once back in power, many progressives will once again find federal power appealing. But as millennials become more important, and information technology disrupts the political norms of former generations, many progressives might embrace a decentralist solution, particularly if they recognize that the nation remains, for the most part, center-Right in orientation.

The Conservative Conundrum

Historically conservatives have favored local control—after all, they are supposed to favor small government. But when in power at the national level, they have shown an unfortunate tendency to act with the centralizing zeal of Soviet apparatchiks.

In states like Texas and North Carolina, right-wing legislators have actually expanded state powers in order to limit political heterodoxy on environmental issues and cultural issues. As analyst Aaron M. Renn points out, these assaults on local control are carried out by conservative legislators who want to contravene the progressive agenda of core cities while, in blue states, progressive-dominated state governments frequently seek to override more conservative local governments.

There is another, and perhaps even more pernicious, conservative trend: to refuse localities the right to protect themselves from the unwanted ramifications of untrammeled capital. Throughout much of the past quarter century, libertarianism—largely averse to government regulation and fervent about reliance on private initiative—has been the unofficial faith of the GOP. Yet this tendency also has a downside when it comes to the realities of how people want to live.

A classic case came up recently in California, with a bill, proposed by state senator Scott Wiener of San Francisco, to remove local government control of housing development in certain areas. This bill is part of a concerted progressive attempt to attack the suburban way of life embraced by most Americans. Some libertarian conservatives, supposed champions of “small government,” supported a measure that would leave local governments and communities out of decisions affecting their day-to-day lives.

Needed: A New Political Paradigm

If progressives and conservatives could come to an agreement on localism, it would constitute the electorate’s best protection against ideologically driven, unwanted intrusions by both capital and government. What is needed is not enforced unanimity but the nurturing of multiple alternatives. We need to allow states to serve as what the progressive Justice Louis Brandeis described as “laboratories of democracy.” These entities, he suggested, can “try novel social and economic experiments without risk to the rest of the country.” In other words, let Oregon legislate one way, and Texas and Oklahoma another. Voters could then judge what approach they prefer and try to prove what works best.

Under these localist principles, states also would decentralize authority. California’s coastal power structure, largely concentrated in the Bay Area, should not be so able to impose policies that mean real hardship in Fresno, Riverside, or Redding. Similarly, progressive redoubts in places like North Carolina should be able to legislate their preferences without being gagged by the more conservative rural areas.

The country’s Founding was based largely on the idea of giving communities control over their own money and their own fate. The decades-long rush to centralize power—whatever the political orientation—has undermined our union, and left the country on the road, inevitably, to a new kind of interminable conflict. It is time to reverse course.

[1] See John Adams’s recounting of the history of Rome in Defence of the Constitutions: “We may affirm the contrary; that a standing authority in an absolute monarch, or an hereditary aristocracy, is less friendly to the monster than a simple popular government; and that it is only in a mixed government, of three independent orders, of the one, the few, and the many, and three separate powers, the legislative, executive, and judicial, that all sorts of factions, those of the poor and the rich, those of the gentlemen and common people, those of the one, the few, and the many, can at all times be quelled. . . . The only remedy is to take away the power, by controlling the selfish avidity of the governor, by the senate and house; of the senate, by the governor and house; and of the house, by the governor and senate.”

[2] Madison’s full quote in Federalist 47: “The accumulation of all powers, legislative, executive, and judiciary, in the same hands, whether of one, a few, or many, and whether hereditary, self-appointed, or elective, may justly be pronounced the very definition of tyranny.”

[3] Charles and Mary Beard, The Rise of American Civilization (MacMillan and Company, 1930), pp. 334-35.

[4] Fred Siegel, Revolt Against the Masses: How Liberalism Has Undermined the Middle Class (Encounter, 2013), pp. 9-10.

[5] James Q. Wilson, “The Rise of the Bureaucratic State,”The Public Interest, Fall 1975.

[6] Irving Stern, “Government Employment Trends, 1929 to 1956,” Monthly Labor Review 80:7 (July 1957), 811-815, published by the Bureau of Labor Statistics, U.S. Department of Labor.

[7] “Total Government Employment Since 1962,” Historical Federal Workforce Tables, Office of Personnel Management, Washington, D.C. Available at: https://www.opm.gov/policy-data-oversight/data-analysis-documentation/federal-employment-reports/historical-tables/total-government-employment-since-1962/

[8] James Gattuso and Diane Katz, “Red Tape Rising: Six Years of Escalating Regulation Under Obama,” the Heritage Foundation, Washington, D.C., May 11, 2015.

[9] For example, the working relationship between President Bill Clinton and House Speaker Newt Gingrich.

[10] Richard A. Epstein and Mario Loyola, “The United State of America: Washington Is Expanding Its Power by Turning State Governments into Instruments of Federal Policy,”The Atlantic, July 31, 2014.

This piece originally appeared in Law and Liberty.

Joel Kotkin is executive editor of NewGeography.com. He is the Roger Hobbs Distinguished Fellow in Urban Studies at Chapman University and executive director of the Houston-based Center for Opportunity Urbanism. His newest book is The Human City: Urbanism for the rest of us. He is also author of The New Class ConflictThe City: A Global History, and The Next Hundred Million: America in 2050. He lives in Orange County, CA.

Photo by Ckelley [CC BY-SA 3.0 ], from Wikimedia Commons

Guangzhou, South and Central China and the Yellow River by Train

$
0
0

The prelude to my round trip by train across the Gobi Desert from Lanzhou (Gansu) to Urumqi (Xinjiang) was a trip from Hong Kong to Lanzhou. This article includes photos from that trip, and some from previous trips, as noted on the figures. The travel highlight was a 10.5 hour and 2,700 kilometer (1,700 mile) train trip from Guangzhou to Lanzhou, through southern and central China, then turning west along the Yellow River. It was all daylight until the train entered more than 100 miles of tunnels on the final approach to Lanzhou.

The Pearl River Delta

The trip started on the MTR urban rail line from Hung Hom Station in Kowloon, Hong Kong (Figure 1). Hong Kong now has an urban area population of nearly 7.5 million, about a million more than Dallas-Fort Worth or Toronto. Figure 1 shows the International Finance Centre, which at 484 meters (1,588 feet) and 108 floors is the 10th tallest building in the world. The International Finance Center is located across Hong Kong Harbor, in Kowloon, on the mainland, rather than on Hong Kong Island, where the tallest buildings traditionally have been located.

The MTR trip ended at the Futian Border Crossing between Hong Kong and Shenzhen. Travelers use a weather protected walkway across the Shenzhen River. The Shenzhen urban area had a population of less than 100,000 in 1980, which has grown to 13 million, and is now the 26th largest in the world. It is about the population of Tehran or Istanbul. Figure 2 shows the Futian CBD (central business district), with the Ping An Finance Center, which is the 4th tallest building in the world, at 599 meters (1,965 feet) and 115 floors.

After visiting Shenzhen, the next leg of the trip was a quick, 55 minute ride from Futian Station to Guangzhou South Station. Guangzhou South is emerging as the key rail hub in the Pearl River Delta with travel times of one hour or less with service now or soon available from all cities, including Hong Kong and Macao. The top photograph is of the Zhujiang New Town, Gaungzhou’s new CBD, taken on a stormy night from Canton Tower (second tallest free-standing television tower in the world), at 604 meters or 1,982 feet). Zhujiang has been constructed in the last decade. It includes the 7th tallest building in the world, the CTF Finance Centre, at 530 meters, nearly as tall as New York’s World Trade Center. It also includes the 17th tallest, the International Finance Centre, at around the height of the Willis (former Sears) Tower in Chicago, just east across the central axis. Figure 4 is Baiyun New Town, the redeveloped former international airport. The new Baiyun International Airport is located about 24 kilometers (15 miles) north, but still within the urban area.

The New Fuxing Train

After a few days in Guangzhou I boarded train G72 for Lanzhou, which departed at 8:55 a.m. The trainset was the new “Fuxing” Series, (Figure 4) which has a 400 kilometers per hour (kph) or 249 miles per hour (mph) top operating speed, and will run at 350 mph (217 kph) on many trips throughout China starting in September. The top speed on this trip was approximately 310 kph (193 mph). There were only five intermediate stops, making the average trip segment nearly 450 kilometers (275 miles), and a very fast average speed of more than 255 kph, or nearly 160 miles mph. The Guangzhou to Xi’an segment, with only three intermediate stops was even faster, at 279 kph (173 mph). By comparison, a later high-speed, similar length rail trip from Lanzhou to Shanghai had 19 intermediate stops and averaged only 190 kph (115 mph).

Guangzhou to Zhengzhou

The first part of the trip was through the Guangzhou-Foshan urban area, the core of the Greater Bay Area, the largest continuous extent of urbanization in the world, with nearly 55 million people. But, it’s not long until the greenery of rural south China dominates the scenery. (Figures 5-8).

The first stop was Changsha (11:12 a.m.), the capital of Hunan province, with an urban area population of 4 million (about the size of Berlin, Sydney or Seattle). Changsha sits astride the Xiang River, a tributary of the Yangtze. Figure 9 shows development in the old core, with IFS Tower I in the distance in the new central business district along the river, approximately 3 kilometers (2 miles) to the west, The IFS Tower is the 11th tallest in the world, at 94 floors and 452 meters (1,483 feet). This equals the height of the Petronas Twin Towers in Kuala Lumpur, the tallest in the world from 1998 to 2004. Changsha was to be the home of the world’s tallest building, a prefabricated structure to be built in 90 days that would have reached 220 floors. The project has now been cancelled due to environmental concerns.

Changsha has had particularly intense urban expansion and development for its size. Figure 10 is a major residential condominium construction project. Xiangtan, birthplace of Chairman Mao Zedong borders on Changsha. Beyond Changsha, the country is a bit less hilly, but every bit as green (Figures 11 & 12).

The next stop was Wuhan (12:33 p.m.), sometimes called the Chicago of China, due to its heavy industry. Wuhan, the capital of Hubei province and China’s 10th largest urban area, has slightly fewer residents than Chicago, which has 9 million. Wuhan was amalgamated in 1927 from the cities of Hankou, Wuchang and Hanyang in 1927. The city is nearly split in half by the Yangtze River which averages about 1.6 km. wide (1 mile). By comparison, the Hudson River adjacent to lower Manhattan in New York is about 1.3 km. wide. The CBD is shown in the distance in Figure 13, 14 km from Wuhan North Station (9 miles), on the other side of the Yangtze. It includes the new Wuhan Center Tower, which, when complete, will be 438 meters tall (1,437 feet), 88 floors and among the 20 tallest in the world.

The first bridge permanent crossing of the Yangtze was opened here in 1957 (Figure 14). Now, according to China Daily, there are more than 160 bridges and tunnels cross the Yangtze. As the train leaves Wuhan, the rural greenery starts again and dominates the scenery north of Wuhan (Figure 15).

Zhengzhou, the capital of Henan is the next stop, at 2:33 pm, and is just south of the Yellow River. Zhengzhou has an urban area population of 7 million, similar in size to the Essen (Rhine-Ruhr) urban area, Dallas-Fort Worth or Toronto. The G4 Expressway, which runs from Hong Kong to Beijing is shown in Figure 16, just south of Zhengzhou. The photograph also shows the Chinese expressway network “shield” similar to the US “interstate” highway shield. Zhengzhou’s “new” CBD (central business district) was labeled as a “ghost city” by the Daily Mail, a characterization I disputed as premature from visiting the site. Forbes writer Wade Shepard noted that this is a general tendency with respect to the new developments in China, noting that “We're are all too often too quick to criticize new cities and shower them with proclamations of doom, we are all too often too quick at the trigger.” (Figure 17) The wide arterial streets of Zhengzhou, typical of Chinese post 1980 development are shown in Figure 18.

Zhengzhou to Xi’an

At Zhengzhou, the train turns west, following the route toward Xi’an, generally to the south of the Yellow River and north of the Qinling Mountains. Figure 19 shows agricultural country between Zhengzhou and Luoyang, which served as an ancient capital of China. The Qinling Mountains, spectacular though not very lofty in this area, resemble the Alps in their contour (Figures 20-22). The rail line does not cross the Yellow River, which turns 90 degrees north toward Inner Mongolia, forming the Ordos Loop. The Yellow River rejoins the rail line at the end of the trip (Lanzhou).

Xi’an, perhaps the most famous of China’s ancient capitals (then called Chang’an) is reached at 4:31 p.m. Xi’an has an urban area population of over 6 million, about the size of Miami or Philadelphia. The capital of the province of Shaanxi (Figures 23-24), Xi'an sits on the Wei River, a tributary of the Yellow. The city wall, which dates to the 14th century but has been rebuilt through the intervening centuries, is an important historical attraction (Figure 25). The museum of the terra cotta warriors is close by.

Xi’an to Lanzhou

The train slows down after Xi’an, where speeds are limited, at least for now, to 250 kph. Agricultural and mountainous country resumes after Xi’an (Figures 26-28). Tianshui, reached at 6:06 p.m., is by far the smallest urban area (400,000) with a stop (Figure 29). Shortly after this point the mountains begin to climb (Figures 30-33), a significant barrier, leading to the fact that much of the rest of the trip is in tunnels. At one point west of Tianshui, there was a station in a tunnel (not served by this train), which residents would have to reach by elevators and/or stairs.

The train arrived at the final stop, Lanzhou at 7:24 p.m. Lanzhou (Figures 34-35) is the capital of the province of Gansu, with an urban area population of 3 million (about the size of San Diego or Minneapolis-St. Paul). Lanzhou is also the home of one of China’s most famous dishes, Lanzhou noodles (this video shows how they are made in Lanzhou).

It was a very interesting trip, from the world’s largest collection of adjacent urban areas through the greenery of south and central China and then westward along the Yellow River, all with more than its share of the world’s tallest man-made structures. Anyone who wishes to see where cities are headed in the 21st Century needs to come to China.

Wendell Cox is principal of Demographia, an international public policy and demographics firm. He is a Senior Fellow of the Center for Opportunity Urbanism (US), Senior Fellow for Housing Affordability and Municipal Policy for the Frontier Centre for Public Policy (Canada), and a member of the Board of Advisors of the Center for Demographics and Policy at Chapman University (California). He is co-author of the "Demographia International Housing Affordability Survey" and author of "Demographia World Urban Areas" and "War on the Dream: How Anti-Sprawl Policy Threatens the Quality of Life." He was appointed to three terms on the Los Angeles County Transportation Commission, where he served with the leading city and county leadership as the only non-elected member. He served as a visiting professor at the Conservatoire National des Arts et Metiers, a national university in Paris.

Photograph: Zhujiang CBD, Guangzhou, by author. All photographs by author.

Viewing all 3789 articles
Browse latest View live


Latest Images